EURGBP – Bearish Continuation in Play?Hello TradingView Family / Fellow Traders. This is Richard, also known as theSignalyst.
📈EURGBP has been overall bearish trading within the falling channel marked in orange.
Moreover, the green zone is a strong structure.
📚 As per my trading style:
As #EURGBP approaches the red circle zone, I will be looking for bearish reversal setups (like a double top pattern, trendline break , and so on...)
📚 Always follow your trading plan regarding entry, risk management, and trade management.
Good luck!
All Strategies Are Good; If Managed Properly!
~Richard Nasr
Disclosure: I am part of Trade Nation's Influencer program and receive a monthly fee for using their TradingView charts in my analysis.
Parallel Channel

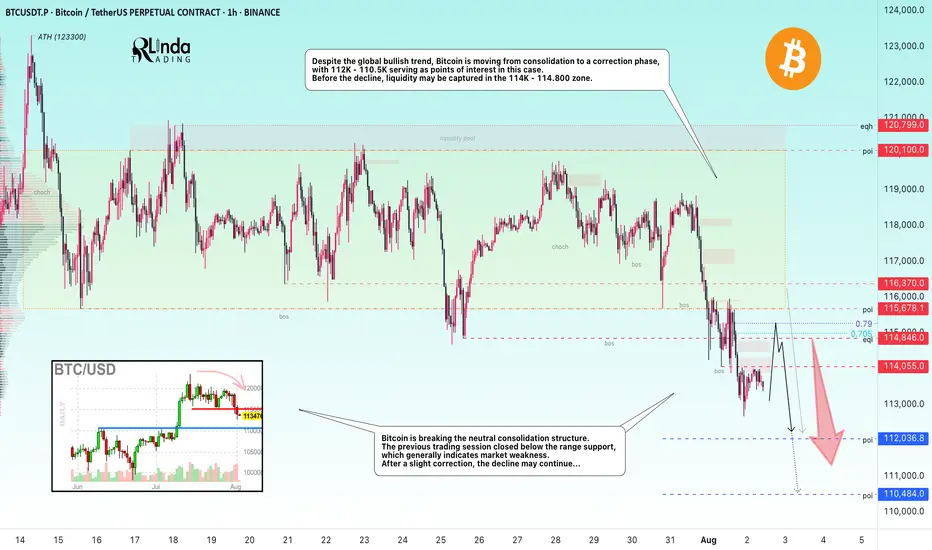
BITCOIN → From consolidation to distribution. Market weaknessBINANCE:BTCUSDT.P is moving from consolidation to a correction phase. The price broke through the support zone of 114.5–115.5, closing within the Friday trading session in the sell zone...
Previous idea from July 22: BITCOIN → Consolidation and compression to 116K. Correction?
The fundamental background is shifting to neutral, the hype has temporarily ended, and there are no bullish drivers yet. And for the health of the market, a correction is needed. Bitcoin is breaking the neutral consolidation structure. The previous trading session closed below the support range, which generally indicates market weakness. Despite the global bullish trend, Bitcoin is moving from consolidation to a correction phase, with 112K - 110.5K serving as points of interest in this case. Before the fall, liquidity may be captured in the 114K - 114.800 zone.
Resistance levels: 114.05, 114.85, 115.67
Support levels: 112.03, 110.48
After a strong movement, the market may enter a correction or local consolidation, during which it may test the specified resistance zones before continuing its downward movement to the zone of interest and liquidity at 112 - 110.5.
Best regards, R. Linda!
The next big moveMarket would be all way down soon, head are shoulder was identified at the chart, identifying a market reversal confirmation, further down moves are to be seen
MAGIC : Magic is neededHello friends🙌
📈Given the good rise we had, the price is now in the ascending channel, now in the specified support areas, you can buy in steps with risk and capital management and move to the specified targets.
🔥Follow us for more signals🔥
*Trade safely with us*

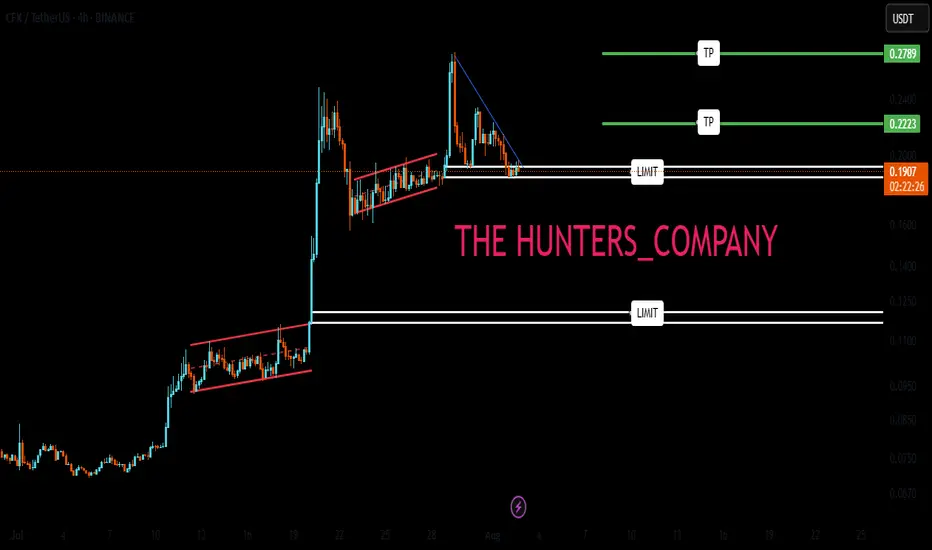
CFX : don't be afraidHello friends🙌
If you take risks, you will win. If you don't, you will regret it.
✅Given the good price growth, now that the price is in a correction phase, there is a good opportunity to buy with risk and capital management, of course, at the specified support levels and move with them to the set targets.
🔥Follow us for more signals🔥
*Trade safely with us*
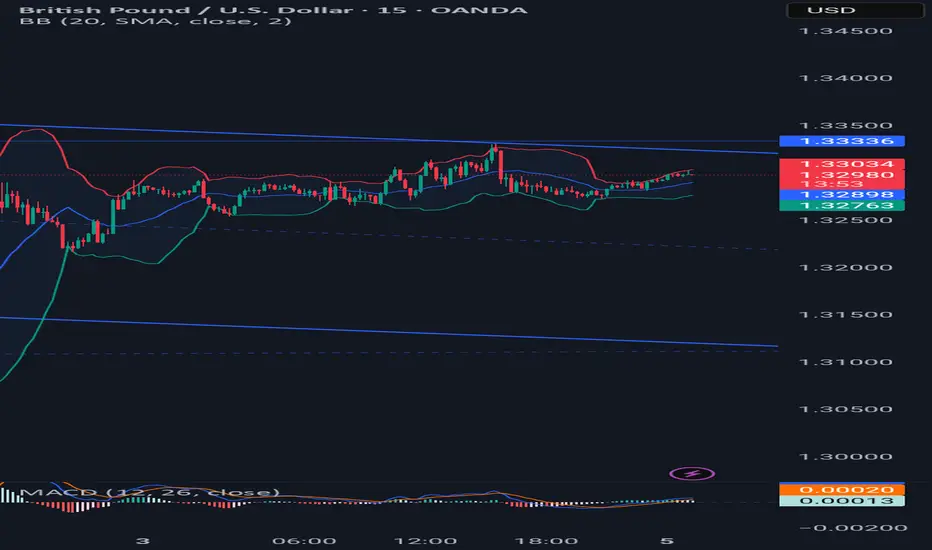
GBPUSD – Bearish Bounce Loading?Hello TradingView Family / Fellow Traders. This is Richard, also known as theSignalyst.
📈GBPUSD has been overall bearish trading within the falling channel marked in red and it is currently in a correction phase.
Moreover, the blue zone is a strong supply.
📚 As per my trading style:
As #GBPUSD approaches the red circle zone, I will be looking for bearish reversal setups (like a double top pattern, trendline break , and so on...)
📚 Always follow your trading plan regarding entry, risk management, and trade management.
Good luck!
All Strategies Are Good; If Managed Properly!
~Rich
Disclosure: I am part of Trade Nation's Influencer program and receive a monthly fee for using their TradingView charts in my analysis.

USDJPY → False breakdown of upward trend supportFX:USDJPY is testing trend support as part of a correction triggered by news. The dollar has been recovering since the start of the session, giving the pair a chance to rise.
As part of a correction against the backdrop of sharp and unexpected Friday NFP data, the currency pair is forming a false breakdown of trend support and testing the 0.7f buy zone. The market is reacting to the retest of support. Momentum is forming. Focus on the local range of 147.6 - 147.9. If the bulls keep the price above this consolidation, the price may continue to rise
Resistance levels: 147.95, 149.02
Support levels: 157.55, 147.0
Focus on the trend and the indicated consolidation, which may move into the realization phase. If the bulls take the initiative, the pair will have a chance to rise to 149 - 150.8.
Best regards, R. Linda!

Loss of Momentum Pattern Into StructureSimilar to the OANDA:GBPJPY that I shared, the OANDA:EURAUD has put in a pretty aggressive and direct move into a previous level of structure. However, what makes this opportunity different than "the beast" is that as price approach our level of resistance we started to put in a rising channel which is a loss of momentum pattern along with other clues such as divergence on the RSI.
If you have any questions, comments or want to share your views, please do so below. Also be sure to hit that like button & give me a follow, that way you don't miss my future trading ideas.
Akil

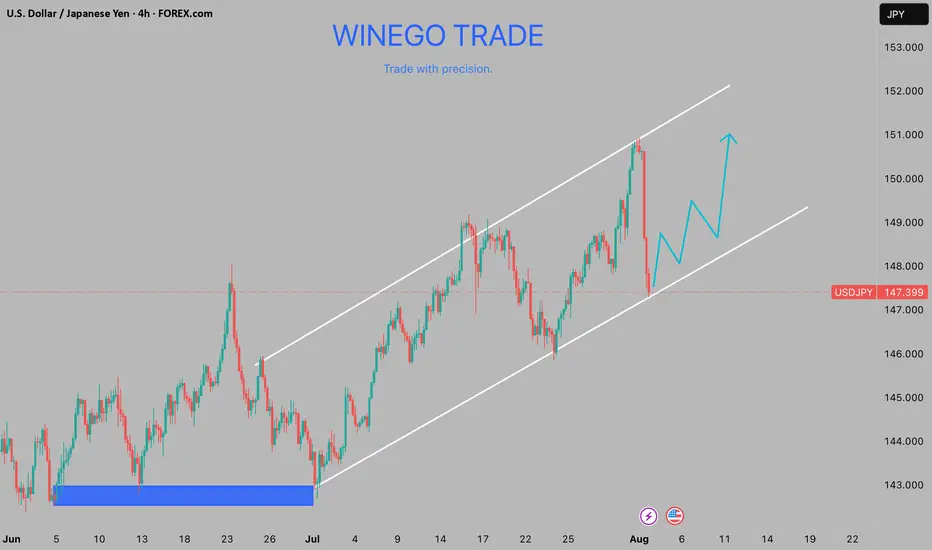
UDSJPY DRIVEN BY A BULLISH TRENDThe USDJPY pair is currently trading within a well-defined upward channel, showcasing a bullish trend that has been unfolding over recent periods. This upward trajectory is supported by a series of higher lows, with the most recent formation occurring near the 147.40 support level.
The pair's ability to hold above this level and potentially bounce off the trend-line suggests a strong foundation for further upside movement. A key level to watch in this context is 147.80, which, if breached to the upside, would likely provide further confirmation of the bullish momentum. Such a break would not only reinforce the existing upward trend but also potentially accelerate the pace of the advance.
In conclusion, the USDJPY pair's current technical setup appears conducive to further upside movement, driven by the bullish trend within the upward channel and supported by the recent higher low formation. A break above 147.80 would be a key catalyst for accelerating the bullish momentum, potentially paving the way for a move towards higher resistance levels.
DXY SHORT Well, the dollar index is in a descending channel. The expectation is that the price will fall from the channel ceiling to the channel floor.
This post will be updated.,

CADJPY - Downside to continueSellers has taken control with a massive push down, wait for bearish continuation to form to confirm another sell opportunity.
Good Luck

BTC.D is on the verge of a collapse...Hello Traders 🐺
In this idea I want to use one of my favorite trading tools to identify the support levels for BTC.D — and as you probably guessed, it's the EMA Ribbon!
As you might know, EMA Ribbon is one of the best types of EMA indicators you can use, because it gives you a wide range of dynamic support and resistance based on exponential moving averages. Most importantly, when you apply it on higher timeframes like the weekly or monthly chart, it becomes incredibly accurate.
In the BTC.D chart, we now have two points of confluence meeting each other:
the red weekly support box
the last strand of our dynamic support, which is the EMA Ribbon
But what now?
Well, considering the bearish divergence on the weekly chart, the overbought zone on RSI in the monthly timeframe, and the current setup in altcoin charts, I think we can say — with a high degree of certainty — that BTC.D is on the verge of a collapse...
Make sure to act accordingly — and as always, remember our golden rule:
🐺 Discipline is rarely enjoyable, but almost always profitable. 🐺
🐺 KIU_COIN 🐺

Are we good to go?BTC.D broke slightly below the channel in July, and the August monthly candle has already retested it. Are we ready for a further downside on BTC.D?
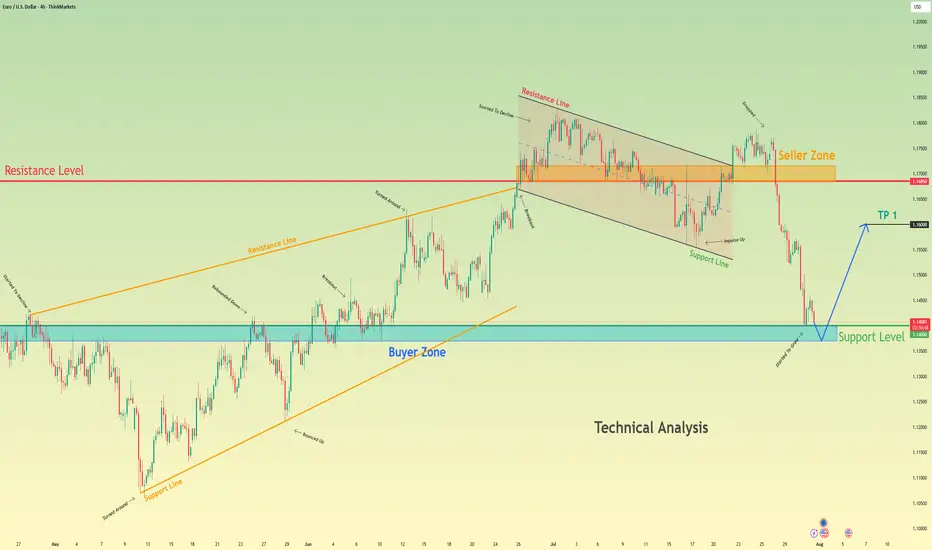
Euro bounce from buyer zone and start to move upHello traders, I want share with you my opinion about Euro. After a prolonged upward trend which formed a large rising wedge, the EURUSD faced a significant rejection from the seller zone near the 1.1685 resistance level. This failure to continue higher marked a key turning point, exhausting the bullish momentum and initiating a new bearish market phase. This new phase has since taken the form of a well-defined downward channel, within which the price has been undergoing a series of downward corrections and impulses. The most recent market action has been a sharp downward fall, accelerating the price's descent towards a critical area of historical significance. Currently, the pair is approaching the major support level at 1.1400, which also constitutes a strong buyer zone where demand has previously stepped in. The primary working hypothesis is a long, counter-trend scenario, which anticipates that the current bearish momentum will be absorbed by the strong demand within this buyer zone. A confirmed and strong rebound from this 1.1400 support area would signal a potential temporary bottom and the start of a significant upward correction. Therefore, the tp for this rebound is logically set at the 1.1600 level, a key psychological and technical point that represents a realistic first objective for a bounce of this nature. Please share this idea with your friends and click Boost 🚀
Disclaimer: As part of ThinkMarkets’ Influencer Program, I am sponsored to share and publish their charts in my analysis.
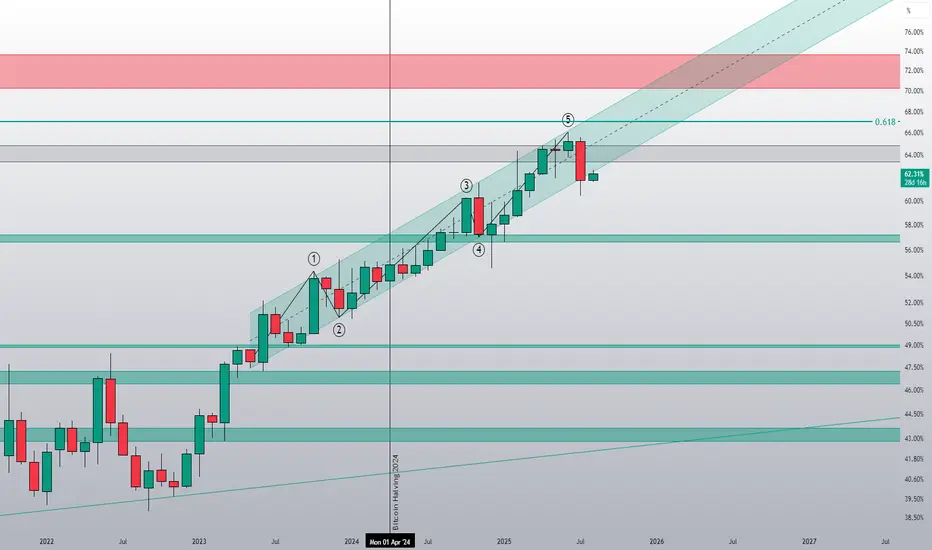
Bullish Channel Intact: BTC Poised for Next Leg Toward 152KBitcoin continues to coil within a bullish consolidation zone above the critical $114.5k–$117.5k Immediate Demand Zone, firmly riding the ascending channel structure that has guided price since the March swing low. The prior wave structure confirms a clean ABC correction, followed by a powerful breakout and a structured range indicative of accumulation, not exhaustion.
The RSI shows persistent bullish divergence, confirming hidden strength, with multiple support bounces confirming demand. The current tight consolidation above former resistance now flipped demand presents a launchpad scenario for a breakout towards major projected upside targets.
Targets to Watch:
🟢 $123,053 – Range breakout threshold, aligns with channel midline and prior local high.
🟢 $134,428 – Measured move from current range and top channel boundary intersection.
🟢 $152,174 – Final leg projection based on macro channel trajectory and bullish wave extension potential.
On the downside, failure to hold $114.5k opens the door to a test of the $105k Strong Support Zone, which aligns with prior structural demand and broader trendline confluence.
💬 Drop your favorite altcoins in the comments for quick analysis , let's catch the next movers before they fly!

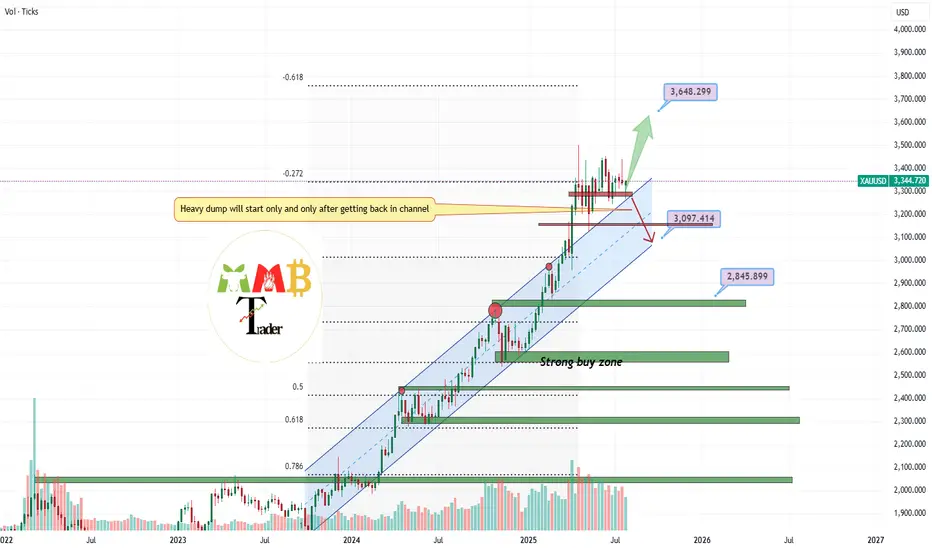
GOLD channel breakout retest complete more pump ahead As we can see the blue channel resistance is gone and also now it turn to strong and valid support and retest is also complete and gold is now targeting 3600$ easy.
DISCLAIMER: ((trade based on your own decision))
<<press like👍 if you enjoy💚
GOLD → The market is waiting for NFP. What could happen?FX:XAUUSD is bouncing off resistance at 3310, confirming the upper limit of the new trading range. The dollar continues to rally, but the market as a whole is stagnating ahead of upcoming news—NFP is coming up!
Gold is consolidating at monthly lows around $3268, awaiting key US labor market data (NFP). Trump's new tariffs (10% globally, 35% for Canada, 39% for Switzerland) have boosted demand for the dollar, putting pressure on gold. Markets are waiting for NFP: forecast +110K jobs, unemployment 4.2%. Weak data (<100K) → gold may rise to $3400. Strong (>150K) → the dollar will strengthen, gold will continue to fall. The probability of a Fed rate cut in September is <50%.
Based on yesterday's data, I would cautiously suggest that NFP will be in the range of 125K–145K, slightly above the consensus (110K). This will play into Trump's hands (I think you understand what I mean...).
Resistance levels: 3300, 3310, 3320
Support levels: 3287, 3268, 3255
The news has a negative nuance — unpredictability. Be careful.
Technically, based on the data we have at the moment, I would assume that the market may test resistance at 3300-3310 before a possible pullback to the specified support. BUT! Unpredictable data could turn the game around, and in that case, if the dollar falls, gold could start to rise.
Best regards, R. Linda!

AUDNZD still bullish trend expecting
OANDA:AUDNZD last five analysis accurate (attached), here is new view on AUDNZD, still bullish expecting, price is not break strong zone, bouncing - pushing strongly from same, looks like DESCENDING CHANNEL is breaked.
Here still bullish expectations having.
SUP zone: 1.09100
RES zone: 1.10300, 1.10600

SP500 → Countertrend correction before growthFX:SPX500 is correcting against an upward trend. In the second half of the week, the market received fairly positive fundamentals during the reporting period.
S&P 500 futures found support after strong reports from Meta and Microsoft, which exceeded earnings expectations and forecasts thanks to AI. The rise in futures supported demand for the “Magnificent Seven” despite Powell's hawkish comments. The focus is on Apple and Amazon reports in the evening, which could strengthen the tech rally. On Friday, we are seeing a countertrend correction in which the market is testing the 6288 zone of interest.
Support levels: 6288.4, 6262.6
Resistance levels: 6342, 6371
Most likely, the market will form a false breakout of support during the correction. If the bulls keep the index above the key level, we can expect continued growth in the short and medium term.
Best regards, R. Linda!

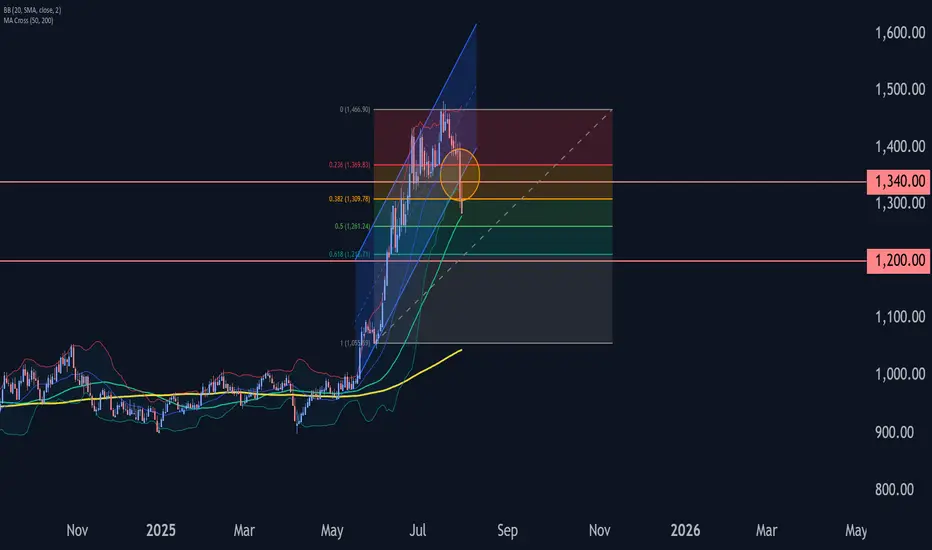
Platinum Wave Analysis – 31 July 2025- Platinum broke support zone
- Likely to fall to support level 1200.00
Platinum recently broke the support zone located between the key support level 1340.00 (low of the previous minor correction iv) and the support trendline of the daily up channel from May.
The breakout of this support zone accelerated the c-wave of the active ABC correction 4.
Given the bearish sentiment across the precious metals markets, Platinum can be expected to fall to the next support level 1200.00 (target for the completion of the active wave c).
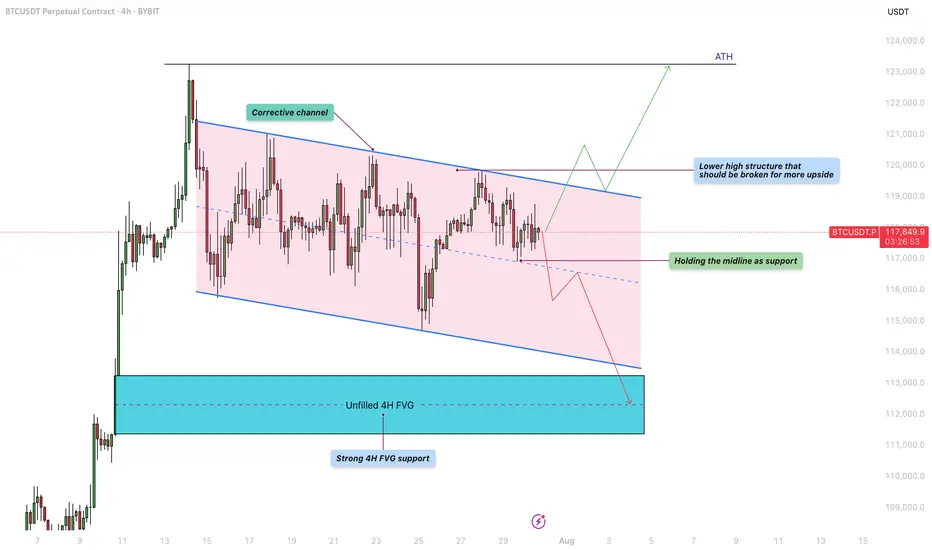
Bitcoin - Will the liquidity at $122K be the next target?Bitcoin is currently trading within a defined corrective channel, which has been developing over the past few weeks. Price action within this structure has been characterized by a sequence of lower highs and lower lows, suggesting a mild downtrend. However, these movements lack strong momentum, indicating that the market is consolidating rather than entering a deeper correction. This kind of structure often precedes a significant breakout, and given the nature of the current price action, a retest of previous highs remains a realistic possibility.
Bullish Scenario
Looking at the overall structure of the channel, a bullish breakout seems increasingly likely. For this scenario to unfold, BTC needs to hold the midline of the channel as support. If this level is respected, it could pave the way for a push towards the upper boundary of the channel and a potential break above the lower high structure near $120,000. A successful breach of that level could trigger a move toward the $122,000 liquidity zone, with the potential to challenge the all-time high (ATH) in the near future. Holding the midline and breaking above key resistance would provide confirmation of strength and continuation to the upside.
Bearish Scenario
On the flip side, if BTC fails to hold the midline as support and starts closing below it on the 4H timeframe, we could see a renewed move toward the lower boundary of the corrective channel. This could lead to a test of the unfilled 4H fair value gap (FVG) highlighted in the chart, located around the $112,000 – $113,000 area. This zone also coincides with a strong historical support level, making it a logical area where buyers might step in and provide the momentum needed for a more sustainable bullish reversal.
Final Thoughts
While both scenarios remain valid, the price structure within the corrective channel currently leans slightly more toward a bullish outcome. The lack of aggressive selling and the potential for liquidity above the previous highs support this view. However, trading is never about certainty but about preparing for various possibilities. Being aware of both bullish and bearish setups allows traders to react with flexibility and discipline depending on how the market unfolds in the coming sessions.
-------------------------
Thanks for your support. If you enjoyed this analysis, make sure to follow me so you don't miss the next one. And if you found it helpful, feel free to drop a like 👍 and leave a comment 💬, I’d love to hear your thoughts!
Journey of silver buy at support sell at resistance There is Up trending channel, follow the channel and make money since silver is long term bullish atleast.
Not mentioning the levels do the math follow the channel and find the support

META : Old Peak can be TestedMeta platform has lost altitude from the channel it has formed since 2023, but has gained momentum and re-entered the channel. The possibility of testing the old peak contains a good RR rate.Of course, with a stop-loss close to the 200-period moving average.( Risk/Reward Ratio : 2.48)
Stop-Loss: 605.47
Target : 740.10
