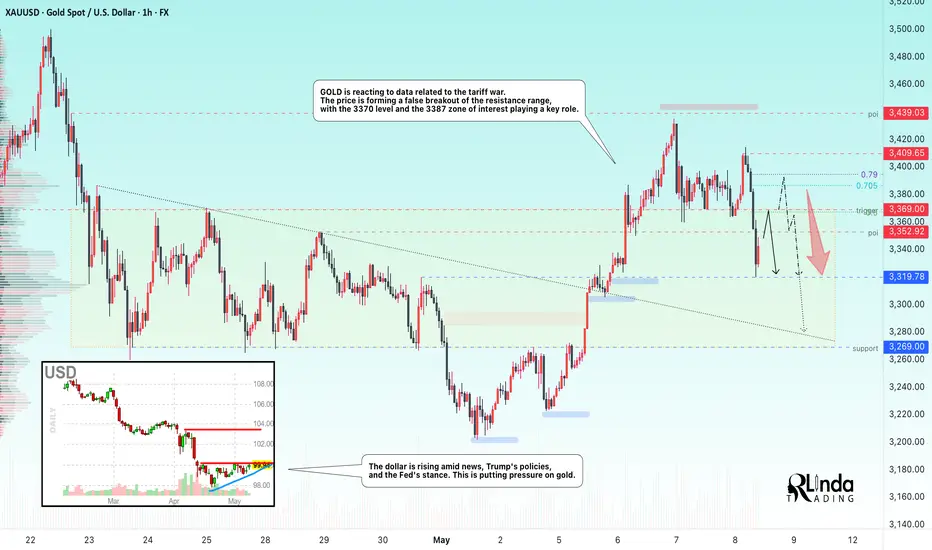
GOLD → Return to range. Fall from resistance...FX:XAUUSD is reacting to data related to the tariff war. The price is returning to the range and forming a false breakout of resistance. The level of 3370 and the zone of interest at 3387 play a key role.
On Thursday, gold rose to $3,400 amid a weaker dollar, increased demand for safe-haven assets, and continued uncertainty due to US trade policy and tensions in the Middle East and Ukraine. The Fed left rates unchanged and expressed caution in its assessment of the outlook, which also supports gold's rise.
However, in the European session, we are seeing gold react to the trade deal with Britain, most likely due to the easing of tariffs. Now the main focus is on the terms of the deal. We should not forget about China, where the situation remains tense, but everyone is waiting for a resolution.
Resistance levels: 3352, 3369, 3385
Support levels: 3319, 3269
The fundamental backdrop changes several times a day. At the moment, the situation is as follows: the rise of the dollar, the weakening of the tariff war, and the hawkish stance of the Fed may put pressure on gold. Therefore, I expect the decline to continue after a retest of 3370-3386. In this case, the target could be 3319.
Best regards, R. Linda!
Parallel Channel
SOLANA → Resistance level and free zone for growth up to 180.0BINANCE:SOLUSDT.P is holding steady and consolidating near the resistance level of the global price range of 152.85–111.85. Thus, the market has signaled that it is in a positive mood. A trigger is ahead...
SOL is forming a flag consolidation near the upper border of the trading range of 152 - 111, which indicates the accumulation of pre-breakout potential. A breakout from the flag, a break of resistance, and consolidation above 152.85 could provide support and growth. The cryptocurrency market is reviving after yesterday's news and relatively positive data in the tariff war. Countries are gradually beginning to agree, which is generally supportive for the crypto market.
Resistance levels: 152.85
Support levels: 144.6, 141.2
A breakout of the resistance range of 152.85 and consolidation of the price above this level will confirm the readiness for further growth. Further on, there is a free zone and the price can easily reach 180.00.
Best regards, R. Linda!

So finally Nifty recedes a bit due to Indo-Pak tensions.Finally Nifty today receded a bit due to Indo-Pak tensions and war like situation/war between Indo-Pak. The support levels for Nifty now remains at 23924, 23809 important (Father line support of hourly chart), 23676 important mid channel support if this support is broken bears can drag Nifty further down to 23462, 23279, 22771 and finally 22579 which is the channel bottom support. If this level is broken there can be further free fall. Resistances on the upper side remain at 24111, 24247 (Mother Line resistance on the hourly chart), 24443, 24634 and 24892 (Channel top resistance). Situation remains fluid due to the Geo-Political situation no support can be very strong support as a lot can happen during the week end and no resistance can be a solid resistance if few things move in the anticipated direction.
Disclaimer:The above information is provided for educational purpose, analysis and paper trading only. Please don't treat this as a buy or sell recommendation for the stock or index. The Techno-Funda analysis is based on data that is more than 3 months old. Supports and Resistances are determined by historic past peaks and Valley in the chart. Many other indicators and patterns like EMA, RSI, MACD, Volumes, Fibonacci, parallel channel etc. use historic data. There is no guarantee they will work in future as markets are highly volatile and swings in prices are also due to macro and micro factors based on actions taken by the company as well as region and global events. Equity investment is subject to risks. I or my clients or family members might have positions in the stocks that we mention in our educational posts. We will not be responsible for any Profit or loss that may occur due to any financial decision taken based on any data provided in this message. Do consult your investment advisor before taking any financial decisions. Stop losses should be an important part of any investment in equity.

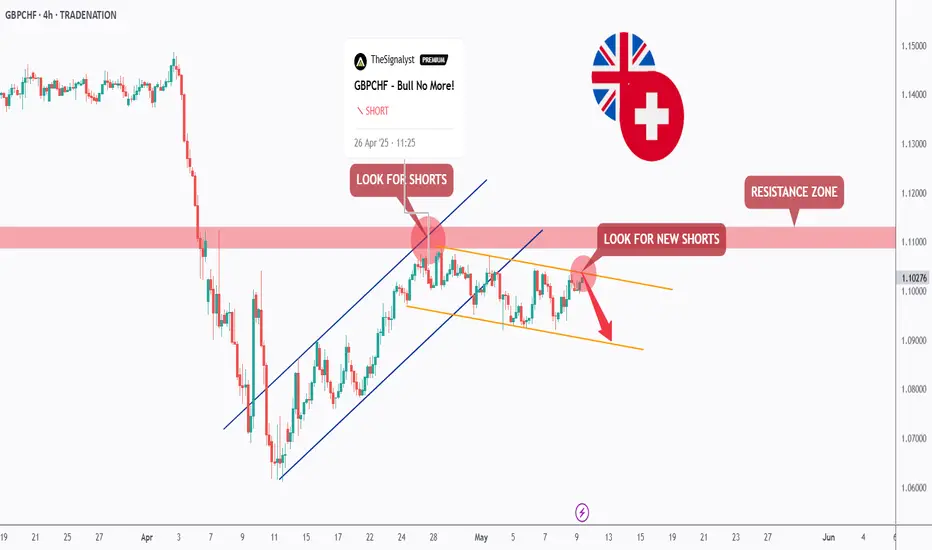
GBPCHF - Short Again!Hello TradingView Family / Fellow Traders. This is Richard, also known as theSignalyst.
📉As per our last GBPCHF analysis (attached on the chart), it rejected the red resistance zone and has been trading lower.
Short-term, GBPCHF has been trading within the falling channel marked in orange and today, it has been rejecting the upper bound of the orange channel.
🏹 Thus, the highlighted red circle is a strong area to look for sell setups as it is the intersection of the upper orange trendline aligned with the previous long-term analysis/trend.
📚 As per my trading style:
As #GBPCHF is hovering around the red circle zone, I will be looking for bearish reversal setups (like a double top pattern, trendline break , and so on...)
📚 Always follow your trading plan regarding entry, risk management, and trade management.
Good luck!
All Strategies Are Good; If Managed Properly!
~Rich
Disclosure: I am part of Trade Nation's Influencer program and receive a monthly fee for using their TradingView charts in my analysis.
Gold at critical stage (ready to short)Gold is at critical stage any movement from here will be sharp downside, I will wait for it
It is forming M pattern in Day chart

Bullish Airlines Cleared for Altitude!After squinting at the 4H chart like Sherlock with a caffeine addiction, I’ve confirmed: our price broke out of a flag pattern like it was tired of napping. It even did the polite thing—came back to retest—like, “Excuse me, just checking if I actually broke out. Yep. Cool.”
Now it’s back on its bullish treadmill, charging uphill like a gym bro after pre-workout.
As long as we’re above 3200, this beast might just pump harder than Bitcoin on caffeine and hopium.
🎯 Final destination? 161.80% Fib extension at 3580.22—aka “Mount Take Profit.”
Pack snacks. It’s a climb.

Euro may correct to support area and then start to move upHello traders, I want share with you my opinion about Euro. Looking at this chart, we can see how price has been confidently trending within an upward channel, supported by strong impulses and consistent demand from the lower boundary. The price initially rebounded from the buyer zone, which later became the launchpad for a major upward move. After breaking the resistance line of the channel, the Euro made a clean breakout and confirmed its strength with a retest from above, a clear sign of bullish continuation. This upward momentum carried price directly into the support area, which has since served as a key zone for consolidations. The market then shifted into a horizontal range, trading within well-defined boundaries, with repeated rejections near the top and steady rebounds from the bottom support. What’s crucial now is that the Euro is again testing the lower border of this range while holding above the current support level at 1.1270. Given this structure, a strong preceding trend, clean reaction at the bottom of the range, and ongoing consolidation without deeper breakdowns, I expect the price to rebound from this zone and continue higher. My TP1 is set at 1.1575, the upper boundary of the current range, which remains a logical magnet for price in the short term. Please share this idea with your friends and click Boost 🚀

Bitcoin may correct a little and then continue to grow in wedgeHello traders, I want share with you my opinion about Bitcoin. The price has been moving confidently inside an upward wedge structure, which often signals a continuation in strong bullish trends but also warns of potential exhaustion if momentum fades. In this case, the wedge is forming after a clear impulse move and is supported by a solid base at the buyer zone. Multiple impulses from this level and consistent support at the current support zone have pushed the price higher, with bullish momentum now clearly in control. After a breakout from the previous resistance zone and a clean retest of the support area, the price started a strong rally. This move aligns well with the wedge formation, where both trend lines are narrowing upward, indicating that buyers are pushing steadily higher while sellers are becoming more aggressive, a setup that often leads to an explosive breakout if the resistance is breached. Now BTC trades above 93700, consolidating slightly below the wedge resistance line. Based on the wedge geometry and the strong impulse structure that preceded it, I expect the price to continue growing and test the 100000 level, which aligns perfectly with the upper wedge boundary and serves as my TP 1. Please share this idea with your friends and click Boost 🚀

Attention BTCUSDT may fall in next week!If BTCUSDT fails to break the 101,300 resistance, it could fall to 71,200 next week

MarketBreakdown | EURUSD, USDCAD, NZDUSD, USDCHF
Here are the updates & outlook for multiple instruments in my watch list.
1️⃣ #EURUSD daily time frame 🇪🇺🇺🇸
EURUSD formed a huge head and shoulders pattern.
The price is currently testing its horizontal neckline.
Bearish breakout of that and a daily candle close below
will confirm a bearish reversal and push the prices lower.
2️⃣ #USDCAD daily time frame 🇺🇸🇨🇦
The price is breaking a solid falling trend line.
Its violation is an important bullish signal that
indicates a strength of the buyers.
We can expect even more growth.
3️⃣ #NZDUSD daily time frame 🇺🇸🇳🇿
The pair is consolidating within a horizontal range.
The price is going to reach its support soon.
I suggest looking for a pullback trade from that then.
4️⃣ #USDCHF daily time frame 🇺🇸🇨🇭
The price is stuck within a horizontal parallel channel.
I expect a bullish continuation within that and a test
of its upper boundary.
Then, look for a confirmation to see and try to catch a retracement from that.
Do you agree with my market breakdown?
❤️Please, support my work with like, thank you!❤️
I am part of Trade Nation's Influencer program and receive a monthly fee for using their TradingView charts in my analysis.

GOLD → The rally has given way to a correction. News aheadFX:XAUUSD is rising amid a challenging geopolitical environment. During the Asian session, a correction to the zone of interest (0.5 Fibonacci) is forming. The situation is quite complex and tense.
On Tuesday, the metal strengthened to 3433 due to tensions in the Middle East, but during the Asian session, gold fell sharply due to optimism surrounding the upcoming US-China trade talks, the strengthening of the dollar, and profit-taking ahead of the Fed's decision.
Investors are waiting for Powell's speech, which will determine the future of interest rate policy.
Despite the decline, gold is supported by ongoing geopolitical risks in the Middle East, Eastern Europe, and South Asia.
Theoretically, if the bulls keep the price above 0.5 Fibonacci, the growth may continue to 3439, as the price has not yet reached the liquidity zone.
Resistance levels: 3439
Support levels: 3369, 3352
However, unpredictable data could trigger a return of the price to the range and a correction to 3323-3300. Risk is posed by upcoming news: FOMC, Powell's speech, and the rate meeting. The Fed's hawkish stance could put pressure on gold...
Best regards, R. Linda!

NZDCAD → Intra-range trading. Retest of resistanceFX:NZDCAD is strengthening within a neutral trading range. The currency pair is supported by the dollar's correction, but how long will this last? Ahead of us are the FOMC meeting and Powell's speech...
The focus is on the trading range within which the currency pair continues its local trend. Liquidity around the 0.8317 level is attracting the price. The correction of the dollar is having a positive effect on the NZD. However, news is ahead, and traders are expecting a hawkish stance from the Fed. Against this backdrop, a reversal may occur...
Since the currency pair is in a neutral range, there is a high probability of a false breakout and correction.
Resistance levels: 0.83175
Support levels: 0.82644, 0.8235, 0.8225
The liquidity zone is likely to stop the price (temporarily or reverse it). Further movement depends on fundamental sentiment, but based on rumors about the Fed's position, it is worth carefully analyzing what data the market will receive this evening. A tougher Fed policy or hints of one could strengthen the dollar and weaken currencies...
Best regards, R. Linda!

XAUUSD MADE PARALLEL CHANNELHere I Created This XAUUSD Chart Analysis
Pair : XAUUSD (Gold)
Timeframe: 30-Minute
Pattern: Parallel Channel
Momentum: Bullish/ BUY
Entry Level : BUY 3380
Support zone : 3370
Target Will Be : 3415
Disclaimer : This signal is based on personal analysis for learning purposes. Trade at your own risk and always use proper risk management.

GBPJPY UPDATEHello friends
Given the channel break and the continuation of the decline, we expect the price to move to the two specified supports.
*Trade safely with us*

Gold Rally Running Out of Steam? PRZ May Trigger Drop!Gold ( OANDA:XAUUSD ) has hit the targets as I shared with you in yesterday's idae . Will this uptrend of the past 5-6 days continue?
Gold seems to have broken through the Resistance zone($3,387-$3,357) and has been moving in an Ascending Channel for the past 5 days .
In terms of Elliott Wave theory , Gold appears to be completing microwave 5 of the main wave 3 . The end of the main wave 3 can be at the Potential Reversal Zone(PRZ) .
Also, expect to see a clear Regular Divergence(RD-) between Consecutive Peaks at the Resistance zone($3,434-$3,406) .
I expect Gold to start declining from the Potential Reversal Zone(PRZ) and at least to the lower line of the ascending channel . This analysis is against the main trend, so pay more attention to money management .
Note: If Gold touches $3,448(Stop Loss(SL)), we can expect more pumps.
Note: If Gold falls below $3,342, we can expect a deeper decline than expected.
Gold Analyze ( XAUUSD ), 1-hour time frame.
Be sure to follow the updated ideas.
Do not forget to put a Stop loss for your positions (For every position you want to open).
Please follow your strategy; this is just my idea, and I will gladly see your ideas in this post.
Please do not forget the ✅' like '✅ button 🙏😊 & Share it with your friends; thanks, and Trade safe.

GOLD → An amazing recovery. Up to 3400?FX:XAUUSD continues to strengthen, testing resistance in the range, with buyers not giving up. The price breaks through the flat line and enters the buying zone; everything depends on the bulls...
Gold is rising for the second day in a row amid a weak dollar, increased demand for safe assets, and escalating conflicts in the Middle East and Eastern Europe.
Market nerves are being stoked by trade risks and instability in Asia, while investors await the Fed's decisions and Powell's speech.
GOLD is breaking out of its neutral range. Focus on 3369 and local resistance at 3381. The fundamental backdrop is favorable for gold. If buyers hold their ground above the indicated levels, the price may continue to rise.
Resistance levels: 3369, 3381, 3408
Support levels: 3352 (0.5f), 3330
I do not rule out the possibility of a retest of the local liquidity zone (long squeeze) at 3352 (0.5f) before continuing to rise. But at the moment, the focus is on 3369-3370, which are key levels (currently acting as support).
Best regards, R. Linda!

VIRTUALUSDT → Rebound from resistance. Trend break, U-turn?BINANCE:VIRTUALUSDT.P is pausing within an uptrend and forming a range within which signals of a possible reversal and decline are appearing.
Bitcoin is pausing its rally and moving into correction. This is a negative development for altcoins, which will not grow without the flagship.
VIRTUAL is consolidating, but pressure is building in the market (as can be seen from the cascade of resistance levels within the range). Another prerequisite for a breakdown of the market structure is a downward exit from the upward channel (a break of the trend support). Another retest of support at 1.581 could trigger a breakout and a fall. There is a fairly free zone below, and the nearest target is located in the 1.178 zone.
Resistance levels: 1.72, 1.829
Support levels: 1.581, 1.416, 1.178
Focus on the current range of 1.581 - 1.829. The chart shows that the price continues to storm and test support, which is an important signal against the backdrop of a broken uptrend. A break of support at 1.581 and consolidation below this level could trigger liquidation and a fall to the fvg zone or the liquidity zone at 1.178.
Best regards, R. Linda!

USDCAD → Storming the support level to break throughFX:USDCAD continues to storm support within the trading range amid a global downtrend
The currency pair is within the range, but the battle for support continues. The reaction to false breakouts is weakening and the price continues to attack the 1.378 level, which only increases the chances of a further decline
The dollar is rebounding from resistance and beginning to fall, which is having a corresponding effect on USDCAD. If the currency pair breaks 1.378 and consolidates below the level, this could trigger a continuation of the trend after consolidation...
Resistance levels: 1.381, 1.383
Support levels: 1.378, 1.374
Focus on the lower boundary of the trading range at 1.378. The role of the range is consolidation against the backdrop of a downtrend. Thus, a breakout of support will activate the distribution phase
Best regards, R. Linda!

OTHERS.D: A New PerspectiveIt looks like we're forming a bottom for altcoins. Altcoin season seems to be getting closer by the day.

Is Tesla Running Out of Road?Tesla has been rangebound for the last two months, and some traders may think it’s running out of road.
The first pattern on today’s chart is the March high of $291.85. The EV maker peaked around the same level in late April and remains stuck there again in early May. That may suggest resistance is in place. Will traders look for a return to the recent lows under $220?
Next, the stochastic oscillator is turning down from overbought territory.
Third, the 50-day simple moving average (SMA) had a “death cross” under the 200-day SMA in mid-April. That may suggest its longer-term trend is getting more bearish.
Finally, TSLA is one of the most active underliers in the options market. (Its 2.7 million average contracts per day ranks No. 2 in the S&P 500, according to TradeStation data.) That may help traders take positions with calls and puts.
TradeStation has, for decades, advanced the trading industry, providing access to stocks, options and futures. If you're born to trade, we could be for you. See our Overview for more.
Past performance, whether actual or indicated by historical tests of strategies, is no guarantee of future performance or success. There is a possibility that you may sustain a loss equal to or greater than your entire investment regardless of which asset class you trade (equities, options or futures); therefore, you should not invest or risk money that you cannot afford to lose. Online trading is not suitable for all investors. View the document titled Characteristics and Risks of Standardized Options at www.TradeStation.com . Before trading any asset class, customers must read the relevant risk disclosure statements on www.TradeStation.com . System access and trade placement and execution may be delayed or fail due to market volatility and volume, quote delays, system and software errors, Internet traffic, outages and other factors.
Securities and futures trading is offered to self-directed customers by TradeStation Securities, Inc., a broker-dealer registered with the Securities and Exchange Commission and a futures commission merchant licensed with the Commodity Futures Trading Commission). TradeStation Securities is a member of the Financial Industry Regulatory Authority, the National Futures Association, and a number of exchanges.
Options trading is not suitable for all investors. Your TradeStation Securities’ account application to trade options will be considered and approved or disapproved based on all relevant factors, including your trading experience. See www.TradeStation.com . Visit www.TradeStation.com for full details on the costs and fees associated with options.
Margin trading involves risks, and it is important that you fully understand those risks before trading on margin. The Margin Disclosure Statement outlines many of those risks, including that you can lose more funds than you deposit in your margin account; your brokerage firm can force the sale of securities in your account; your brokerage firm can sell your securities without contacting you; and you are not entitled to an extension of time on a margin call. Review the Margin Disclosure Statement at www.TradeStation.com .
TradeStation Securities, Inc. and TradeStation Technologies, Inc. are each wholly owned subsidiaries of TradeStation Group, Inc., both operating, and providing products and services, under the TradeStation brand and trademark. When applying for, or purchasing, accounts, subscriptions, products and services, it is important that you know which company you will be dealing with. Visit www.TradeStation.com for further important information explaining what this means.

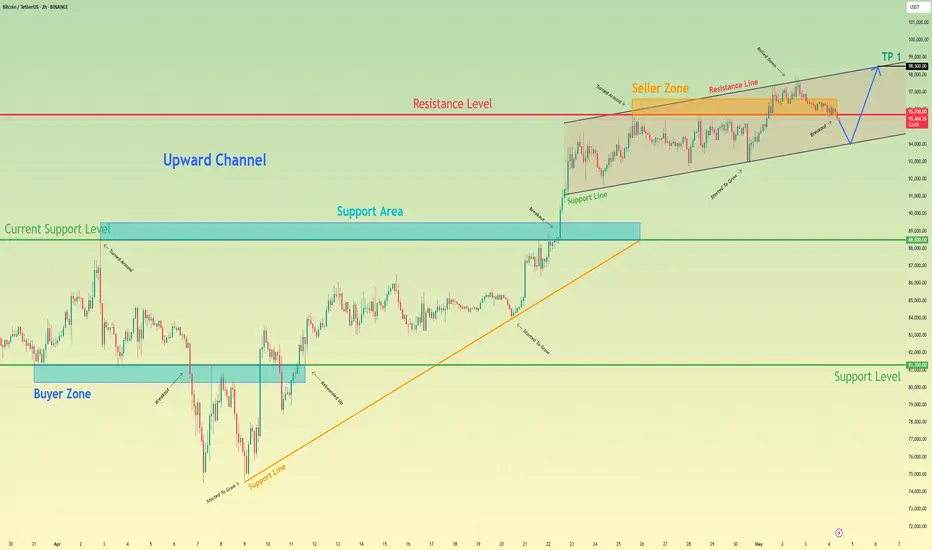
Bitcoin can bounce from support line of channel to 98500 pointsHello traders, I want share with you my opinion about Bitcoin. Looking at this chart, we can observe how the price of Bitcoin has been in recent price action. The asset had been confidently moving inside an upward channel, building structure through higher highs and higher lows. Each upward impulse was supported by pullbacks to the support line, showing continued buyer pressure. The latest breakout above the support area confirmed a bullish continuation, and the price entered the seller zone, where it faced resistance. Despite multiple attempts to break through, the price repeatedly turned around, forming a tight triangle pattern within the upper boundary of the channel. Currently, the price has broken down from the triangle, but it still holds above the channel's lower line. Given that the channel remains intact and there's no strong breakdown of the structure, I expect the price to rebound from the lower boundary and continue climbing toward my TP 1 at 98500, which aligns with the resistance line of the channel. Please share this idea with your friends and click Boost 🚀
GOLD (XAUUSD): Your Plan to Buy
The recent fundamentals pumped Gold prices again.
The market is currently trading above a significant
daily resistance.
To confirm a validity of a breakout and to avoid a trap,
I suggest paying close attention to a minor horizontal
range on a 4H time frame.
Your signal to buy will be a 4H candle close above 3388.
It will confirm a breakout and increase the chances that the price will go up.
Goal will be 3435
❤️Please, support my work with like, thank you!❤️
I am part of Trade Nation's Influencer program and receive a monthly fee for using their TradingView charts in my analysis.

BTC is following a Rising Channle BTC is following a rising channel in the Daily timeframe, as shown in this chart.
BTC is also following a Cup n Handle Pattern in the Weekly timeframe.
I believe that before taking a bullish rally, it will take a small pullback up to 82K or 75 K.
At this stage, we will have to keep a keen eye on BTC movement to find a better bottom to enjoy this rally.
Please comment if you have a different idea or agree with me.
