GOLD → Consolidation. Traders are waiting for news...FX:XAUUSD remains in consolidation at 3370-3270. Traders are in no hurry to take any action, as there is a lot of important news ahead. Let's take a closer look at the situation...
On Wednesday, gold is trading lower, remaining in a sideways range as traders await the release of US GDP data for the first quarter. A sharp slowdown in growth is expected, and a possible contraction in the economy could increase bets on a Fed rate cut and support gold. Meanwhile, the dollar is holding steady amid tariff news and expectations for key employment and inflation data.
A retest of the range support is forming. The approach is quite sharp, and the pre-breakout potential has been exhausted. A false breakout of support could trigger an upward correction.
Support levels: 3270, 3245
Resistance levels: 3314, 3329, 3352
If the dollar continues to fall after the news, this could support gold and the price could continue to trade between 3370 and 3270. Unpredictable news could trigger a breakout and a fall.
Best regards, R. Linda!
Parallel Channel

NZDUSD Continues to Trade Under the Pressure of a Strong DollarHey Traders, in today's trading session we are monitoring NZDUSD for a selling opportunity around 0.59400 zone, NZDUSD is trading in a downtrend and currently is in a correction phase in which it is approaching the trend at 0.59400 support and resistance area.
Trade safe, Joe.

Bank of America May Face a DowntrendBank of America has rebounded sharply in recent weeks, but some traders may expect a move to the downside.
The first pattern on today’s chart is the series of lower highs since March 3. Combined with the low in early April, a falling channel may have formed.
Second is the price zone between roughly $39 and $40, which represents a basing area March 10-13. BAC is now stalling at the same level, which may suggest old support has become new resistance.
Third, stochastics on the megabank are turning down from an overbought condition.
Next, the 50-day simple moving average (SMA) had a “death cross” below the 200-day SMA earlier this month. That may indicate the long-term trend has turned negative.
Finally, BAC is a highly active underlier in the options market. That could help traders take positions with calls and puts.
TradeStation has, for decades, advanced the trading industry, providing access to stocks, options and futures. If you're born to trade, we could be for you. See our Overview for more.
Past performance, whether actual or indicated by historical tests of strategies, is no guarantee of future performance or success. There is a possibility that you may sustain a loss equal to or greater than your entire investment regardless of which asset class you trade (equities, options or futures); therefore, you should not invest or risk money that you cannot afford to lose. Online trading is not suitable for all investors. View the document titled Characteristics and Risks of Standardized Options at www.TradeStation.com . Before trading any asset class, customers must read the relevant risk disclosure statements on www.TradeStation.com . System access and trade placement and execution may be delayed or fail due to market volatility and volume, quote delays, system and software errors, Internet traffic, outages and other factors.
Securities and futures trading is offered to self-directed customers by TradeStation Securities, Inc., a broker-dealer registered with the Securities and Exchange Commission and a futures commission merchant licensed with the Commodity Futures Trading Commission). TradeStation Securities is a member of the Financial Industry Regulatory Authority, the National Futures Association, and a number of exchanges.
Options trading is not suitable for all investors. Your TradeStation Securities’ account application to trade options will be considered and approved or disapproved based on all relevant factors, including your trading experience. See www.TradeStation.com . Visit www.TradeStation.com for full details on the costs and fees associated with options.
Margin trading involves risks, and it is important that you fully understand those risks before trading on margin. The Margin Disclosure Statement outlines many of those risks, including that you can lose more funds than you deposit in your margin account; your brokerage firm can force the sale of securities in your account; your brokerage firm can sell your securities without contacting you; and you are not entitled to an extension of time on a margin call. Review the Margin Disclosure Statement at www.TradeStation.com .
TradeStation Securities, Inc. and TradeStation Technologies, Inc. are each wholly owned subsidiaries of TradeStation Group, Inc., both operating, and providing products and services, under the TradeStation brand and trademark. When applying for, or purchasing, accounts, subscriptions, products and services, it is important that you know which company you will be dealing with. Visit www.TradeStation.com for further important information explaining what this means.

Ethereum about to flyAs the falling channel for ethereum has broken few days ago, now the weekly MACD is about to make a bullish cross as well, and that makes ethereum to fly soon

DOTUSDDOT is retesting the breakout line which coincides with the bottom of the upward channel.
Support level: $3.96
RSI is bullish.

Netflix Wave Analysis – 29 April 2025
- Netflix broke key resistance level 1063.40
- Likely to rise to resistance level 1150.00
Netflix recently broke the key resistance level 1063.40 (former multi-month high from February, which stopped the B-wave of the previous ABC correction (B)).
The price just broke the resistance trendline of the weekly up channel from October – which should accelerate the active impulse waves 3 and (5).
Given the clear daily uptrend, Netflix can be expected to rise toward the next resistance level 1150.00, target price for the completion of the active impulse wave 3.

Monero Wave Analysis – 29 April 2025
- Monero broke resistance area
- Likely to rise to resistance level 300.00
Monero cryptocurrency recently broke the resistance area between the resistance level 240.40 (former multi month high from the start of this year) and the resistance trendline of the weekly up channel from the middle of 2024.
The breakout of this resistance area accelerated the active short-term impulse wave 5, which belongs to wave (3) from the start of 2024.
Given the clear weekly uptrend, Monero can be expected to rise toward the next round resistance level 300.00.

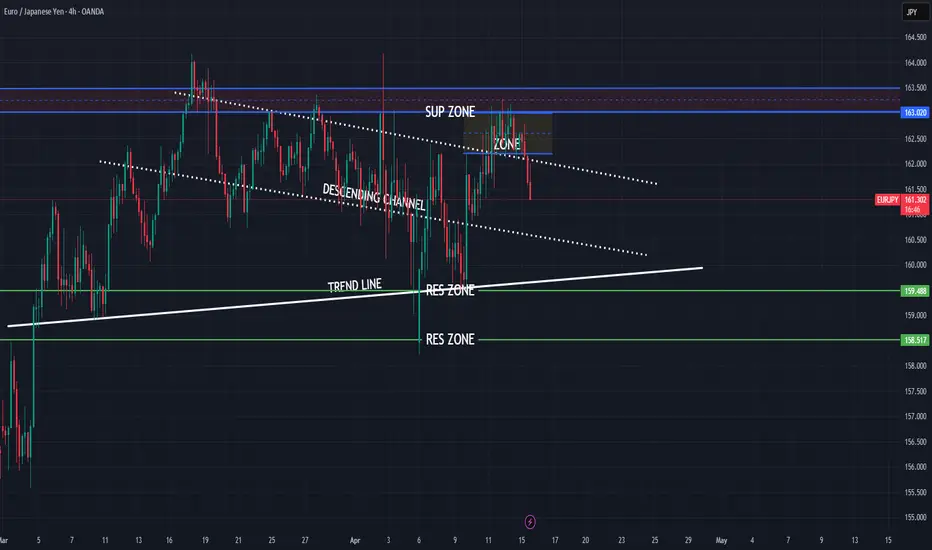
EURJPY strong bearish expectations
OANDA:EURJPY strong bullish expectations i am have, but things will not go like expected..
Currently price in DESCENDING CHANNEL, in moment we are have break of same, but price is make revers in zone and pushing now bearish.
Here now exepcting fall till trend line.
SUP zone: 163.000
RES ozne: 159.500, 158.500
BNBXBT. Bullish Cross and 71% locally.Testing the moving average as support after a bounce from a long downtrend and here right now is a good entry point. AI-Agents is quite new and here on BNB chain it makes a lot of sense as the chain is in top5 in the market (liquidity, TVL). It is difficult to find a more suitable place for this, both for investment and for tech.

GOLD → Consolidation ahead of news. What to expect?FX:XAUUSD is consolidating. Focus on 3370 - 3269. Economic data is expected tomorrow, and gold is likely to trade within the consolidation range for several days.
Optimism about US trade talks with key partners boosted risk appetite and supported the dollar. The US Treasury Secretary reported progress with India, while President Trump softened his rhetoric on China, which also strengthened the dollar. At the same time, traders took a wait-and-see stance ahead of the release of US GDP data for the first quarter. If the figures turn out to be weak, gold could rise sharply as a safe-haven asset. Thus, the gold market remains sensitive to trade news and macro data, especially against the backdrop of rebalancing at the end of April.
At the moment, as part of the current momentum and correction, I expect prices to recover from the 0.5 - 0.7 Fibonacci zone. Gold may test 3323-3325 before resuming its correction within the consolidation.
Resistance levels: 3323, 3352, 3370
Support levels: 3290, 3270
Traders are waiting for a resolution in the tariff dispute as well as economic data due tomorrow. However, while the price is consolidating, I expect a rebound from support. BUT! If the price continues to squeeze towards any boundary, with priority to support, then the chances of a breakout from the consolidation base may increase.
Best regards, R. Linda!

GOLD (XAUUSD): Market Outlook & Short Update
Regarding Gold.
I received multiple requests to provide the update after
the price bounced to a target level, as I predicted earlier on Sunday.
At the moment, we see a perfect example of a consolidation.
The price is trading within a horizontal parallel channel - range.
As always, the market will most likely continue staying within that till the release
of important high impact news.
The closest ones we can find in the economic calendar.
Tomorrow we are expecting US GDP and Personal Spending Data.
For now, probabilities will be high that a consolidation will continue.
Consider looking for trading opportunities from the boundaries of the range.
After a news release, a breakout of the range will provide a strong confirmation
and accurately indicate the future direction of the market.
❤️Please, support my work with like, thank you!❤️
I am part of Trade Nation's Influencer program and receive a monthly fee for using their TradingView charts in my analysis.

BTC/USDT 1H Chart Analysis: Breakout Incoming?Hey traders! Let’s dive into this juicy BTCUSDT 1-hour chart. Bitcoin is teasing us with some serious action!
We’ve got a textbook symmetrical triangle pattern forming, with price consolidating tightly between converging trendlines. This is a classic setup for a big move — Bitcoin is coiling up like a spring, ready to explode!
The chart shows multiple phases of consolidation , with the latest triangle pushing BTC toward a critical decision point near the weekly high of $95,773.15 and the monthly high of $95,119.06.
The price is currently hovering around $95,000, testing resistance. A breakout above the upper trendline could send BTC soaring past $96,600, potentially targeting $97,200 or higher!
On the flip side, a rejection here might see it dip toward the daily low of $92,839.27 or even the lower trendline for support.
Key Levels to Watch:
Resistance: $95,773.15 (weekly high)
Support: $92,839.27 (daily low)
Breakout Target: $97,200+
Breakdown Target: $92,800
✉ What do you think — bullish breakout or bearish?
Drop your thoughts below!

BUY PEPE ...Hello friends✌
As you can see in the picture, we have specified a purchase range for you to buy in stages, of course with capital and risk management.
🙏If you like it, support it with a ✔like✔ and ✔comment✔.
*Trade safely with us*

XRP ETF ...Hello friends✌
As you can see in the picture, we have specified a purchase range for you to buy in stages, of course with capital and risk management.
🙏If you like it, support it with a ✔like✔ and ✔comment✔.
*Trade safely with us*

Should wait for a Proper SupportImportant Support @
Channel Bottom
One should wait for a proper support level to take entry.

Channel bottom Support Taken...Important to Close above 40.84
on Monthly Basis for further
Upside.
Channel top is around 44 - 45

LINK/USDT 1H Chart Update Chainlink is riding a strong Rising Channel!
Price action shows clear patternson LINKUSDT
▸ Bullish Doritos at $12.00 & $13.00, pushing the price higher.
▸ Reverse Doritos at $13.00 & $15.00, leading to pullbacks inside Rising Channel.
▸ Key levels to watch: $14.00 (support) and $17.00 (upper resistance).
✉️ As long as LINK stays in the channel, the bulls are in control! Will we see a breakout to $17.00 soon? Let’s discuss!

EURUSD: Bullish Price Action Confirmed?! 🇪🇺🇺🇸
Here is my latest price action analysis for EURUSD.
The price completed a recent correction movement with
quite an extended consolidation within a horizontal range
and a symmetrical triangle.
The violation of 2 intraday resistances with a bullish imbalance
indicate a highly probable finalization of the accumulation.
Probabilities are high that the pair is returning to a bullish trend now.
Goal - 1.1478
❤️Please, support my work with like, thank you!❤️
I am part of Trade Nation's Influencer program and receive a monthly fee for using their TradingView charts in my analysis.

LINKUSDT → Consolidation. One step away from a rally?BINANCE:LINKUSDT entered a consolidation phase after breaking out of a downward channel. This is a fairly positive sign that buyers are building up momentum ahead of a possible breakout of resistance.
Exit from the downward price channel, distribution, and transition of the market to a consolidation phase: 15.275 - 14.400. Bitcoin is forming positive dynamics, which supports altcoins. The local alt season may continue if Bitcoin continues to grow after breaking through 95K. If LINK breaks through the resistance level of 15.275, this move could trigger further growth
Resistance levels: 15.275, 15.942
Support levels: 14.400, 14.266
At the moment, the mood of altcoins depends on Bitcoin, as it is receiving support amid positive fundamental data in the US and the global economy. However, for LINK, the focus is on the current consolidation. If the resistance level is not broken on the first attempt, it may happen during the next retest. Before that, the price may test the consolidation support with a false breakdown, which could create an imbalance in favor of buyers, only increasing the chances of growth and a breakout of resistance, provided, of course, that the overall bullish trend continues.
Best regards, R. Linda!

GBPNZD - Marco Trend Still Up!Hello TradingView Family / Fellow Traders. This is Richard, also known as theSignalyst.
📈GBPNZD has been overall bullish from a macro perspective trading within the rising channels in blue and orange.
Moreover, the green zone is a strong support, structure and demand.
🏹 Thus, the highlighted blue circle is a strong area to look for buy setups as it is the intersection of support and lower orange/blue trendlines acting non-horizontal support.
📚 As per my trading style:
As #GBPNZD approaches the blue circle zone, I will be looking for bullish reversal setups (like a double bottom pattern, trendline break , and so on...)
📚 Always follow your trading plan regarding entry, risk management, and trade management.
Good luck!
All Strategies Are Good; If Managed Properly!
~Rich
Disclosure: I am part of Trade Nation's Influencer program and receive a monthly fee for using their TradingView charts in my analysis.

Will Gold Reject This Important Resistance?Hey Traders, in today's trading session we are monitoring Gold for a selling opportunity around 3,355 zone, Gold is trading in a downtrend and currently is in a correction phase in which it is approaching the trend at 3,355 support and resistance area.
Trade safe, Joe.

GOLD → The chances of a further decline are growing...FX:XAUUSD continues to test support at 3270 for a breakout. Any de-escalation of the conflict between the US and China could trigger a price drop. But it's not that simple...
Gold under pressure amid tariff war and ahead of US data
On Monday, gold is testing last week's low of $3260, remaining under pressure from a strengthening dollar and easing trade risks between the US and China.
Investors are preparing for the release of key US GDP and labor market data, which could influence expectations for Fed rates. Against this backdrop, the correction in gold could be replaced by growth if macro statistics turn out to be weak and geopolitical risks remain.
Another retest of support could trigger a breakout. It is necessary to monitor the situation between China and the US. Any de-escalation will trigger a decline.
Resistance levels: 3299, 3326
Support levels: 3268.9, 3245, 3232
Since the opening of the session, the potential for a further decline has been exhausted. Gold may strengthen to the indicated resistance zones. A false breakout of 3300/3326 could trigger a decline, which could bring the price closer to the support breakout of 3270.
With respect, R. Linda!

