USDJPY Wave Analysis – 11 April 2025
- USDJPY broke the support zone
- Likely to fall to support level 141.65
USDJPY currency pair recently broke the support zone between the support level 144.60 (which stopped wave 1 at the start of April, as can be seen below) and the support trendline of the daily down channel from January.
The breakout of this support zone accelerated the active short-term impulse wave 3 – which belongs to wave (3) from the end of March.
Given the strongly bearish US dollar sentiment, USDJPY currency pair can be expected to fall to the next support level 141.65, former strong support from August and September.
Parallel Channel
Long Bullish Idea — Reddit $RDDT (4H Chart)Alright, here’s the play.
Reddit’s been bleeding inside this falling channel for months. But here’s where it gets interesting.
→ IF price holds this buy zone around $100 - $95...
→ THEN I’m expecting a breakout towards $135 as first target. That’s about +34%.
Strong bounce here, plus a clean break of this descending channel = confirmation for me.
Volume is kicking in — I wanna see continuation.
→ IF price breaks $135 with momentum...
→ THEN next stop is $165 — the 2nd target. That’s another +20%.
This isn’t a scalp. It’s a swing idea. 2-5 months range.
Earnings 1st May could be a catalyst — but I want to be in early, not chasing after.
→ IF price loses $70 support with volume...
→ THEN idea invalidated. No ego, I’m out.
Simple plan. Clear levels. No hope, just execution.
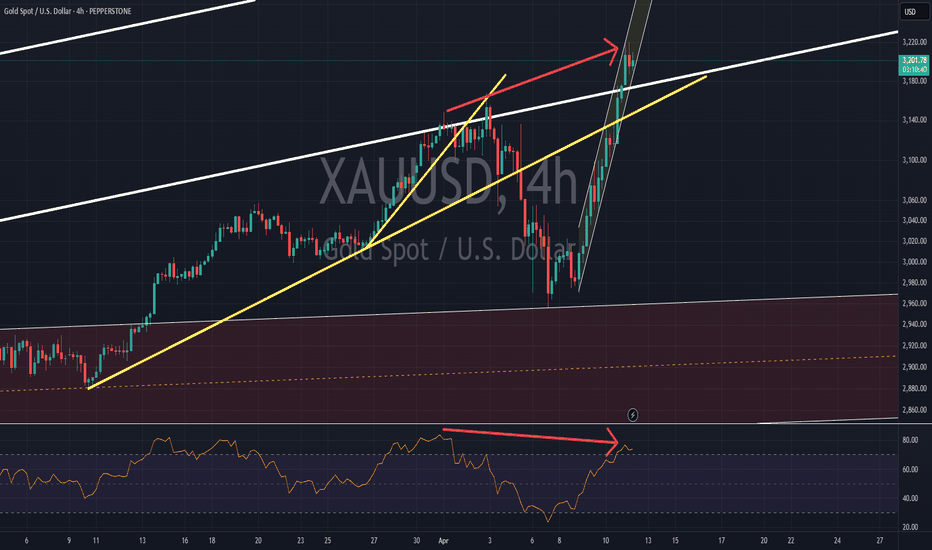
Gold Wave Analysis – 10 April 2025- Gold broke key resistance level 3150.00
- Likely to rise to resistance level 3200.00
Gold today broke above the key resistance level 3150.00 (which stopped the previous impulse wave I at the start of April, as can be seen below).
The breakout of the resistance level 3150.00 accelerated the active intermediate impulse wave (3) from last November.
Given the overriding daily uptrend, Gold can be expected to rise to the next resistance level 3200.00, which is the forecast price for the completion of the active impulse wave (3).
USDCHF Wave Analysis – 10 April 2025
- USDCHF broke support zone
- Likely to fall to support level 0.8200
USDCHF currency pair recently broke the support zone between the key support level 0.8400 (which reversed the price multiple times in August and September) and the support trendline of the daily down channel from February.
The breakout of this support zone accelerated the active intermediate impulse wave (3).
USDCHF currency pair can be expected to fall to the next support level 0.8200, which is the target price for the completion of the active impulse wave (3).
Total 3 targeting 1.5TWelcome back dearest reader,
This is going to be a short one, all information is in the chart above.
Total 3 has been in a Massive Cup and handle formation.
Measured from the base of the cup till the top of the handle gives us a ''total 3'' price target of 1.5T$ which is 100x from here. If you were to do a different analysis and like flags more then we come to the same price target of 1.5T$ (Blue bars).
Price action is now retesting resistance from march 2024 as support. When this is done i expect blast-off mode.
~Rustle
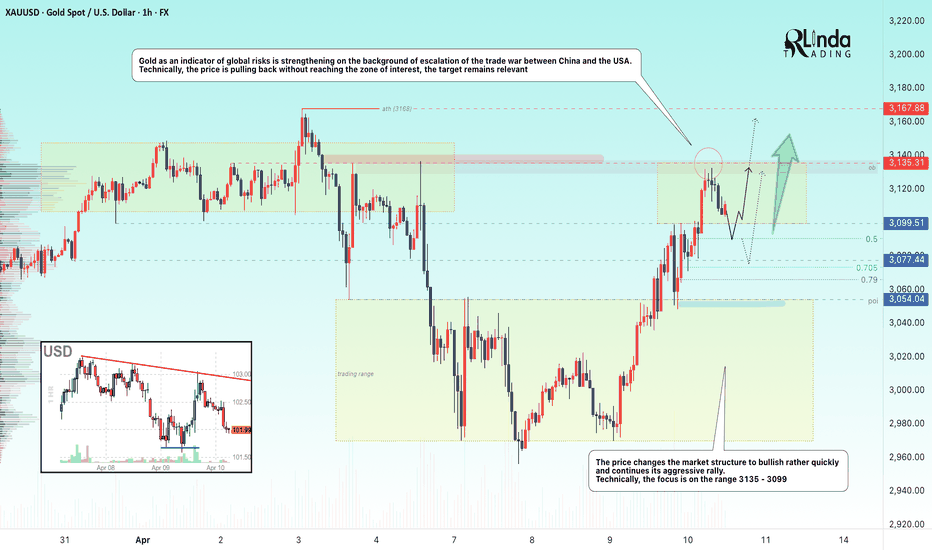
GOLD → Global economic risk indicator consolidates ahead of CPIFX:XAUUSD , rather quickly changes the market structure to bullish and continues its aggressive rally. The economic risk indicator is working perfectly. Technically, the focus is on the range 3135 - 3099
Gold is consolidating around $3,100 in anticipation of US inflation data. The escalating trade war between the US and China keeps demand for defensive assets alive despite the pause in price gains. Trump imposed 125% tariffs on Chinese goods and China retaliated with duties of 84% on U.S. imports. Increased tariff tensions are raising recession expectations and encouraging bets on a Fed interest rate cut, which supports gold. However, a rise in March CPI inflation (expected 2.6% y/y) could trigger a downward correction, although the impact could be short-lived - tariff news remains the main driver
Technically, the price failed to reach the 3135 liquidity zone and reversed, which attracted the crowd willing to sell (deceptive maneuver). But, after correction the price may return to the target quite quickly
Resistance levels: 3135, 3167
Support levels: 3100, 3090, 3077
Emphasis on the range boundaries, possible retest of 3100-3090- 3075 before continuation of growth. On the news or before the opening of the American session there may be a long squeeze before the continuation of growth.
Regards R. Linda!
DOGE → Will the market hold strength or lose it all?BINANCE:DOGEUSDT is testing the liquidity and resistance zone amid a downtrend as part of a news-induced rally. Will the market hold this trend or return to a sell-off?
The downtrend continues. As part of the correction triggered by the news backdrop, bitcoin strengthened and pulled the altcoins with it. But the market may lose all its growth quite quickly, as bearish pressure on the market is still very strong (There are no fundamental positive changes for the market). The fall of BTC may be followed by DOGE as well.
Technically, the price is forming a false break of the resistance zone 0.1622 - 0.15700, consolidation of the price below this zone will provoke the continuation of the fall to the nearest zone of interest 0.13646.
Resistance levels: 0.157, -0.1622
Support levels: 0.13646, 0.1277, 0.1154
A retest of the trend resistance is possible, but price consolidation below the key zone will be a good signal indicating the seller's strength, the decline may continue. On the weekly timeframe we have a trigger at 0.14217, break of which will open the way to 0.1277 - 0.1025.
Regards R. Linda!
Euro may continue to move up inside upward channelHello traders, I want share with you my opinion about Euro. We can see how the pair spent a long time inside a wide range, repeatedly testing the buyer zone between 1.0365 - 1.0400 points. After multiple rebounds and false breakouts, Euro finally broke through the resistance and started forming a strong upward channel. The bullish structure was further confirmed when the price respected the support line of the channel and created a new higher low near 1.0885, which now acts as the current support level. This level also coincides with the bottom of the seller zone, which was recently flipped into support. Price reacted with a sharp impulse up, breaking the consolidation range and confirming continued bullish pressure. Now Euro is approaching the middle of the channel and gaining strength again. I expect the pair to make a slight pull-back to the support area, followed by a continuation of the upward trend toward TP1 - 1.1250 points, which aligns with the upper boundary of the channel. As long as EUR remains above 1.0885 points and respects the bullish structure, I’m looking for another leg higher. The chart structure supports the bullish case, and the upward momentum is clearly in play. Please share this idea with your friends and click Boost 🚀
Bitcoin will continue to fall inside downward channelHello traders, I want share with you my opinion about Bitcoin. If we look at the chart, we can see how the price entered to downward channel, where it once declined to the channel's support line, which coincided with the resistance level and seller zone. Next, the price some time traded inside this area and even little declined below, but then it turned around and in a short time rose to the resistance line of the channel and made a fake breakout, after which it made a correction. Bitcoin long time traded inside seller zone and then broke 82000 level and declined to support level, which coincided with buyer zone. Then it made upward movement, after which it turned around and declined back to 75000 level. Recently, BTC bounced and started to grow, but in my mind, Bitcoin can rise a little more and then continue to decline inside a downward channel. Bitcoin will break the support level and fall to the 71800 support line of the channel, where my TP is located. Please share this idea with your friends and click Boost 🚀
EURCAD: Bullish Move From Support Confirmed 🇪🇺🇨🇦
EURCAD may continue growing after a strong bullish
reaction to a key daily support.
The market was accumulating for some time on that
within the intraday horizontal range.
Its resistance was broken with both 4H/1H candles.
Next goal - 1.5592
❤️Please, support my work with like, thank you!❤️
I am part of Trade Nation's Influencer program and receive a monthly fee for using their TradingView charts in my analysis.
GOLD → Bounce back to accumulate energy before growthFX:XAUUSD confirms interim bottom at 2970 after a false breakdown and as part of the escalating trade war, price is strengthening from support to the important medium-term level of 3054.
Further dynamics will depend on the market reaction to the minutes of the March Fed meeting and the introduction of reciprocal tariffs between the US and China. The introduction of 104% duties on Chinese goods increases trade tensions, reduces investor confidence and supports the price of gold against the background of a weakening dollar. Even with the Fed's cautious rhetoric, gold may keep rising due to the escalating trade war.
The medium-term situation depends on the Fed (namely hints or actions on rate cuts), the trade war and negotiations on the situation in Eastern Europe
Resistance levels: 3054, 3077, 3099
Support levels: 3033, 3013 (0.5f), 2995
Since the opening of the session (the price has passed the daily norm) gold has exhausted the technical potential and the 3054 area may push the price down (false breakout). As part of a technical pullback, gold may test 3033 - 3013 before looking at upside attempts again.
Additional scenario: pullback to the fvg zone (0.7 - 0.79 fibo) before further growth.
Regards R. Linda!
SPX....An interestng observation!10/4/25
spx....an interesting observation..
index has been travelling between the blue median which is a very strong support and the red median which is a very strong resistance.............this travel started s0me time in 2009....and is still ongoing!
only during 2008/2009 lehman collapse and 2020 covid did the index go below the blue median....
will it slip the blue median again or move north again to retest the red median? only time will tell..
but we have the contours to monitor!
Possible Bearish Market on USDCHFUSDCHF has been moving between support and resistance levels thereby creating a sideways movement on daily and weekly timeframes, also creating some flag patterns, currently, there is a potential sells on weekly and daily timeframes,
we might see a little movement up to the resistance zone at 92081, creating a triple top pattern before starting the downward movement again.
let's watch out for the market this week.
like and share your opinion
Gold Hits Key Support – Reversal Ahead or More Fall?Gold ( OANDA:XAUUSD ) has entered a Correction phase after losing its ascending channel . Now, if you are in a Short position , this post will help you know where to take profit on your position or if you are looking for a Long position for gold , what area is suitable .
Gold is approaching an important Support zone($2,956-$2,917) that I don't think can be broken within a first attack . What do you think?
In terms of Elliott waves , Gold appears to be completing a bearish wave 5 , which appears to be able to complete at the Support zone($2,956-$2,917) .
I expect Gold to start rising again from the Support zone($2,956-$2,917) and to at least rise to $3,000 again and get close to the Resistance zone($3,058-$3,021) . It is likely to fall again after this move .
In your opinion, has Gold started a major correction, and to what price can this correction continue?
Note: If Gold can touch $2,890, we can expect further declines.
Note: Because the downward momentum is currently high, it is likely that wave 5 will also complete near $2,913, and we will see a fake break of the Support zone($2,956-$2,917).
Gold Analyze ( XAUUSD ), 4-hour time frame.
Be sure to follow the updated ideas.
Do not forget to put a Stop loss for your positions (For every position you want to open).
Please follow your strategy; this is just my idea, and I will gladly see your ideas in this post.
Please do not forget the ✅' like '✅ button 🙏😊 & Share it with your friends; thanks, and Trade safe.
Can $DOGE Still Leapfrog $BTC...?The original thesis has not yet been invalidated, only pushed farther into the future.
The historical pattern is still there, and the reversal is part of it.
Does that mean DOGE will definitely flip BTC to the extreme upside?
Not necessarily.
But the two hypothetical trend lines will not validate/invalidate until DOGE begins to flip BTC more aggressively.
Then we'll know for sure by how much it flips BTC.
DYOR, STFU, Praise the Lord, and Pass the Ammunition.
GOLD → Rising economic risks could push the price upwardFX:XAUUSD closed inside the range 2970 - 3060 and has all chances to strengthen as the situation between the USA and China is only getting hotter, which creates additional risks.
Gold continues to rally from its recent low of $2,957, back above the $3,000 level amid a weaker dollar and a pause in rising US bond yields. The market is reacting to escalating trade tensions between the US and China, including the threat of new 50% tariffs and possible countermeasures by Beijing. Strengthening expectations of Fed rate cuts and recovering risk appetite also support gold's growth, but the instability of global trade policy keeps investors uncertain.
At the moment the price is testing resistance at 3013 and after a small correction the assault may continue, and a break and consolidation above 3013 will open the way to 3033 - 3057.
Resistance levels: 3013, 3033, 3057
Support levels: 2996, 2981
The trade war and the complex, politician-dependent fundamental backdrop allows us to strategize relative to economic risk. Technically, we are pushing off the strong levels I have outlined for you. The overall situation hints that China will not just give up and Trump will not lose face. An escalation of the conflict could send gold higher.
The price may strengthen from 0.5 fibo, or from 3013
Regards R. Linda!
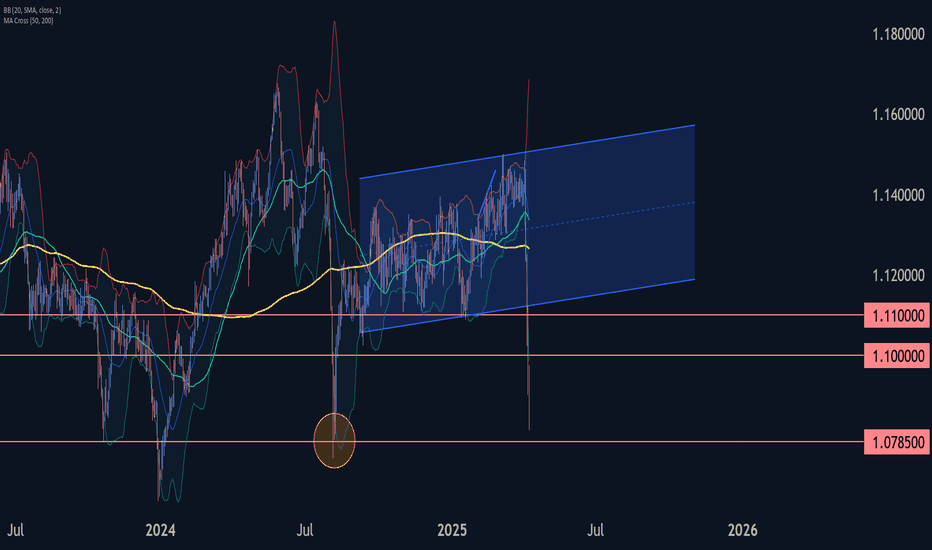
GBPCHF Wave Analysis – 8 April 2025- GBPCHF broke the support zone
- Likely to fall to support level 1.0785
GBPCHF currency pair recently fell sharply through the support zone between the support levels 1.1000 and 1.1100. The breakout of this support zone was preceded by the breakout of the daily up channel from September.
The breakout of these support levels accelerated the active intermediate impulse wave (3) from the start of August.
Given the strongly bullish Swiss franc sentiment seen recently, GBPCHF currency pair can be expected to fall to the next support level 1.0785, the target price for the completion of the active intermediate impulse wave (3).
Gold Has Pulled BackGold has been in an uptrend this year, and some dip buyers may see an opportunity in its latest pullback.
The first pattern on today’s chart is the series of higher highs and higher lows since January. XAUUSD has dipped to the bottom of that rising channel. Will it become another higher low?
Second, the pullback stabilized near the February high around 2956. That could suggest old resistance has become new support.
Third, stochastics dipped to an oversold condition.
Finally, the 50-day simple moving average is rising from below.
TradeStation has, for decades, advanced the trading industry, providing access to stocks, options and futures. If you're born to trade, we could be for you. See our Overview for more.
Past performance, whether actual or indicated by historical tests of strategies, is no guarantee of future performance or success. There is a possibility that you may sustain a loss equal to or greater than your entire investment regardless of which asset class you trade (equities, options or futures); therefore, you should not invest or risk money that you cannot afford to lose. Online trading is not suitable for all investors. View the document titled Characteristics and Risks of Standardized Options at www.TradeStation.com . Before trading any asset class, customers must read the relevant risk disclosure statements on www.TradeStation.com . System access and trade placement and execution may be delayed or fail due to market volatility and volume, quote delays, system and software errors, Internet traffic, outages and other factors.
Securities and futures trading is offered to self-directed customers by TradeStation Securities, Inc., a broker-dealer registered with the Securities and Exchange Commission and a futures commission merchant licensed with the Commodity Futures Trading Commission). TradeStation Securities is a member of the Financial Industry Regulatory Authority, the National Futures Association, and a number of exchanges.
TradeStation Securities, Inc. and TradeStation Technologies, Inc. are each wholly owned subsidiaries of TradeStation Group, Inc., both operating, and providing products and services, under the TradeStation brand and trademark. When applying for, or purchasing, accounts, subscriptions, products and services, it is important that you know which company you will be dealing with. Visit www.TradeStation.com for further important information explaining what this means.
NOT/USDT:WHAT DO YOU THINK!Hello friends
The TON ecosystem has a lot of potential and gives good profits.
Due to the price drop, we have reached a good support area, which is also the bottom of the channel. Now we can buy in stages and with capital management and move to the specified goals.
Always buy in fear and sell in greed.
*Trade safely with us*


