GOLD → Consolidation or continuation of the fall. 3013 triggerFX:XAUUSD is going through the strongest liquidation phase. The fall is triggered by profit-taking amid last week's strong news. Additional pressure is created by the strong NFP report released on Friday. The economic risk situation is bifurcating....
Gold prices rebounded after falling in the Asian session, consolidating the drop triggered by the intensifying trade war between the US and China. Donald Trump's comments about rejecting deals with China have heightened recession fears, raising the likelihood of a Fed rate cut.
Against this backdrop, there was increased interest in gold as a protective asset, despite the rise in the dollar and bond yields. However, further strengthening of gold is questionable due to profit taking and lack of new economic data from the US.
Technically, the price is consolidating under pressure against the support at 3017-3013. A descending triangle is forming on the local timeframe.
Resistance levels: 3033, 3057
Support levels: 3017, 3013, 2981
Based on the current situation and strong pressure on the market, we can expect two situations to develop:
1) breakdown of support 3017 - 3013, if the structure of the descending triangle on the local timeframe will be preserved. The target will be the support of 3000, 2981.
2) Or, the price will close inside the range with the target of consolidation between 3057 - 3033 - 3013 (consolidation of forces after a strong fall and liquidation)
Regards RLinda!
Parallel Channel

Is Bitcoin in one big parallel channel?Are we at the bottom of a massive parallel channel?
This seems like a good place to buy.
Also be prepared to buy at the weekly 200MA, if that happens.

UK100, Market Top UK 100
Currently Trading at top of 20 year weekly channel
Triple top formation
Currently in distribution phase
Weekly bearish matured divergence
This is expected top of market
Bearish Activity expected on break of distribution phase

XRPUSDT → The bulls won't hold support. Falling to 1.9BINANCE:XRPUSDT is under pressure despite quite positive news. The coin, being in a downtrend, continues to test the key support. The chance of a breakdown is growing
XRP continues to test a strong support zone on the weekly timeframe, relative to this zone, in the medium term, two scenarios can develop, which depend on the general mood in the market. If the current backdrop persists, the chance of a downside breakdown and further decline is quite high.
At the moment, the focus is on the key support at 2.0637, relative to which the retests continue, and the reaction is getting weaker and weaker, which in general only increases the chances of a further fall to 1.9 - 1.63.
Resistance levels: 2.265, 2.365, 2.509
Support levels: 2.0637, 1.9
The cryptocurrency market is going through bad times (Tariff War, high inflation, stock market decline, disappointment of the crypto community due to expectations) and until the situation starts to change, the technical picture will remain negative. XRP may continue its fall after a small correction.
Regards R. Linda!

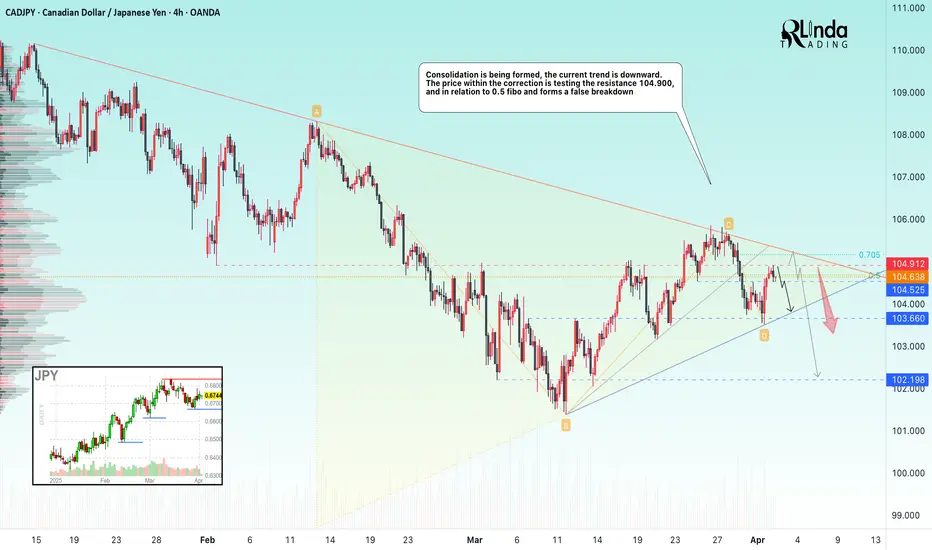
CADJPY → Consolidation before the news. DowntrendFX:CADJPY continues to forge a downtrend, but within the current movement a symmetrical triangle of accumulative nature is forming
The currency pair may continue its decline due to the strengthening of the Japanese Yen, while the Canadian is consolidating in a narrow range.
The situation may be accelerated by today's news, namely Trump's speech, where he may announce new tariff measures.
Technically, the price is correcting after the false break of 103.56, being below the previously broken upside support. Price is testing key resistance at 104.90, and against 0.5 Fibo is forming a false breakout. A consolidation below 104.69, a break of 104.525 could trigger further decline.
Resistance levels: 104.900, 105.36, 105.74
Support levels: 104.525, 103.56
There are important news ahead, high volatility is possible, especially at the moment of Trump's speech, which may set a medium-term tone in the market.
The currency pair is in consolidation on the background of the downtrend and the priority is to expect a continuation of the fall
Regards R. Linda!
EOSUSDT → False Breakeout of resistance (counter-trend )BINANCE:EOSUSDT.P within the consolidation distribution 0.54 - 0.6 reaches the key resistance and forms a false breakdown without the possibility of continued growth.
The cryptocurrency market is showing weakness, especially after yesterday's Trump speech and the approval of new Tariffs, which creates risks and pressure on the cryptocurrency market. Bitcoin is back in the red zone after rallying, while altcoins will continue to look for a new bottom. EOS stands out in this list, which strengthened quite strongly and the purpose of this maneuver was countertrend accumulation and liquidity capture relative to the range of 0.7 - 0.8. The distribution is tempered by a false breakout of the level 0.82 - 0.86
Resistance levels: 0.82, 0.86
Support levels: 0.793, 0.666
If the bears hold the resistance 0.82 - 0.86 and the consolidation under the level will end with the breakout of the trigger 0.793 and price consolidation in the selling zone, it may provoke a reversal and fall to the zones of interest: fvg, 0.64, 0.541.
Regards R. Linda!

AUDUSD bullish continuation still to expect
FX:AUDUSD we are have break of CHANNEL, break of long trend line, price is make revers, now its on strong sup zone and from here new bullish push expecting.
USD showing self weak still, continuation expecting, +we are not see some special moves here.
SUP zone: 0.62500
RES zone: 0.64400, 0.64900, 0.65400

GBPJPY still bullish view
OANDA:GBPJPY in first analysis RES zone reached, what's next here is still bullish for expect. First analysis attached, currently price is in ASCENDING CHANNEL. Technicals are still bullish to see.
SUP zone: 192.500
RES zone: 195.900, 196.900

GOLD Trending Higher - Can buyers push toward 3,238?OANDA:XAUUSD is trading within a well-defined ascending channel, with price action consistently respecting both the upper and lower boundaries. The recent bullish momentum indicates that buyers are in control, suggesting a potential continuation.
The price has recently broken above a key resistance zone and may come back for a retest. If this level holds as support, it would reinforce the bullish structure and increase the likelihood of a move toward the 3,238 target, which aligns with the channel’s upper boundary.
As long as the price remains above this support zone, the bullish outlook stays intact. However, a failure to hold above this level could invalidate the bullish scenario and increase the likelihood of a pullback toward the channel’s lower boundary.
Remember, always confirm your setups and trade with solid risk management.
Best of luck!

Nifty Trend directionNifty 22161 - As per channel chart pattern, Nifty has not yet bottomed out and We expect another 1000 more points fall down to come. Nifty has closed in positive so possibility to move up further to trap PUT writers and once Nifty below 22335 will confirm the another fall.

GBPUSD Wave Analysis – 7 April 2025
- GBPUSD reversed from resistance area
- Likely to fall to support level 1.2700
GBPUSD currency pair recently reversed down from the resistance area between the resistance level 1.3050 (which reversed the price in October and November), upper daily Bollinger Band and the resistance trendline of the daily up channel from January.
The pair just broke the aforementioned daily up channel – which should accelerate the active impulse wave 1.
Given the moderately bullish US dollar sentiment seen today, GBPUSD currency pair can be expected to fall to the next support level 1.2700.

Bitcoin will grow inside upward channel to resistance levelHello traders, I want share with you my opinion about Bitcoin. Previously, the price moved inside a triangle pattern, where it faced pressure from the resistance line while holding above the lower boundary. After the breakout from this formation, BTC began forming an upward channel, signaling a shift toward a bullish structure. Inside the channel, the price reacted multiple times to the support line, especially within the buyer zone between 79600–81000 points. Every touch of this zone triggered a rebound, indicating that buyers consistently protect it. Most recently, BTC bounced again from the 81000 support level, which aligns with the lower channel boundary. This rebound shows that bullish momentum is still present, and the structure remains intact. Now, the price is stabilizing and preparing for another upward move. I expect BTC to continue rising toward the 88500 resistance level, which is both the TP1 and the upper boundary of the current channel. This level also aligns with the lower edge of the seller zone, making it a natural target for the next wave. With the price holding above key support, the confirmed channel structure, and repeated bullish reactions from the lower zone, I remain bullish and anticipate a continued move upward toward 88500 points. Please share this idea with your friends and click Boost 🚀

EURCHF: One More Gap 🇪🇺🇨🇭
One more gap is going to be filled today.
EURCHF violated a resistance line of a narrow consolidation range
on an hourly time frame.
It looks like the price is heading towards a gap down opening level now.
Goal - 0.9429
❤️Please, support my work with like, thank you!❤️
I am part of Trade Nation's Influencer program and receive a monthly fee for using their TradingView charts in my analysis.

Gold Wave Analysis – 7 April 2025
- Gold reversed from round support level 3000.00
- Likely to rise to resistance level 3100.00
Gold recently reversed up from the support area between the round support level 3000.00 (which stopped the earlier minor correction iv in the middle of March) and the lower daily Bollinger Band.
This support area was further strengthened by the support trendline of the daily up channel from January and by the 50% Fibonacci correction of the sharp upward impulse from February.
Given the strong uptrend on the daily and weekly charts, Gold can be expected to rise to the next resistance level 3100.00.

SPXUSDT manipulated rise before the fallThe market is pulling back after a strong drop in the Asian session. At the moment, while bitcoin is showing -2%, BINANCE:SPXUSDT.P is accelerating by 15% in the hunt for liquidity.
Possible entry into liquidity zone and false resistance breakout
False resistance breakout
1) 0.5473
2) 0.6689
Market is bearish, no hint of growth
A pullback is forming with the aim of accumulation or liquidity before continuing the fall
The fall may continue after the bitcoin correction is over

GBPUSD → False break of weekly support + DXY fallFX:GBPUSD is going through a shakeout phase relative to the trading range. Last week was very challenging in terms of unpredictable moves and volatility.
A strong NFP report on Friday allowed the dollar to strengthen, but the reaction from the opening of the new trading week has already exhausted itself as traders are still watching the tariff war, which simply crashed the stock, futures markets.
Technically, the currency pair on this background can win out, as the pound sterling within the ascending trend, the fall of the dollar can continue the growth phase.
On the chart, the price forms a false breakdown of the support conglomerate, which in general may push the price up due to the imbalance of liquidity and interests of money moving away from the dollar
Resistance levels: 1.2932, 1.3010
Support levels: 1.2828, 1.2811
If the bulls will keep the price above 1.2868 and will be able to consolidate above 1.2932, in the short term the market can show growth up to the next target - resistance 1.3010.
Regards R. Linda!

GBP/USD Technical Outlook – April 7, 2025GBP/USD Technical Outlook – April 7, 2025 📊
🔹 Current Price: 1.29116
🔹 Timeframe: 15-Minute Chart
📌 Bullish Scenario (Primary & Alternate Paths):
🟢 Price is approaching a minor resistance at 1.29144, and a break above could lead to a push toward:
📍 1.29620 – Short-term resistance
📍 1.30295 – Key target zone
📌 Demand Zones (Support):
🟩 1.29144 - 1.29307 – Retest zone (potential bullish continuation)
🟩 1.27850 - 1.28350 – Major support for rebound if price rejects near-term structure
🛠️ Game Plan:
✅ Look for confirmations (bullish engulfing or breakout retest) around 1.29144 for long setups.
❗ If price breaks below both demand zones, reassess for bearish pressure.
#GBPUSD #PriceAction #ForexAnalysis #FXFOREVER #SmartMoneyConcepts #DemandZone #SupplyAndDemand #15MAnalysis

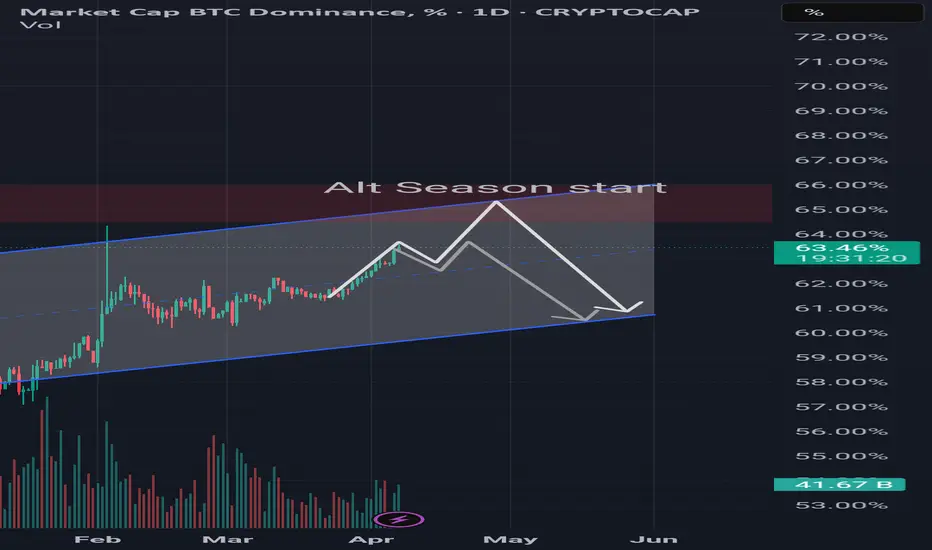
Btc.dHello, I have left you the analysis of btc.d, which promises the start of the alt season. I hope you will use it.
BITCOIN → The price is consolidating, but there is a BUT!BINANCE:BTCUSDT is forming a consolidation after a false breakout of trend resistance. Against the backdrop of the global market crash (stock market, futures, forex) bitcoin looks quite strong, but I wouldn't get excited ahead of time
Bitcoin is trading inside a downtrend and also inside a range (global 81200 - 88800 and local 81200 - 85600). As long as the price is inside the local range and below trend resistance it is worth considering selling. There have been periods in history when the price seemed strong in the moment, but then, bitcoin caught up with the fall of indices...
The fundamental background for bitcoin is unstable:
First of all, the price has hardly reacted in any way to the introduction of tariffs, backlash and economic data. The Fed is not giving a clear signal, the market is in uncertainty. Any info noise ( China, Fed rhetoric, company reports ) can cause shake-ups. But at the same time, the same old problems remain: the crypto community is not getting any support. Bitcoin's dominance is growing against the backdrop of its decline. Altcoins continue to storm the bottom.
Technically , the situation is weak, the price cannot update local highs and consolidate above any strong support. It is possible to retest the trend resistance, or the zone of interest 85590 before the reversal and fall. Or, emphasis on the trigger 81187. A breakdown will provoke an impulse.
Resistance levels: trend, 85585, 88840.
Support levels: 81187, 78170, 73500
Buying in the medium term can be considered either after reaching the main target - 73-66K, or after the exit from the descending channel and price fixation above 88840. Now the emphasis is on a possible fall either from the resistance 85580, or when the support 81180 is broken
Regards R. Linda!

US100 Downtrend Analysis & Key LevelsAfter analysing the US100 chart, the index has been trading within a downtrend channel since Friday, February 21, 2025. After dropping to 19,131, it attempted a recovery but faced strong resistance at 19,957, leading to a decline. As the saying goes, “ Follow the trend—the trend is your friend. ” Given the ongoing downtrend, US100 may continue to decline toward the next strong support level at 18,489.
Ensure you adhere to proper risk management for long-term success.
Happy Trading

SUI/USDT Is a Trend Reversal on the Horizon?1D CHART of SUI on USDT market pair. indicates a potential trend reversal following a prolonged downtrend within a descending parallel channel. The price has consistently formed lower highs and lower lows, indicating strong bearish momentum. However, a recent breakout from the channel suggests a possible shift towards bullish price action.
A critical support zone around $2.00 has shown significance, as buyers have stepped in to defend this level, preventing further declines.
This breakout signals a potential trend change, with the price now targeting key resistance levels at $2.9357, $3.5131, and $4.2060. In an extended bullish scenario, the price could reach as high as $4.7538.

Nikkei 225 Wave Analysis – 4 April 2025
- Nikkei 225 broke support zone
- Likely to fall to support level 30600.00
The Nikkei 225 index recently broke the support zone located at the intersection of the support level 35000.00 (former monthly low from September) and the support trendline of the daily down channel from January.
The breakout of this support zone accelerated the active downward impulse wave 3 of the higher-order impulse wave (C) from January.
The Nikkei 225 index can be expected to fall to the next support level 30600.00 (former major support from August of 2024).

Gold Wave Analysis – 4 April 2025
- Gold broke daily up channel
- Likely to fall to support level 3000.00
Gold recently reversed down from the resistance level 3150.00 (which formed the daily Bearish Engulfing) and broke the sharp daily up channel from February.
The breakout of this up channel added to the bearish pressure on Gold – accelerating the active downward correction to the higher-order impulse wave (3) from November.
Gold can be expected to fall to the next round support level 3000.00 (which stopped the previous short-term correction iv).
