MATIC / USD [Polygon] EWP TC FIB ANALYSIS WEEKLY TFElliott Wave Analysis for MATIC/USD (Polygon) 1W Time Frame Chart
The chart presents a detailed Elliott Wave analysis with corrective patterns, Fibonacci levels, and a long-term price projection.
MATIC is currently in a final corrective phase (Wave C of an ABC correction) within a descending channel.
A potential bottom formation near the 0.618–0.65 Fibonacci retracement level (~$0.19 - $0.22) suggests a possible trend reversal. (Strong support zone)
The RSI (Relative Strength Index) is in the oversold zone, indicating that selling pressure may be exhausting.
The previous bullish impulse (Wave (5)) ended around $2.75
This was followed by an WXY corrective multi zigzag, which appears to be reaching its final stage. The chart suggests that Wave (C) of the correction is nearing completion.
Bearish Scenario:
If the $0.19 - $0.22 support fails, further downside towards $0.10 - $0.05 is possible.
However, this scenario would likely require a broader crypto market downturn.
Conclusion: Potential Long-Term Trend Reversal
The current zone suggests a possible bottom formation, which could lead to a new bullish cycle.
A breakout above $0.42 - $0.50 with strong volume would confirm the trend reversal.
Traders might consider accumulation in this range with a stop-loss below $0.17.
Overall Outlook: Bullish mid-term outlook once the bottom is confirmed.
Parallel Channel

AUDCAD | Reoccurring FractalsWe're looking at 3 complete fractals and the fourth one being the current one. Same phase as the last, a bit of sideways trading/consolidation then aggressive buying breaking out to the upside.
Price action has been trending upwards with HHs and HLs and we're currently at a Lower High bouncing off the lower trendline below.
Would be ideal to look for long positions only for this setup as bulls are looking stronger from this view.
~300pips going into the 3rd wave.

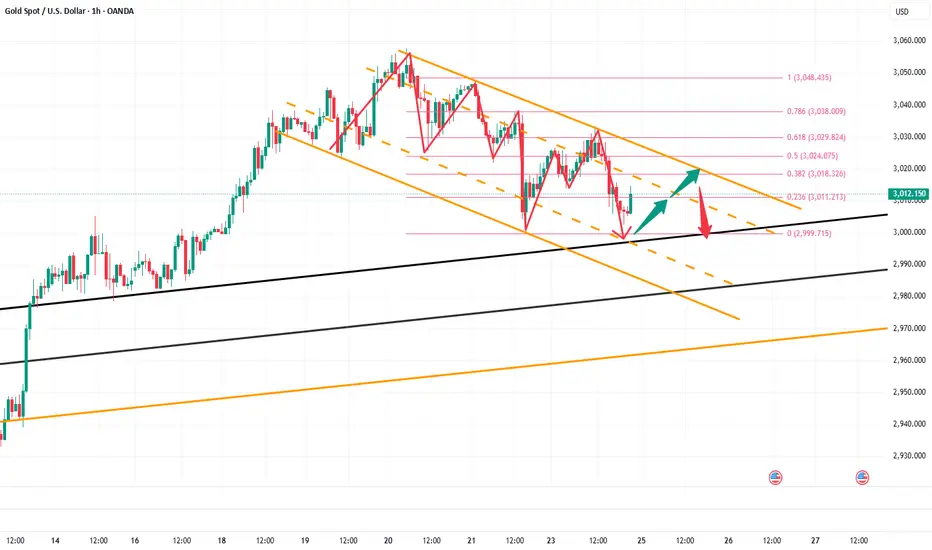
Bulls or Bears – Who's in Charge?Tomorrow could be an exciting day for gold! 🎢 The current trend channel has broken out and is now moving sideways. The big question: Will the market push higher, or are we in for a drop?
If the bulls take control, we could see a test of the $3,036 zone – a key target for long traders! 🚀 But be careful: If the price falls below $3,015, it's time to watch closely! If the market stays bearish, further downside could be on the horizon.
So, keep an eye on the charts, set your strategy, and be ready when the move happens! 🔥📊
This is my first Idea in TV, what do you think – bulls or bears? 🐂🐻
----------------------------------------------
This is just my personal market idea and not financial advice! 📢 Trading gold and other financial instruments carries risks – only invest what you can afford to lose. Always do your own analysis, use solid risk management, and trade responsibly.
Good luck and safe trading! 🚀📊

Gold Likely to Extend Decline Toward the 2995-2985 ZoneGold encountered resistance and pulled back after reaching around 3026 during the rebound, failing to break the descending channel effectively. In the short term, bearish momentum remains dominant. On the daily chart, gold has closed with three consecutive bearish candlesticks, it weakens rebound expectations and suggests further downside remains possible.
The key short-term level to watch is around 3010. If gold breaks below this level during the pullback, the downtrend structure will become more pronounced. This would likely lead to another test of the 3000 level, with further downside potential extending toward the 2995-2985 range.
I remain committed to shorting gold on rebounds. My primary plan is to enter short positions within the 3020-3030 range. I will make more detailed trading plans and trading signals every day according to the real-time market situation, which is also the testimony of every successful transaction and profit of mine; the article has a certain lag, if you want to copy the trading signals to make a profit, or master independent trading skills and thinking, you can choose to join the channel at the bottom of the article

GOLD → Tense fundamental environment and retest of 3025FX:XAUUSD is forming a correction within the descending channel. The situation is becoming complex and confusing. The focus is on the channel resistance and on the support at 3004.9. Further price movement depends on the fundamental data...
The problem is the uncertainty around the US tariff policy and the outcome of talks between Russia and the US on ceasefire in Ukraine.
The market is focused on US consumer confidence data and comments from Fed officials. The rise in the dollar, supported by Bostic's hawkish statements and strong PMIs, is pressuring gold, but the lack of clarity on tariffs and geopolitical tensions are limiting its further decline
Technically, the situation is simple in that it all depends on the resistance of the current channel. A break and consolidation above 3025 will trigger growth. A false break of the channel resistance will provoke a continuation of the decline both to 3004 and to 2980.
Resistance levels: 3024.6, 3038, 3056
Support levels: 3004.9, 2987, 2981
Based on the difficult fundamental environment, which is far from any positive decisions, the tensions in the Middle East, and the tariff war, I can conclude that gold will try to strengthen once again, as we have technical support: a strong bullish trend, a strong 3004 level, and a cascade of locally rising lows.
A failed breakdown will be false and in this case, a price consolidation under 3017 will trigger a fall to 3004.
Regards R. Linda!

The rebound presents a perfect opportunity to short gold.📍Gold has once again rebounded to the 3020-3025 range in the short term. You might think the bulls have regained control, but I see this rebound as a prime opportunity to short gold.
📍Currently, a new descending channel has formed within gold’s short-term structure. Despite multiple rebound attempts, the price has failed to break above this channel, further reinforcing its downward pressure. Additionally, on the daily chart, gold has printed three consecutive bearish candlesticks, undermining bullish sentiment and weakening confidence. This has also diminished the effectiveness of the 3000 support level, increasing the likelihood of further downside.
🔎Trade Idea:
Xauusd: Sell at 3015-3025
TP:3005-2995
SL:Adjust according to risk tolerance.
📩Trading means that everything has results and everything has feedback. I have been committed to market trading and trading strategy sharing, striving to improve the winning rate of trading and maximize profits. If you want to copy trading signals to make a profit, or master independent trading skills and thinking, you can follow the channel at the bottom of the article to copy trading strategies and signals

NEM - Big Move AheadOver the long term, I expect to see NEM at 100. My crude wave count shows that we are entering into a wave 3 that can boost shares to mid $80s.

EUR-USD bearish until mid-2025?Based on chart, there is potential downside for EURUSD going forward until mid 2025 or longer as long as the weekly bearish channel hold. We may stop trading the said direction if weekly candle breaks upwards (closes) outside the bearish channel.
This is a longer time frame (TF) (1W graph) directional idea.
What y'all think? Give your comments down below?

CRUDE OIL(WTI): Bullish Continuation Confirmed
One of the setups that we discussed on a today's live stream
was a bullish flag pattern on WTI Crude Oil on an hourly chart.
Its resistance breakout provides a strong bullish confirmation.
We can expect growth at least to 70 level.
❤️Please, support my work with like, thank you!❤️

Descending Channel in XAU/USD (Gold)Trade Setup for Descending Channel in XAU/USD (Gold)
**📉 Bearish Trade Setup (Sell Strategy)**
Since the price is trending within a descending channel, the best trade approach is to **sell at resistance** and **target support levels**.
**📌 Entry Points:**
🔹 **Sell Entry #1:** Near the upper boundary of the descending channel (~3,020 - 3,030).
🔹 **Sell Entry #2:** If price retests and fails to break above the 21 EMA (~3,015 - 3,018).
**🎯 Target Levels (Take Profit - TP):**
✅ **TP1:** 3,000 (Psychological level and lower channel support)
✅ **TP2:** 2,980 (Next major support zone)
✅ **TP3:** 2,960 (Extended target if the trend continues)
**🔒 Stop Loss (SL):**
🚨 **SL Above 3,035-3,040:** If price breaks out above the descending channel, it invalidates the setup.
**📊 Trade Confirmation:**
✅ **EMA Rejection:** Watch for price rejecting the **21 EMA (Blue Line)** as resistance.
✅ **Volume Analysis:** Look for increased selling volume when price approaches resistance.
✅ **Bearish Candlestick Patterns:** Such as **bearish engulfing, shooting star, or evening star** near resistance.
**📈 Alternative Bullish Setup (If Trend Breaks Upward)**
If price **breaks above 3,040 with strong volume**, it could signal a trend reversal. In this case:
🔹 **Buy Entry:** After a confirmed breakout & retest above 3,040.
🎯 **Targets:** 3,060 - 3,080.
🚨 **SL:** Below 3,030.
**Conclusion:**
🔻 **Primary Strategy: Sell on Rallies within the Channel.**
🔺 **Alternative Plan: Wait for a Bullish Breakout Before Buying.**
📉 **Stay disciplined with Stop Loss & Risk Management!*

Short gold at the right time after rebound📍Gold experienced a sharp decline to around 3002 in the short term — did it catch you off guard? Despite the rapid drop, I remained committed to my trading logic and strategy. As long as gold holds above the 3005-2995 support zone, a rebound toward the 3015 level remains likely. After stabilizing, gold has already rebounded above 3014, nearly reaching our target zone of 3015. In response, we opted to manually close our positions to lock in profits.
📍Looking ahead, our primary focus will be on the 3015-3025 resistance zone. In the short term, gold has shown signs of forming a descending channel structure. If it fails to decisively break above the 3015-3025 zone and invalidate the downtrend channel, there remains a possibility of a retest of the 3000 level, with further downside potential toward the 2995-2985 range.
🔎Trade Idea:
Xauusd: Sell at 3015-3025
TP:3010-3000
SL:Adjust according to risk tolerance.
📩Trading means that everything has results and everything has feedback. I have been committed to market trading and trading strategy sharing, striving to improve the winning rate of trading and maximize profits. If you want to copy trading signals to make a profit, or master independent trading skills and thinking, you can follow the channel at the bottom of the article to copy trading strategies and signals
XRP/USDT:BUY LIMITHello friends
You can see that after the price fell in the specified support area, buyers came in and supported the price and created higher ceilings and floors.
Now we can buy at the specified levels with capital and risk management and move with it to the specified targets.
*Trade safely with us*

BNB/USDT:BUY LIMITHello friends
You can see that after the price fell, buyers entered the specified support area and supported the price and created higher ceilings and floors.
Now we can buy at the specified levels with capital and risk management and move to the specified targets.
*Trade safely with us*

Nasdaq - The Most Decisive Point Ever!Nasdaq ( TVC:NDQ ) might break below all structure:
Click chart above to see the detailed analysis👆🏻
After breaking above the major channel resistance trendline just a couple of months ago, the Nasdaq is now being dominated by bears and starting to break everything back to the downside. So far we didn't see any confirmation but the next couple of days will decide just everything.
Levels to watch: $20.000, $16.000
Keep your long term vision,
Philip (BasicTrading)

Is it profitable to be long gold now?📍Although gold is in an overall downtrend, its decline has not been smooth during multiple tests of the 3000 level. Therefore, the support zone between 3005 and 2995 remains valid. Considering the downward momentum observed during the tests of 3000, gold is unlikely to experience a sharp drop. Instead, it may follow a pattern of gradual, oscillating declines. If gold receives strong support in the 3005-2995 range, a rebound toward the 3015 level is still possible, with the potential to extend further to the 3025 level.
🔎Trade Idea:
Xauusd: Buy at 3010-3000
TP:3015-3025
SL:Adjust according to risk tolerance.
📩Trading means that everything has results and everything has feedback. I have been committed to market trading and trading strategy sharing, striving to improve the winning rate of trading and maximize profits. If you want to copy trading signals to make a profit, or master independent trading skills and thinking, you can follow the channel at the bottom of the article to copy trading strategies and signals

UC UpdateThe news from Forex Factory today, assuming positive US economic data and negative Swiss data, strengthens the USD relative to the CHF, pushing the USD/CHF pair higher. Combined with a technical breakout and favorable sentiment, the pair’s direction for the days ahead is likely upward

EURUSD → Price is in consolidation. Emphasis on false breakdownFX:EURUSD is forming a correction within the consolidation that was formed on the uptrend. The reason for the consolidation is the halt in the movement of the dollar index...
The dollar is forming a counter-trend correction due to political and econmoic data, but the general background is bearish. But, the fall of the dollar, to which the index may soon return, may strengthen the growth of the currency pair. EURUSD consolidation within the uptrend (against the background of the dollar index correction). The zone of interest is the support at 1.078 and the imbalance area
Resistance levels: 1.078, 1.074
Support levels: 1.0936.1.1009
The price has not tested the support and is forming a correction to the imbalance zone 1.087 - 1.09 from which the price may return to the downward movement to 1.078. The emphasis is on the range support from which we should wait for a false breakdown before further growth.
Regards R. Linda!

GOLD → Long squeeze (false break of uptrend support) FX:XAUUSD within the liquidation the price is testing the key support at 3004.9 and forms a false break of support. The trend is generally bullish as the geopolitical situation remains tense and carries high risks.
Friday saw a liquidation phase relative to the consolidation at 3024-3045. Reason: the White House is expected to revise tariff policy, easing measures against key trading partners. Negotiations over the conflict in eastern Europe, where the U.S. is a key link, also support the positive sentiment. On Monday, market attention will focus on Russia-US talks, as well as preliminary PMI data that could affect the global economic outlook.
The focus is on the current consolidation and the 3024 level. If the bulls hold their defenses above this level, gold will continue to strengthen.
Resistance levels: 3045 - 3056
Support levels: 3024, 3004
The growth within the bullish trend may continue. The price is forming a consolidation between trend support and resistance at 3024. The emphasis is on 3024, if the bulls hold the defense over this zone, gold may head for a retest of the high (the initial reaction to ATH may trigger a pullback down)
Regards R. Linda!

USDJPY Wave Analysis – 24 March 2025
USDJPY: ⬆️ Buy
- USDJPY broke the resistance zone
- Likely to rise to the resistance level 151.35
The USDJPY currency pair rose strongly after breaking the resistance zone between the resistance level of 150.00 and the resistance trendline of the daily down channel in January.
The breakout of this resistance zone accelerated the active intermediate impulse wave (3) from the start of March.
Given the strongly bullish US dollar sentiment seen today, USDJPY currency pair can be expected to rise to the next resistance level 151.35 (the high of wave iv from last month).

Potential Downtrend in AlcoaAlcoa has bounced this month, but some traders could think it’s due for a pullback.
The first pattern on today’s chart is the series of lower lows and lower highs since December. The aluminum company has climbed to the top of that falling channel, which may create potential resistance.
Second, prices stalled at the falling 50-day moving average (SMA) in February and seem to be peaking at the same SMA this month.
Speaking of the 50-day SMA, it recently had a “death cross” below the 200-day SMA.
Next, stochastics are dipping from an overbought condition.
Finally, the 52-week low is near $27 and last year’s low is under $25. Combined with the falling channel, those levels may provide space for potential moves to the downside.
TradeStation has, for decades, advanced the trading industry, providing access to stocks, options and futures. If you're born to trade, we could be for you. See our Overview for more.
Past performance, whether actual or indicated by historical tests of strategies, is no guarantee of future performance or success. There is a possibility that you may sustain a loss equal to or greater than your entire investment regardless of which asset class you trade (equities, options or futures); therefore, you should not invest or risk money that you cannot afford to lose. Online trading is not suitable for all investors. View the document titled Characteristics and Risks of Standardized Options at www.TradeStation.com . Before trading any asset class, customers must read the relevant risk disclosure statements on www.TradeStation.com . System access and trade placement and execution may be delayed or fail due to market volatility and volume, quote delays, system and software errors, Internet traffic, outages and other factors.
Securities and futures trading is offered to self-directed customers by TradeStation Securities, Inc., a broker-dealer registered with the Securities and Exchange Commission and a futures commission merchant licensed with the Commodity Futures Trading Commission). TradeStation Securities is a member of the Financial Industry Regulatory Authority, the National Futures Association, and a number of exchanges.
TradeStation Securities, Inc. and TradeStation Technologies, Inc. are each wholly owned subsidiaries of TradeStation Group, Inc., both operating, and providing products and services, under the TradeStation brand and trademark. When applying for, or purchasing, accounts, subscriptions, products and services, it is important that you know which company you will be dealing with. Visit www.TradeStation.com for further important information explaining what this means.

GBPUSD - Chasing the Bulls!!Hello TradingView Family / Fellow Traders. This is Richard, also known as theSignalyst.
📈GBPUSD has been overall bullish trading within the rising channel marked in red.
Moreover, the blue zone is a major daily support.
🏹 Thus, the highlighted blue circle is a strong area to look for buy setups as it is the intersection of daily support zone and lower red trendline acting as a non-horizontal support.
📚 As per my trading style:
As #GBPUSD approaches the blue circle zone, I will be looking for bullish reversal setups (like a double bottom pattern, trendline break , and so on...)
📚 Always follow your trading plan regarding entry, risk management, and trade management.
Good luck!
All Strategies Are Good; If Managed Properly!
~Rich
Disclosure: I am part of Trade Nation's Influencer program and receive a monthly fee for using their TradingView charts in my analysis.

DOLLAR INDEX (DXY): Bearish Outlook Explained
Dollar Index is currently consolidating within a range on intraday time frames.
Testing its upper boundary, the market formed a double top pattern.
With a strong bearish mood after the opening, the market is going
to drop lower.
Goal - 103.8
❤️Please, support my work with like, thank you!❤️

Will this same bars pattern on CHZ repeat?Welcome back dear reader, for another Chilliz post.
As i've been analyzing the chart further my eye fell on the bars pattern from May till October 2020, and noticed that it looks ALOT like the current bars pattern.
The market structure it would form would also make alot of sense from a traders perspective. Allow me to explain while i have your attention.
The only sellers remaining now are from 2021 or earlier, so we might stay in this area for a couple of weeks for people to capitulate. Those that got in earlier are eager for a break-even and will probably get that end of this month or beginning of April. Then around the latter half of May we might see 0.20$ followed by a retest of the lower bounds forming a perfect W as traders suspect it to be the absolute end of the bullmarket. Only for it to be followed by a quick recovery and a massive blowoff top!
Target: Remains around 3$ (The fractal would indicate 17$ and a market cap of 160B, at 3$ it would be 28B which isn't too farfetched)
Stoploss: 0.032$
Final remarks: Do i know for certain that it will happen? No, but the charts tell us a different story.
Rustle
