Gold (XAU/USD) Sell-Off Continues | Bearish Target insightGold Spot (XAU/USD) indicates a potential continuation of the current downtrend.
🔹 Sell Limit at 3082: A significant level where a sell order was placed, marking the start of the recent decline.
🔹 Strong Downtrend: After rejecting the 3082 level, gold has been making lower highs and lower lows, confirming bearish momentum.
🔹 Support & Target Zone: Price is approaching a key support area near 2880-2900, which aligns with the marked target level.
📉 Bearish Outlook:
If the price breaks below the current support, further downside is expected.
A potential bounce could occur at the target zone before a trend reversal.
💡 Key Levels to Watch:
Resistance: 3082
Support/Target: 2880-2900
Traders should monitor price action at support to determine if further downside is likely or if buyers step in for a potential reversal.
What’s your outlook on gold? Will the bearish trend continue? 📉💰
Parallel Channel

Orbs to provide a 20x?Welcome back dearest reader!
Today we will analyse another project called Orbs. Looking at their website the fundamentals look great! But other than that, the chart also looks fantastic!
When looking at past performance its clear orbs has been in a massive flag formation since march 2021, it has broken out in october 2023 and has just now touched a very important support zone! Expecting upside momentum from here untill august.
Target: 0.40$
Stoploss: 0.0145$

NASDAQ INDEX (US100): Important Breakout I spotted a great example of a bullish reversal on 📈US100.
The index formed a double bottom pattern on a 4-hour chart and broke and closed above a resistance line of a descending channel.
There is a positive response on retesting the key support level based on a broken neckline.
It is expected that the index will continue to rise towards the 20,000 / 20180 levels.

GOLD is at temporary topaccording to this massive and long-term rising channel for gold, seems like the top is so close & we might see temporary pull back to the bottom of this channel which makes sense, because it is the previous ALL TIME HIGH

OMUSDT → Paranormal behavior. Rally readinessBINANCE:OMUSDT as a whole looks stronger than the market. After a strong rally a correction in the format of a bearish wedge is formed, subsequently the price broke the resistance and is trying to consolidate above the key support
Against the background of a weak market OM coin has good prospects as technically someone is interested in this project and the coin as a whole behaves strongly and looks stronger than the market.
A breakout of the bearish wedge (consolidation pattern within the correction) is forming. If the bulls keep the coin above the previously broken figure resistance and above the base of the 6.752 reversal pattern, the growth may continue in the short to medium term
Resistance levels: 7.39, 7.98
Support levels: 6.752, 6.51
One of the few coins that is rising while bitcoin is falling. Focus on the previously mentioned support levels, as well as on the local resistance 7.05, the break of which may provoke a prolongation of growth
Regards R. Linda!

GBPUSD → Consolidation after a trend breakout. Long-Squeeze?FX:GBPUSD may test the local support amid the pre-news correction of the DOLLAR. Traders are waiting for inflation data, high volatility is possible
The fundamnetal situation is predisposed in favor of the pound sterling, which has an advantage on the back of the falling dollar, which is likely to take a medium-term position on the back of the Trump administration.
Technically, GBPUSD is consolidating above the key support zone of 1.286 - 1.280 below which a huge pool of liquidity has formed which could be tested before the trend continues.
Important news ahead. Traders are waiting for CPI data. High volatility is possible
Resistance levels: 1.2938 (trigger)
Support levels: 1.2868, 1.281, 1.2728
Bulls may be aggressive and keep the price from correcting downwards. In this case, price consolidation above 1.2938 could be a good entry point for the continuation of growth. But because of the upcoming news, I would prefer to wait for a retest of the liquidity zone 1.2868 - 1.281 before taking action to open a position.
Regards R. Linda!

NZDJPY → Attempting to change the downtrendFX:NZDJPY is trying to get out of the downtrend by breaking the channel resistance. Against the background of local strengthening of the dollar, the currency pair has all chances.
Technically, buyers are starting to gain momentum and support the market, it can be seen on the background of locally growing minmiums, which gradually leads to the breakout of the channel resistance. The trigger in our case is the resistance 85.240 - a key level that divides the market into 2 planes.
If the bulls are able to consolidate above 85.240, an impulse to 86.13, then 86.88 may be formed in the short-term.
Support levels: 84.500, 84.00
Resistance levels: 85.240, 86.13
Initial testing of the trigger may end in a small pullback due to liquidity formed above. The pullback may be directed towards the previously broken channel resistance. But the emphasis is on price consolidation above 85.240, as this will be a prerequisite that the bulls are holding the market in the moment and are ready to keep going up.
Regards R. Linda!

Gold's Crazy Run: New All-Time High of 2994 - Reaching the TopFirst off, congratulations to those who entered a Buy order following yesterday's plan that I posted earlier.
Gold is currently forming a small sideways range around the 2980-2990 area, and I believe there will be another upward push to grab liquidity from those entering SELL orders around this zone. This will create market panic, reaching a peak where no one dares to participate anymore. At that point, Gold will experience a strong correction.
Therefore, today's Asian and European sessions will likely see a sideways range between 2980-2990, and the beginning of the US session will see an upward push to grab liquidity above the 3000 USD/oz level. The US session will then conclude with a price drop. If Gold's scenario plays out as expected, we can anticipate a profit-taking day from investors next Monday
Thank you for your review, and I hope you'll stay longer by pressing Follow.

Gold Update | $3,200Strong uptrend and a similar fractal pattern like the last setup. Price is at the 5th wave and 3rd secondary wave.

Gold (XAU/USD) - Potential Liquidity Sweep Before ReversalGold has been in a strong uptrend, forming a rounded bottom pattern, which led to a breakout above key resistance. Currently, price is consolidating near the all-time high (ATH) around $3,005, suggesting a potential liquidity sweep before a larger move.
📌 Key Observations:
Rounded Bottom Formation: A bullish reversal pattern led to a breakout.
Consolidation Zone: Price is ranging just below the ATH, likely gathering liquidity.
Liquidity Sweep & Weak Highs: The chart suggests a push above the ATH to trigger stops before a potential reversal.
Projected Bearish Move: A break lower could lead to a corrective move towards $2,920 - $2,800 in the coming sessions.
⚠️ Trading Plan:
Bullish Scenario: A clean breakout above ATH with strong volume could invalidate the bearish setup.
Bearish Scenario: If the liquidity sweep occurs and price fails to hold above ATH, a strong sell-off could follow.
Traders should watch for confirmation signals before entering any positions. Stay cautious and manage risk effectively!
📊 What are your thoughts? Will gold continue higher or reverse? Share your views below!
#XAUUSD #Gold #Trading #Forex #LiquiditySweep #ATH

AUDNZD giving signs of bearish trendCurrently, the price is breaking an important support level, which has been tested a couple of times. Apart from this violation of parallel channel, it can be seen that as soon as the price broke the lower trendline, it returned to retest that level and went down sharply. Our bearish trend will be confirmed once the price marks LL and comes back for LH; then, we can either place a sell limit or sell stop order

BITCOIN → Short-squeeze 86-89K before falling further to 75KBINANCE:BTCUSD continues to form a downtrend after breaking the bullish structure on the weekly timeframe. There is no bullish driver yet, and technically, the price is heading to the global imbalance zone of 75-73K
The past crypto summit and any other talk of cryptovalt support cannot support the market. Such events end with further market decline.
Technically, the market continues to form a downtrend (global counter-trend), based on this alone, we can say that the price is now going against the crowd and this is generally logical behavior. Globally, the zone of interest is located in the following zones - 75K, 73K and order block 69-66K
Locally, I would emphasize the nearest liquidity zones, located at the top, which can be tested before the further fall: 86697, 89.397
Resistance levels: 85135, 86678, 89397
Support levels: 79987, 78173, 73512
After the false break of 78K support there is no strong reaction, the market is forming a struggle for 84-85K zone, which generally indicates buying weakness. Before the further fall there may be a short-squeeze relative to the above mentioned zones of liquidity, which may lead to a further fall
Regards R. Linda!

Bitcoin Rejection at Resistance – More Downside Ahead?BTC/USD is trading within a descending channel, and price is now testing a key resistance zone near $84,500. If sellers step in, we could see a strong rejection leading to a further drop.
📍 Trade Setup:
Short Entry: Near $84,500 - $85,000 (resistance zone)
Stop Loss: Above $87,400 (to invalidate bearish setup)
Target: $71,700 - $71,500 (lower boundary of the channel)
🔍 Technical Factors:
✔️ Bearish market structure with lower highs and lower lows
✔️ Resistance zone acting as a strong supply area
✔️ Descending channel guiding price lower
💡 Trading Plan:
Look for rejection signs (bearish wicks, engulfing candles, or trendline rejections) before confirming a short position.
A break above $87,400 could invalidate this setup and signal a potential reversal.
📢 What’s your view? Will Bitcoin break down, or are the bulls ready to take control? Let’s discuss! 🚀👇

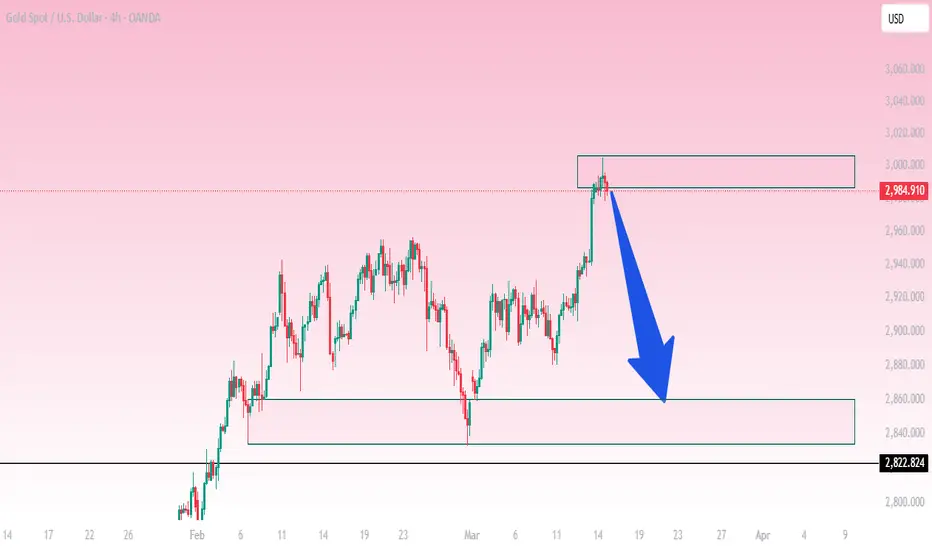
XAU/USD Reversal Setup – Potential Drop Incoming!Gold (XAU/USD) has recently tested a key resistance zone around $2,990, where price action is showing signs of rejection. The market made a strong bullish push, but the momentum appears to be fading near this supply zone.
📉 Possible Scenario:
A bearish reaction from this resistance level could lead to a retracement towards the next key demand zone between $2,860 - $2,840.
If selling pressure continues, we might even see a retest of the $2,822 support level.
🔍 Technical Outlook:
Price is currently at a resistance zone, making it a high-probability short setup.
Confirmation with bearish candles or trendline breaks could provide more confidence for sell entries.
Targets for shorts are set at $2,860 and potentially $2,822.
💡 Trading Plan:
Look for bearish confirmations (rejections, engulfing patterns, trendline breaks) before entering short trades.
A daily close above $3,000 would invalidate this setup and could signal further bullish movement.
What do you think? Are you bearish or bullish on Gold? Drop your thoughts in the comments! 📊🔥
Royalty Breakout: A 60% Move in the Making?This is the monthly chart of royalty companies FNV, WPM, RGLD, SAND, and OR combined. A five-year consolidation was recently broken on the weekly timeframe, with confirmation. The last similar breakout after consolidation led to a ~150% increase from the bottom.
At today's gold price of $3,000, this scenario looks highly probable. If it unfolds, these companies could see a cumulative gain of around 60% from current levels.

DOGEUSDT near major daily supportsAs we can see price can easily dump more to the 0.9$ support zone but soon we can expect channel resistance to break too and if that happen then market is once again bullish and bull candles can easily pump the price to 0.30$ at least.
DISCLAIMER: ((trade based on your own decision))
<<press like👍 if you enjoy💚
