XAUUSD FORMED A BULLISH PENNANT PATTERN-ANOTHER BULLISH IMPULSE?XAUUSD FORMED A BULLISH PENNANT PATTERN - ANOTHER BULLISH IMPULSE?📈
Gold has been under buying pressure since the beginning of the year. Since April 21 the price has been consolidating. Now the graph represents the bullish pennant.
What is a bullish pennant?
Pennant pattern: Short-term continuation pattern after a sharp price move (flagpole), forming a small symmetrical triangle. Signals trend resumption, lasts 1-3 weeks with declining volume. So, first of all, identify a flagpole and a consolidating triangle. Confirm it with indicators (bullish/bearish divergence). After that you may trade breakout in trend direction (buy bullish, sell bearish) with volume spike. Set your stop-loss below/above the opposite side of pennant. You may set your take-profit at a flagpole height from a breakout.
Here we see the divergence on RSI 4-h timeframe. If the price breaks the upper border of the pennant pattern you may open long position.
Parallel Channel

EURUSD – Preparing For Potential Volatility AheadThe week ahead has all the elements to be a volatile one for EURUSD traders to navigate. First, the unwind of long positions that has been on-going throughout July, since prices hit a 4 year high at 1.1830 on July 1st may have potentially found a short-term base after rebounding last week from printing a low of 1.1556 on Thursday. More on this in the technical section below.
Secondly, Bloomberg reported over the weekend that negotiations to agree a trade deal between the US and EU are proving to be more challenging than initially hoped. This leaves room for market moving headlines on this topic, or social media posts from President Trump that could influence the direction of FX markets, especially if it shifts trader expectations towards preparing for the prospect of a trade war between these two global economic heavyweights.
Then on Thursday, consideration needs to be given to the ECB interest rate decision (1315 BST) and then the press conference led by ECB President Lagarde, which starts at 1345 BST. After eight consecutive rate cuts at their previous meetings, the European Central Bank are expected to take a pause to assess incoming inflation and growth data, so this outcome would probably not be a surprise. However, the comments of Madame Lagarde in the press conference could increase EURUSD volatility given that there is some uncertainty surrounding whether a further rate cut is possible either in September, or later in the year.
Technical Update: Limited Price Correction or Reversal?
We all know well, even if an asset is trading within a positive uptrend, periods of price weakness can materialise, before fresh buying support develops. This can lead to renewed price strength that manages to break and close above a previous high, leading to an extension of a pattern of higher price highs and higher price lows.
Having been capped by the July 1st high at 1.1830, EURUSD has seen a price correction develop. Traders may be trying to decide if this is a limited move lower before fresh price strength is seen, or if it could be a price reversal, which may result in risks of a more extended phase of price weakness.
Much will depend on the outcome of the risk events outlined above, as well as future market sentiment and price trends, however it is possible to assess what may be the important support and resistance levels that traders could focus on to help gauge the next direction of price activity
Potential Support Levels:
After a period of price strength, it can be useful to calculate Fibonacci retracements on the latest up move to identify areas of potential support. As the chart below shows, for EURUSD, the latest phase of price strength seen from 1.1065 the May 12th low up to 1.1830, the July 1st high can be used for this purpose.
The 38% retracement of this advance stands at 1.1539 and after having remained intact during last week’s sell off, traders may now be watching how this support level performs on a closing basis.
Breaks below 1.1539, while not a guarantee of further price declines, may then lead to a deeper phase of weakness towards 1.1446, the June 19th low, even 1.1356, which is equal to the lower 61.8% retracement level.
Potential Resistance Levels:
If the 38% retracement support at 1.1539 holds any future price weakness in the week ahead, a positive trending condition may still be in place, opening the possibility of EURUSD moving back to higher levels again.
Any potential upside move could bring 1.1690 into play as an important resistance. This is the current level of the Bollinger mid-average, with closing breaks above this needed to open retests of 1.1830 July 1st highs, maybe further if this is in turn broken.
The material provided here has not been prepared accordance with legal requirements designed to promote the independence of investment research and as such is considered to be a marketing communication. Whilst it is not subject to any prohibition on dealing ahead of the dissemination of investment research, we will not seek to take any advantage before providing it to our clients.
Pepperstone doesn’t represent that the material provided here is accurate, current or complete, and therefore shouldn’t be relied upon as such. The information, whether from a third party or not, isn’t to be considered as a recommendation; or an offer to buy or sell; or the solicitation of an offer to buy or sell any security, financial product or instrument; or to participate in any particular trading strategy. It does not take into account readers’ financial situation or investment objectives. We advise any readers of this content to seek their own advice. Without the approval of Pepperstone, reproduction or redistribution of this information isn’t permitted.

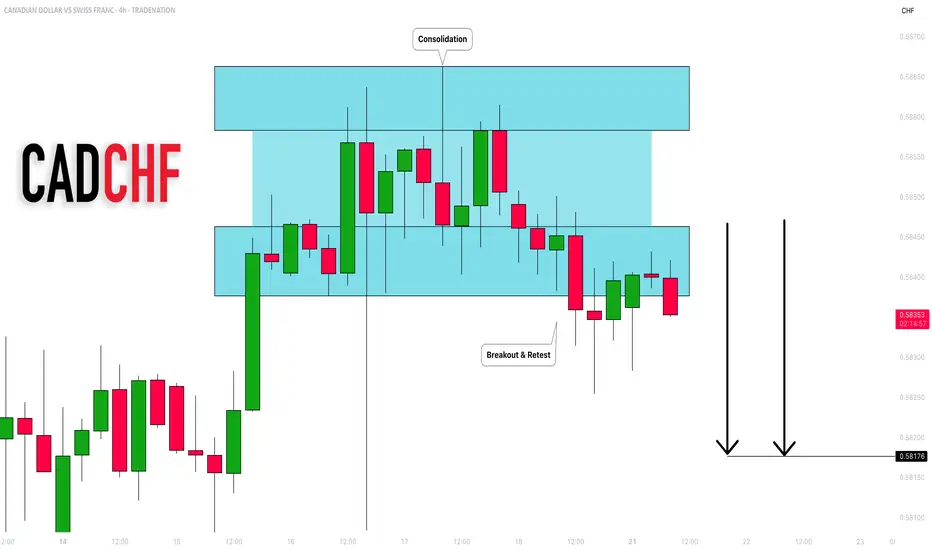
CADCHF: Bearish Outlook Explained 🇨🇦🇨🇭
CADCHF completed an intraday consolidation within a horizontal
parallel channel.
Its support was broken on Friday and we see a positive bearish
reaction to that after its retest.
With a high probability, the price will drop to 0.582 level soon.
❤️Please, support my work with like, thank you!❤️
I am part of Trade Nation's Influencer program and receive a monthly fee for using their TradingView charts in my analysis.
CNY/USD Trend since 06 2007. Channel. Reversal zone.Logarithm. Time frame 1 week. At the moment, the currency is stronger than the dollar.
The main trend is a descending channel. The price is in it now.
Secondary trend — breakout of the descending trend line. Price growth to the median of the channel, and in case of its breakthrough, to the resistance. If not, then a pullback to the lower zone of the channel.
Local trend — The nearest events and news background, which can affect (not necessarily) locally (movements to the median of the channel, i.e., the middle, if it is positive) on the yuan rate. This, in less than 1 month, namely from October 22 to 24, 2024 will be held 7.16 XVI BRICS summit (short for Brazil, Russia, India, China, South Africa) in Russia in Kazan.
Line graph for visualization.

APT : Did the buyers arrive?Hello friends🙌
📈An ascending channel and then a descending channel and then an ascending channel.📉
✔The point is that when the price entered an ascending channel, your price entered and with a failure it entered a descending channel and you exited with a loss and again when the price is at the peak of despair you see that the main buyers enter and push the price up and cause a new ascending channel.
🔊Considering these tips we have told you, always have a trading plan and follow capital management so that you do not fall into the trap.
🔥Follow us for more signals🔥
*Trade safely with us*

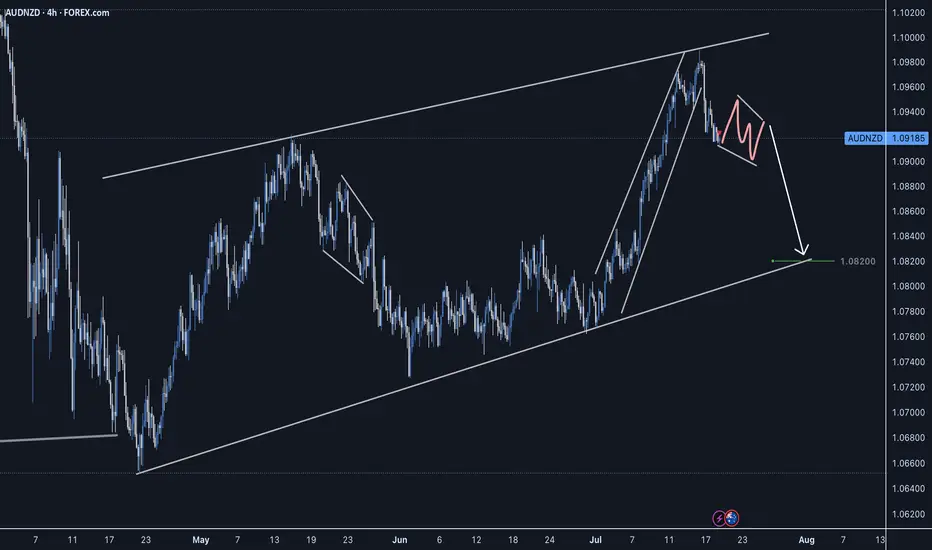
AUDNZD Short Setup - CAB EntrySellers stepping in, strong reversal impulse. Waiting for a slight correction before taking a short entry on the LTF.
Good Luck
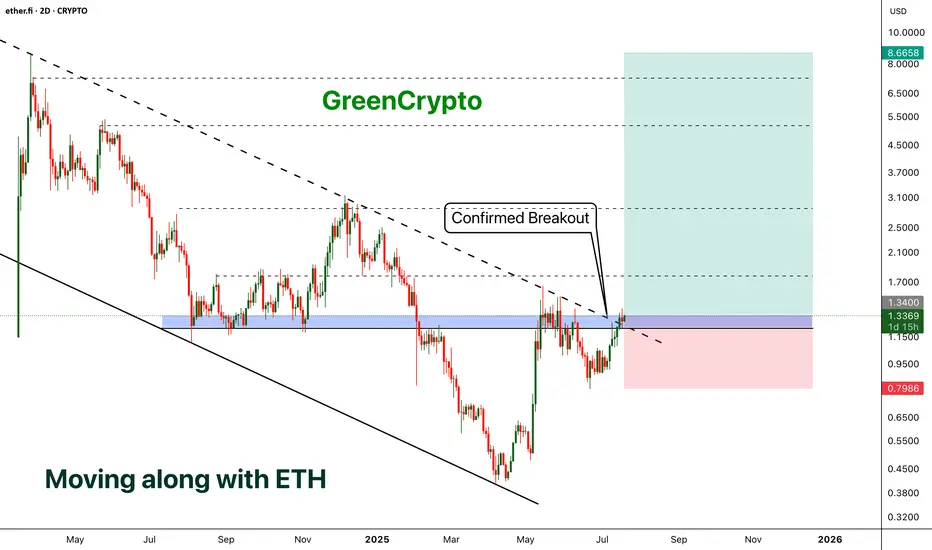
ETHFI - Moving along with the ETH- ETHFI has finally broken out from the descending channel pattern and now price is above the trending resistance line.
- We can expect a minor reversal (chances are less ) and parabolic move from here.
- I'm expecting at-least 500+% profit from this opportunity
Entry Price: 1.3384
Stop Loss: 0.7965
TP1: 1.7657
TP2: 2.5436
TP3: 4.5055
TP4: 5.6136
TP5: 8.5626
Max Leverage 5x.
Don't forget to keep stoploss.
Support us by Liking and following.
Thanks and Cheers!
GreenCrypto
APT - A lower timeframe view - Breakout Entry- On 1D candle, APT is still trading inside the channel
- currently price is trading near the resistance and got rejected from the resistance as expected.
- I'm expecting few more candles near the resistance zone before breakout.
If we look at the higher timeframe (1W) view we shared earlier, there is huge potential for uptrend as we are expecting past pattern to repeat
if you are looking for a short term trade without focusing on weekly chart, this is a good opportunity
Entry Price: 5.313
Stop Loss: 3.462
TP1: 6.141
TP2: 7.270
TP3: 8.634
TP4: 10.583
TP5: 14.768
Don't forget to keep stoploss
Cheers
GreenCrypto

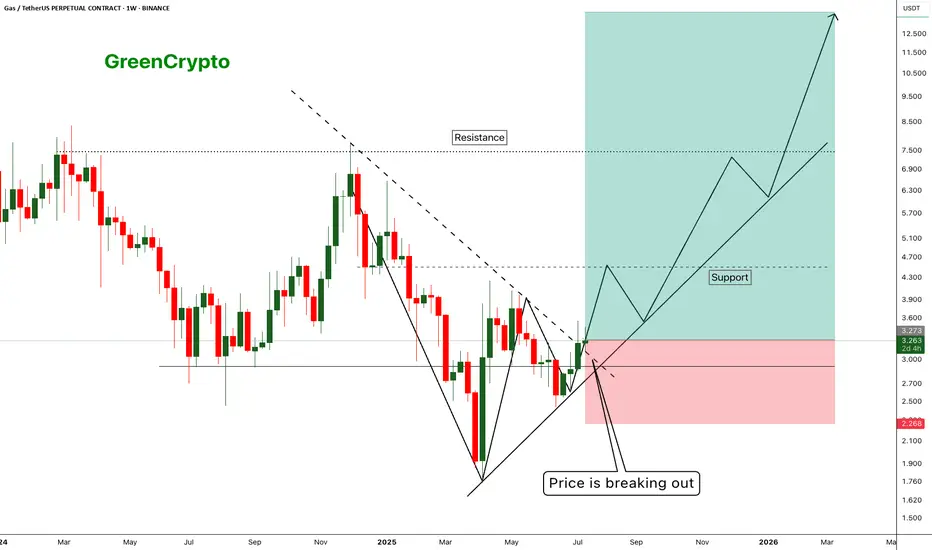
GAS - Huge Risk:Reward Trade 1:10 - Is there any Gas Left ?- Gas has finally managed to breakout from the resistance trendline and now trading just above the resistance
- I'm expecting this trend to continue along the support line shown in the chart.
Entry Price: 3.281
Stop Loss: 2.271
TP1: 3.944
TP2: 4.589
TP3: 6.775
TP4: 8.412
TP5: 13.512
Max Leverage 5x.
Don't forget to keep stoploss.
Support us by Liking and following.
Thanks and Cheers!
GreenCrypto
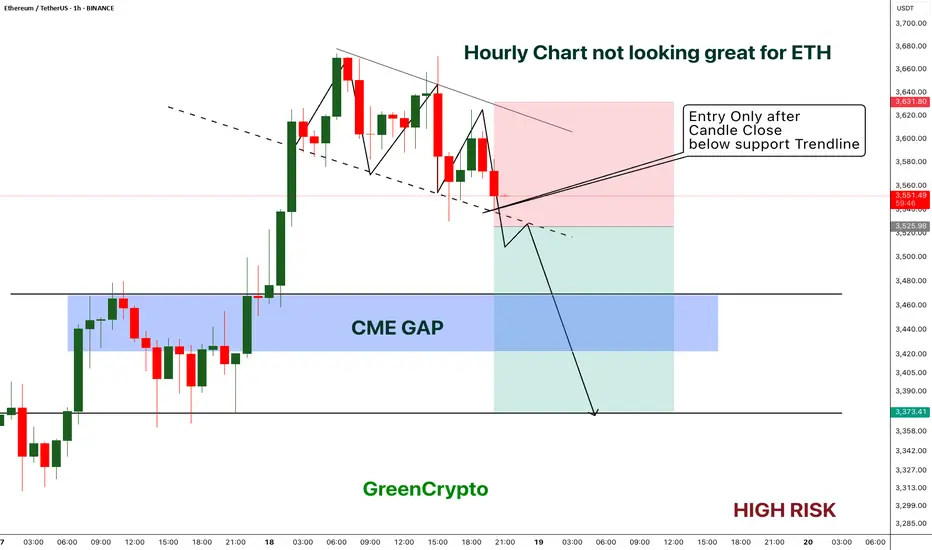
ETH - Short Trade with HIGH RISK- ETH got reject from resistance multiple times on 1H timeframe and now the price is playing near the support.
- I'm expecting overall market to cooldown this weekend, this could push the ETH to break the support
- ETH has CME gap around 3422 - 3467 range, im expecting this CME gap to be filled soon.
Entry Price: Below 3525
Stop Loss: 3631
TP1: 3471.15
TP2: 3381.76
Move SL to breakeven on TP1 hit.
Don't forget to keep stoploss.
Cheers
GreenCrypto
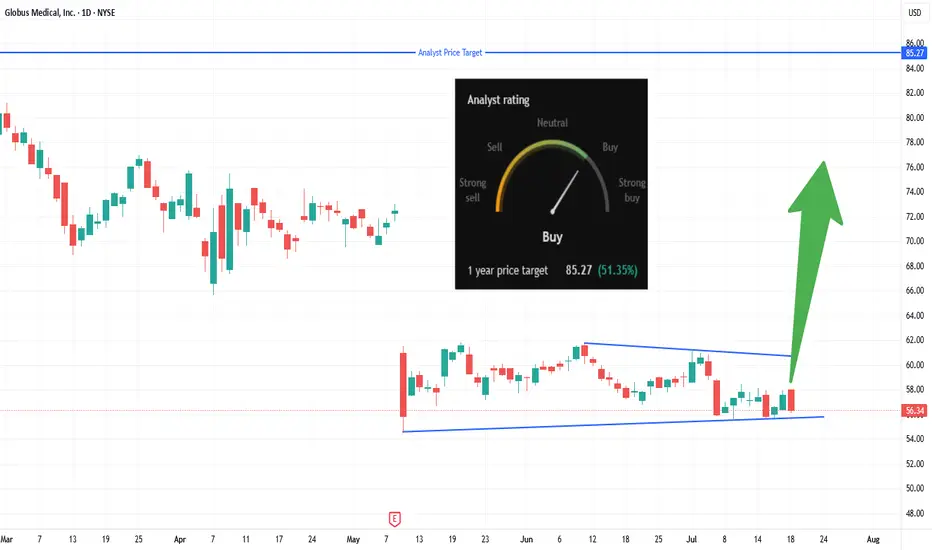
Will GMED Catch a Bid at Channel SupportTrade Summary 📝
Setup: Channel squeeze at multi-week support; volatility contracting.
Entry: Entering at market (current price ~$56.34), bottom of channel.
Stop‑loss: $55.50 (tight stop under structure).
Targets: $62 (channel top), $70+ (gap area), $85.27 (analyst 1-year target).
Risk/Reward: Strong; defined risk, multi-level upside.
Technical Rationale 🔍
Channel base tested several times; buyers defending $56 area.
Compression pattern—price “coiling,” often leads to explosive moves.
Momentum trigger: Break above $60 could attract breakout buyers and short cover.
Catalysts & Context 🚦
Analyst 1-year target: $85.27 (+51%), “Buy” rating.
Recent market pullback has GMED holding steady—showing relative strength.
Watching for sector rotation into healthcare/medtech.
Trade Management Plan 📈
Entry: Executing at market, stop at $55.50.
Stop-loss: Hard stop at $55.50 to minimize risk.
Scaling: First target $62 (channel top), then $70+. Hold a runner for $85.27 if breakout has legs.
What’s your move on GMED?
🔼 Long—Bottom fishing
🔽 Short—Breakdown risk
🔄 Waiting for $60+ breakout
Disclaimer ⚠️: Not financial advice. Trade at your own risk and use stops!
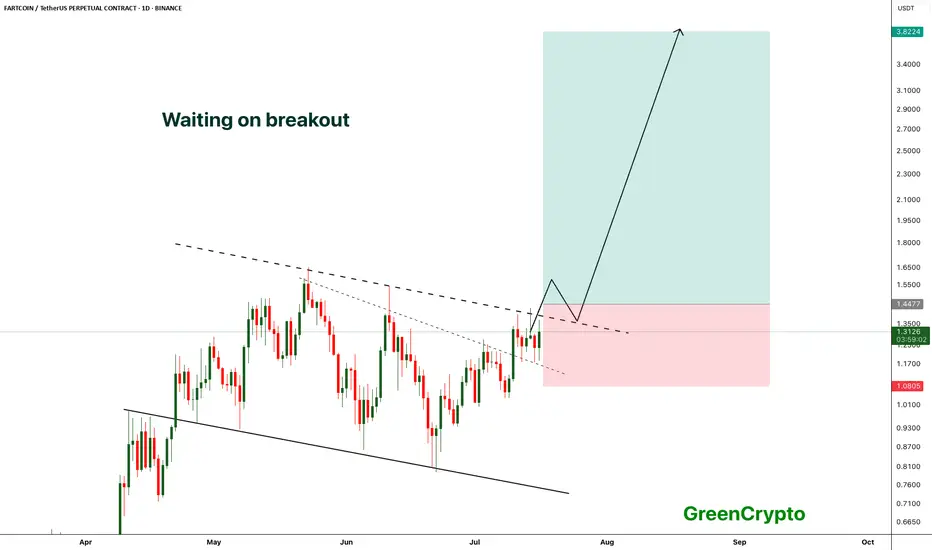
FARTCOIN - Breakout from the channel- FARTCOIN is waiting to breakout from the channel, a confirmed breakout would push the price to new all time high
- we have long trade opportunity once the price breaks above the resistance trendline
Entry Price: above 1.44
Stop Loss: Below 1.08
TP1: 1.6464
TP2: 1.8923
TP3: 2.2450
TP4: 2.9973
TP5: 3.8224
Max Leverage: 5x
Don't forget to keep stoploss
Cheers
GreenCrypto
SOL - Trend-Following Longs in the making!Hello TradingView Family / Fellow Traders. This is Richard, also known as theSignalyst.
📈SOL has been overall bullish trading within the rising channel in red.
Moreover, the orange zone is a strong demand.
🏹 The highlighted blue circle is a strong area to look for buy setups as it is the intersection of the orange demand zone and lower red trendline acting as a non-horizontal support.
📚 As per my trading style:
As #SOL retests the blue circle zone, I will be looking for bullish reversal setups (like a double bottom pattern, trendline break , and so on...)
📚 Always follow your trading plan regarding entry, risk management, and trade management.
Good luck!
All Strategies Are Good; If Managed Properly!
~Richard Nasr

GBPCHF → Retest of resistance to the global downtrendFX:GBPCHF is facing resistance from the local trend, which is aligned with the global bearish trend. The trend may continue...
A retest of resistance is forming within the global downtrend. As part of the correction, the price is testing the zone of interest and, after a false breakout of 1.7935, is returning to the selling zone.
The currency pair is rebounding from the resistance of the local trend, which coincides with the global trend. Consolidation of the price below 1.078 may trigger a continuation of the decline
Resistance levels: 1.07932, 1.0823
Support levels: 1.07744, 1.07255
Price consolidation in the selling zone followed by a break of the local structure could strengthen the bearish sentiment, which could trigger a further decline overall.
Best regards, R. Linda!

GBPJPY: Get Ready to Buy 🇬🇧🇯🇵
GBPJPY is consolidating within a narrow horizontal range
on a daily time frame.
I am waiting for its bullish breakout and a daily candle close above
199.85 to confirm the next bullish wave.
A rise will be expected to 201 level then.
❤️Please, support my work with like, thank you!❤️
I am part of Trade Nation's Influencer program and receive a monthly fee for using their TradingView charts in my analysis.

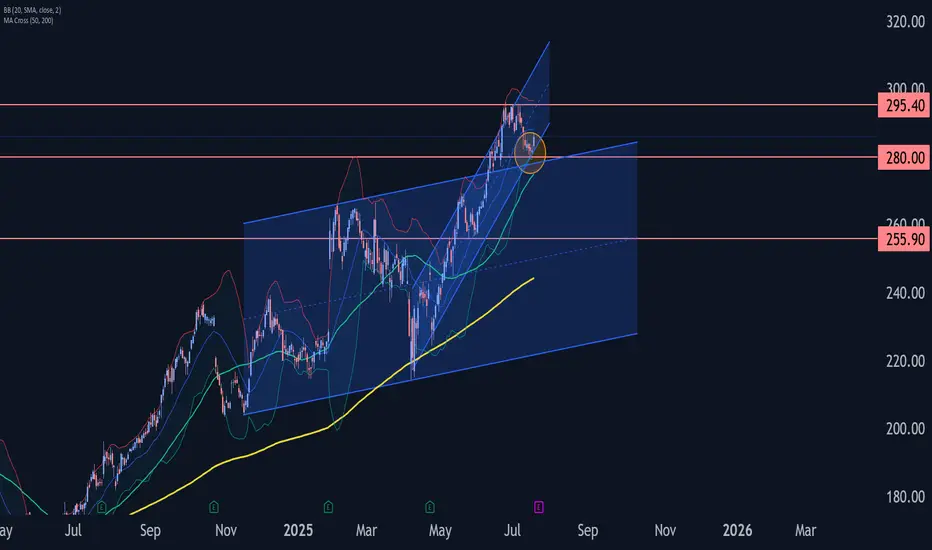
IBM Wave Analysis – 18 July 2025
- IBM reversed from support zone
- Likely to rise to resistance 295.40
IBM recently reversed up from the support zone between the support level 280.00, upper trendline of the recently broken weekly up channel from 2024 and the support trendline of the more recent up channel from April.
This support zone was further strengthened by the lower daily Bollinger Band and by the 38.2% Fibonacci correction of the sharp upward impulse from May.
Given the clear daily uptrend and the oversold daily Stochastic, IBM can be expected to rise further to the next resistance 295.40 (which stopped the previous waves 3 and (b)).
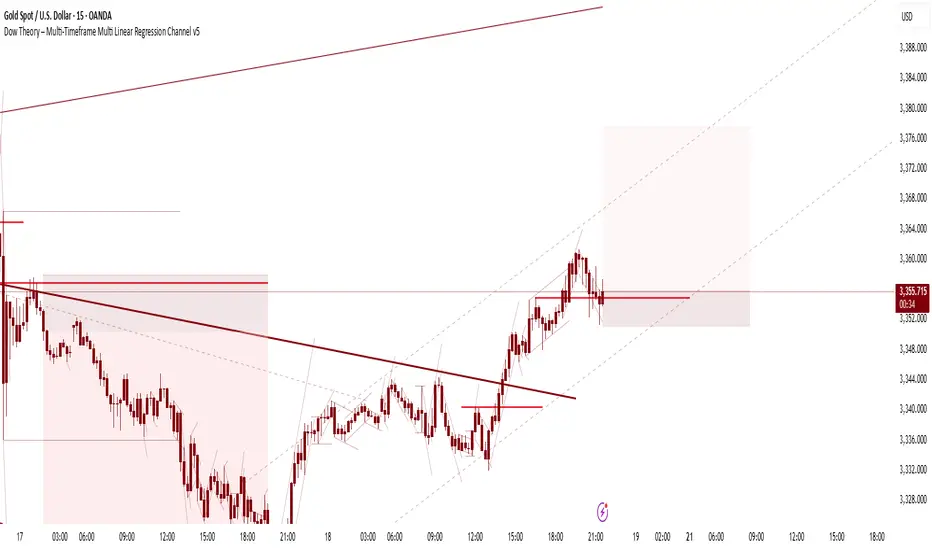
Long XAUUSDPrice retest the fomo zone
Uptrend in H4, M15
Stoploss at the swing low
TP at the previous highest high peak
Lfg
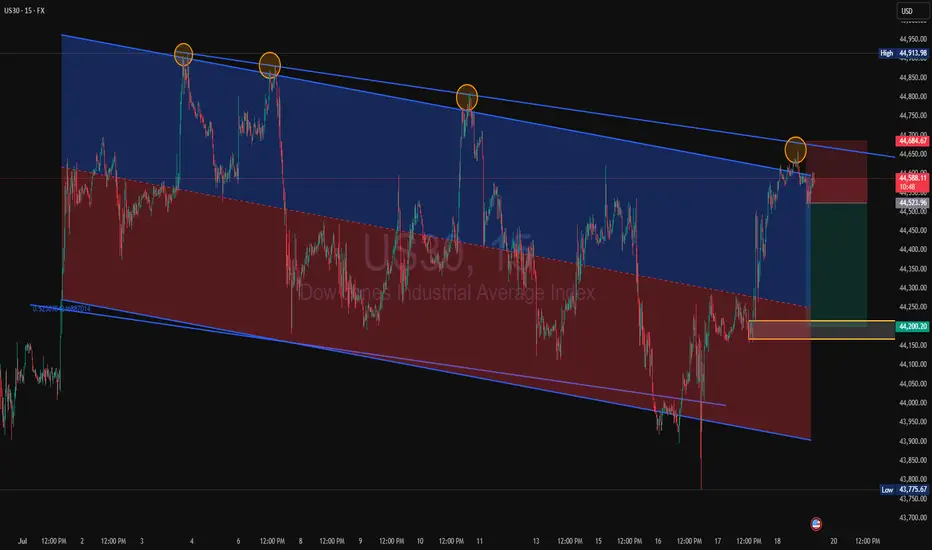
US30 Rejection at Channel Resistance US30 is showing a repeated pattern of rejection at the upper boundary of the descending channel. Price has now tapped this trendline for the fourth time, forming a consistent bearish structure.
Price rejected again at the top of the descending channel (marked by orange circles)
Clear sell setup with stop above the most recent swing high, targeting the lower channel boundary around 44,200, aligning with past demand.
Short below 44,685
Target: 44,200
Stop: Above recent highs near 44,913
Risk/Reward: Favourable if structure holds. If this pattern plays out as before, we can expect another push to the downside within the channel.
A break and retest of the midline could add extra confirmation.
#US30 #DowJones #PriceAction #SellSetup #BearishRejection #ChannelTrading #TechnicalAnalysis
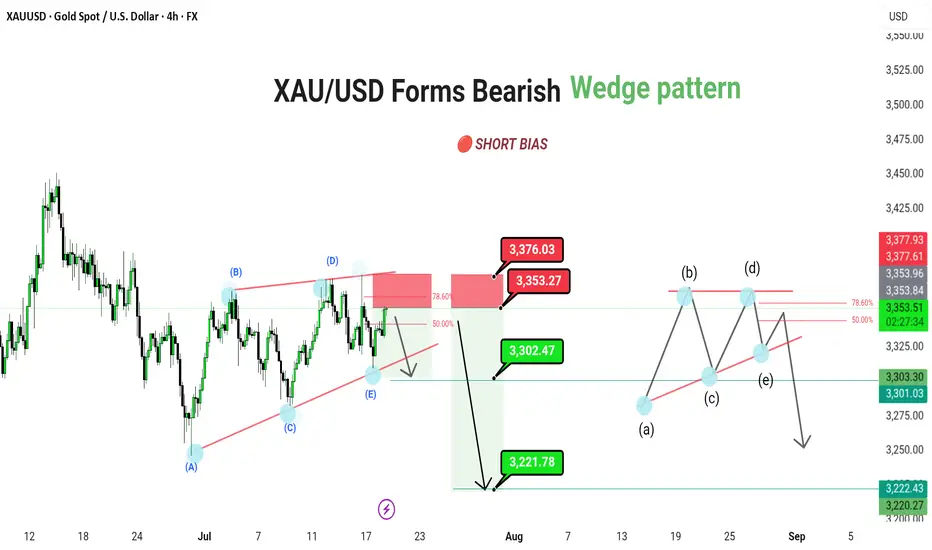
XAU/USD Forms Bearish Continuation Triangle – Future Downside
XAU/USD (4H) | FX | Gold Spot vs US Dollar
🔴 SHORT BIAS
📅 Updated: July 18
---
🔍 Description
Gold is trading within a bearish contracting triangle, suggesting a continuation move to the downside after the recent corrective bounce. Price is currently approaching the key 3,371–3,376 resistance zone, which aligns with the 78.6% Fibonacci retracement and upper triangle boundary.
This resistance confluence could mark the termination of the (E) wave of the triangle, paving the way for a larger downward thrust. A confirmed break below 3,302 would open the door toward 3,221 as the next major target.
The structure also leaves room for a minor internal triangle (a)-(b)-(c)-(d)-(e) pattern within the broader range, reinforcing the bearish setup.
---
📊 Technical Structure (4H)
✅ Bearish contracting triangle: (A)-(B)-(C)-(D)-(E)
✅ 78.6% Fibonacci + supply zone = ideal rejection point
✅ Internal triangle projection aligns with lower support test
📌 Downside Targets
Target 1: 3,302.47
Target 2: 3,221.78
🔻 Invalidation: Above 3,376.03
---
📈 Market Outlook
Macro View: Rising real yields and cooling inflation reduce gold’s appeal
Fed Watch: Hawkish tone supports USD, weighing on XAU
Technical View: Structure favors downside break from triangle formation
---
⚠️ Risks to Bias
Break and daily close above 3,376.03 invalidates triangle structure
Sudden risk-off sentiment or dovish Fed shift could boost gold demand
Sharp reversal in dollar strength
---
🧭 Summary: Bearish Breakout Setup Forming
XAU/USD is completing a bearish triangle structure, with price sitting just below resistance. A rejection from the 3,371–3,376 zone can trigger a breakout lower, first toward 3,302, then extending to 3,221. As always, confirmation and tight risk control are key.
---
ETHUSD - ANOTHER GROWING WEEK
ETHUSD - ANOTHER GROWING WEEK✅
ETHUSD has been growing all these days together with a bitcoin. All the news, listed in my previous post for the BTCUSD are also valuable here. Really nice fundamental support, people are purchasing the asset.
But what's with technicals? 📊
Compared to the bitcoin, ETHUSD hasn't reached ATH. According to a daily chart (pic 1), the price has been moving sideways since 2021 and a strong resistance is waiting ahead at 4,000.00. However, for now we are good. I bet that during upcoming days the asset will reach this level and rebound from it. Will it break the resistance? I think it is too early to make any conclusions.

BTCUSD - GOOD SUPPORT ESTABLISHED?BTCUSD - GOOD SUPPORT ESTABLISHED?📈
Yesterday, after a record-breaking nine-hour House session, U.S. lawmakers passed three major crypto bills: CLARITY Act (294-134), which establishes a market structure for cryptocurrencies, GENIUS Act (308-122) that supports U.S. stablecoin innovation and an Anti-CBDC Surveillance State Act (219-210) that opposes central bank digital currencies. All of this supports crypto and especially Bitcoin.
Technically, BTCUSD looks bullish also, establishing a new bullish trend. I expect the ATH at 123,190.30 will be rewritten soon. Where will be the next stop, I've got no idea. To my mind, the best strategy here will be to buy on trend support, then transfer the stop loss at your entry point and sell o local hikes.
Stay tuned for the next report! 🔔

BRENT CRUDE OIL FORMED A BEARISH WEDGE. ANOTHER POSSIBLE DECLINEBRENT CRUDE OIL FORMED A BEARISH WEDGE. ANOTHER POSSIBLE DECLINE?📉
USOIL has been trading bullish within the last couple of days, supported by prospects of tighter supply and an improved demand outlook. US crude inventories dropped last week, which indicates firm demand despite the rising output.
Still, technically, oil looks bearish. It has formed a bearish wedge and is currently testing the former trendline from below. The most probable scenario is that wee see the bearish impulse towards 6,500.00 with further decline. Another option is that the rise will continue towards 6,900.00 level.

EURAUD → Correction for accumulation before growthFX:EURAUD reaches the zone of interest during a correction and forms a false breakdown of local support. Traders can switch to the buy side to support the trend.
Against the backdrop of a global bullish trend and a correction in the euro, the currency pair is following this movement, the essence of which is to consolidate funds for further growth. Liquidation is forming in relation to the liquidity zones of 1.785, 1.78, and 1.773, and the market imbalance is changing. The current movement is bringing the price to the zone of interest: the liquidity area of 1.773 and the order block. The capture of liquidity relative to 1.773 leads to the formation of a false breakdown and a pullback to the area of interest for buyers. Accordingly, price consolidation above 1.776 and 0.7 Fibonacci could support the main trend and allow the price to strengthen.
Support levels: 1.776, 1.773, 1.763
Resistance levels: 1.786, 1.795
The euro clearly demonstrates an upward trend, the structure of which has not been broken during the correction. Correction is a perfectly healthy movement within a trend, allowing positions to be opened at more favorable prices. If the bulls hold their defense above 1.776, momentum towards the specified targets may form.
Best regards, R. Linda!
