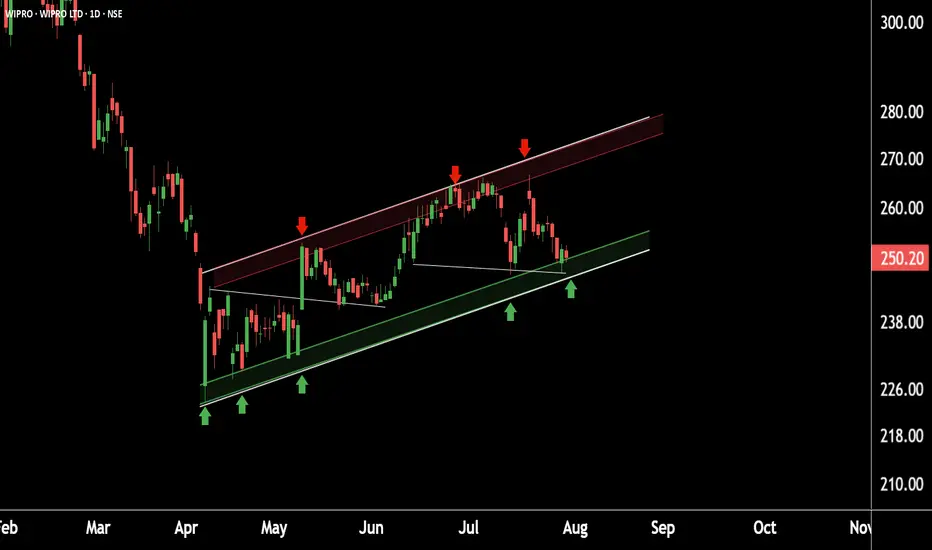
Wipro Near Crucial Support – Smart Money Watching Closely This is daily timeframe chart of Wipro.
Wipro is moving in well defined parallel channel with support zone near at 240 range.
If Wipro is sustain this level , then we may see higher prices in Wipro.
Thank You !!
Parallelchannels
Bitcoin New Support at 100,000Bitcoin’s trend has been growing from strength to strength — and it’s likely to stay that way. Why?
This trend isn’t driven purely by speculation; it’s supported by strong fundamental reasons.
One of the most widely debated topics in finance today is the comparison between Bitcoin and gold. While both are viewed as stores of value, their long-term roles may diverge significantly.
Yes, gold and bitcoin have been moving up in near perfect synchronization with inflation.
Gold is traditionally seen as an inflation hedge, and since June 2022 — when inflation peaked at 9% — we’ve seen both gold and Bitcoin trend higher up to the present day.
Instead of asking why the Fed isn’t cutting interest rates despite the decline in CPI, perhaps we should ask: why the Fed prefers to maintain rates at the current level. What are they seeing with the data and the developments?
When both gold and Bitcoin hold steady at these elevated levels, it suggests that investors still believe the threat of rising inflation remains valid.
In all bull markets, the path is never straightforward — it’s often jagged along with volatility.
What distinguishes a continuing bull market - is the formation of higher lows along its timeline.
However, like gold which we recently discussed, Bitcoin may be approaching a medium-term resistance.
In this first week of this year tutorial, we observed an inverted hammer in the last month of 2024, suggesting a potential correction in Bitcoin, but yet seeing support at around 82,000 level.
As anticipated, the inverted hammer was followed by a correction here toward our support level at around 82,000, with some false breaks along. From that point, the market resumed its upward climb.
Now, it appears to be encountering resistance again.
Still, as long as the market continues to form higher lows, and the threat of rising inflation still remain, the bull trend should remain intact.
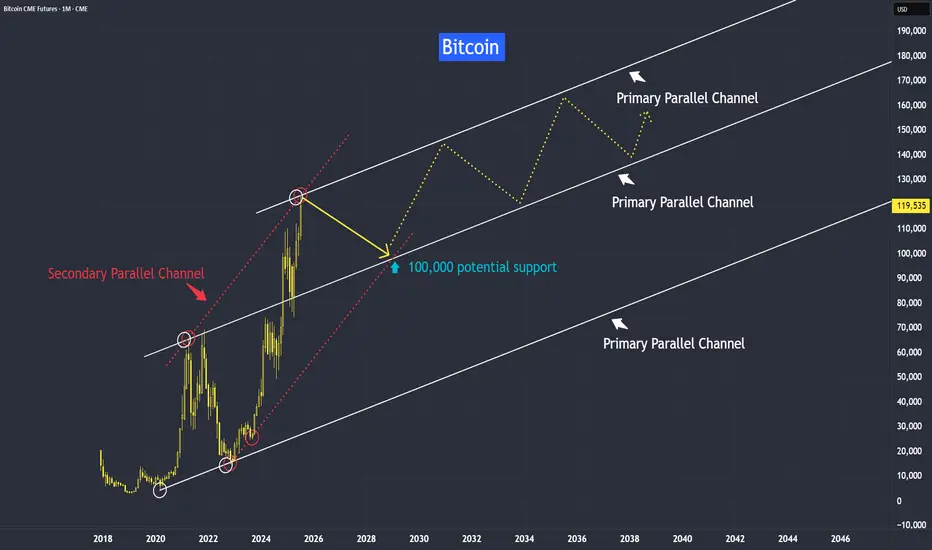
This is how the projection might look when mapped with a trendline.
We observed that the primary parallel trendline is reacting in relationship to each other. Next I would like to explore its secondary channel.
Please don’t interpret this as a literal path. Instead, I hope it serves as a guideline to help you form your own projections as the market evolves.
Gold is preferred by older generations, central banks, and conservative investors. Deeply entrenched in traditional finance and cultural value systems.
Cryptocurrency has a rapid adoption by younger investors, tech-native users, and institutions. Millennials and Gen Z are more likely to trust cryptographic assets than governments or fiat systems.
I will keep an open mind to both inflation hedge asset and their instruments.
Its video version for this tutorial:
Disclaimer This analysis is based on technical studies and does not constitute financial advice. Please consult your licensed broker before investing.
Mirco Bitcoin Futures and Options
Ticker: MBT
Minimum fluctuation:
$5.00 per bitcoin = $0.50 per contract
CME Real-time Market Data help identify trading set-ups in real-time and express my market views. If you have futures in your trading portfolio, you can check out on CME Group data plans available that suit your trading needs www.tradingview.com
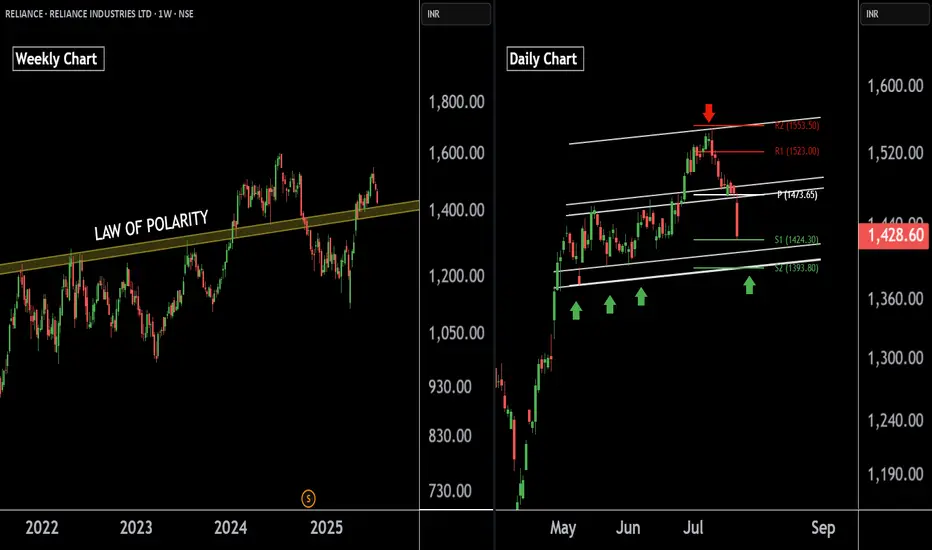
Reliance Industries — Preparing for the Next Bullish Leg !!There are two charts of Reliance Industries — one on the weekly timeframe and the other on the daily timeframe.
On the weekly timeframe:
Reliance industries is trading near (LOP), with a key support zone in the range of 1385–1400.
On the daily timeframe:
Reliance industries is moving in well defined parallel channel with support zone near at 1400-1410.the stock is also taking support at pivot levels S1 and S2, positioned between 1393 and 1422 levels.
If this level is sustain then we may see higher prices in Reliance industries.
Thank You !!
Exide Industries Ready for the Next Bull Run !! Powering Up !!there are two chart of Exide Industries.
In a first chart: EXIDEIND is moving in a well defined parallel channel and currently trading near at support 365-375 range
In the second chart,EXIDEIND is respecting support at both the monthly pivot and the supertrend indicator, with the support zone positioned between ₹365-₹370.
EXIDEIND is currently sustaining below both the monthly and weekly pivot levels at ₹290. As long as the stock does not break above this pivot zone, the momentum is expected to remain weak.
If this level is suatin then ,we may see higher prices in EXIDEIND.
Thank you !!

GBPAUD Weekly Trade Setup–Parallel Channel Breakdown Opportunity1. Overview of GBPAUD Technical Setup
As of 15th July 2025, the GBPAUD 4-hour chart reflects a price currently positioned at a critical support level around 2.0470–2.0480, which has held multiple times since early April. The price action leading to this point has formed a classic descending parallel channel, with price making lower highs and testing horizontal support with increased frequency.
Key observations:
Price is well below the 200 EMA (currently around 2.0794), confirming a bearish long-term bias.
The resistance zone at 2.1070–2.1120 has proven strong over time, pushing back multiple rallies.
Price is compressing — getting squeezed into the lower boundary of the channel with shorter pullbacks, often a precursor to breakout.
The setup is aligning for a high-probability short trade, with a potential move toward the next major demand zone around 2.0100.
The Breakdown Thesis – What We See on the Chart
The current structure of GBPAUD tells a very clear story:
After a rally in early April, price has been trading within a consolidation range, failing to make higher highs.
The support around 2.0470 has now been tested repeatedly with lower bounces each time.
Price recently made a lower high and returned to support with momentum, increasing the probability of a breakdown.
We are expecting a bearish breakout of this support level, followed by a re-test of the broken zone, and then a strong downside continuation.
Risk Management Strategy
Every trade setup — no matter how technically perfect — must begin with a strong risk management plan.
For this GBPAUD setup:
Entry Trigger: Breakdown below 2.0470 and successful re-test rejection with bearish candle confirmation
Stop Loss: Above re-test high; ideally, just above 2.0530 (~66 pips risk)
Target 1: 2.0300 (170+ pips)
Target 2: 2.0200
Target 3 / Final: 2.0100 (potential 370+ pip move)
This gives us an excellent Risk:Reward ratio of ~1:5 or more, allowing traders to be wrong several times and still remain profitable over time.
Opportunities in the market don’t come from guessing — they come from waiting. The GBPAUD parallel channel setup is a brilliant example of structure-based trading that combines logic with discipline. Whether you're a full-time FX trader or a part-time swing participant, setups like these are where consistency is built.
Watch the breakdown. Wait for the re-test. Execute only when the market confirms your plan.
Happy Trading!
=================================================================
Disclosure: I am part of Trade Nation's Influencer program and receive a monthly fee for using their TradingView charts in my analysis.
=================================================================

Bitcoin – Rising channel with critical support at $119.000!The chart presented shows Bitcoin in a well-defined rising channel, highlighting a strong bullish momentum over recent trading sessions.
Rising channel
The price action is currently oscillating within the boundaries of this upward sloping channel, marked by parallel trendlines. The channel suggests that Bitcoin has been consistently making higher highs and higher lows, with the current price hovering around $121,794. The upper boundary near $123,200 acts as potential resistance, while the lower boundary of the channel provides dynamic support, suggesting a continuation pattern if this structure holds.
Uptrend
The overall uptrend is clearly visible and remains strong, especially since July 10th, where a significant bullish breakout occurred. The breakout was followed by steady gains, with minimal pullbacks, indicating strong buying interest and market confidence. The momentum shows a healthy bullish structure with minimal price overlap, characteristic of a trending market, which favors continuation as long as critical support levels remain intact.
Support area
A critical element in this chart is the key support area, highlighted in green. This support zone is located between approximately $118,500 and $119,600. This zone was previously a resistance level that has now turned into support following the breakout. It also aligns with the mid-level of the rising channel, reinforcing its significance. Should the price retrace, this area is likely to act as a cushion where buyers may step in again to defend the trend.
Fibonacci
Additionally, the chart features a Fibonacci retracement drawn from the swing low to the current swing high. The 0.618 Fibonacci level is particularly noteworthy, sitting at around $119,623. This level is known as the “golden ratio” in technical analysis and often acts as a strong retracement level during corrections. Below it, the 1.0 level is marked at $116,669, which represents a full retracement of the move and a deeper correction scenario if the support fails. These Fibonacci levels coincide with the key support zone, further validating it as an area of high confluence and likely buying interest.
Final thoughts
Overall, the technical structure remains bullish within the rising channel, with key levels of interest lying around $119,600 for support and $123,200 for potential resistance. A successful defense of the support area could propel the price higher toward the channel’s upper bound, while a breakdown may lead to a test of deeper Fibonacci retracement levels.
Disclosure: I am part of Trade Nation's Influencer program and receive a monthly fee for using their TradingView charts in my analysis.
Thanks for your support. If you enjoyed this analysis, make sure to follow me so you don't miss the next one. And if you found it helpful, feel free to drop a like and leave a comment, I’d love to hear your thoughts!

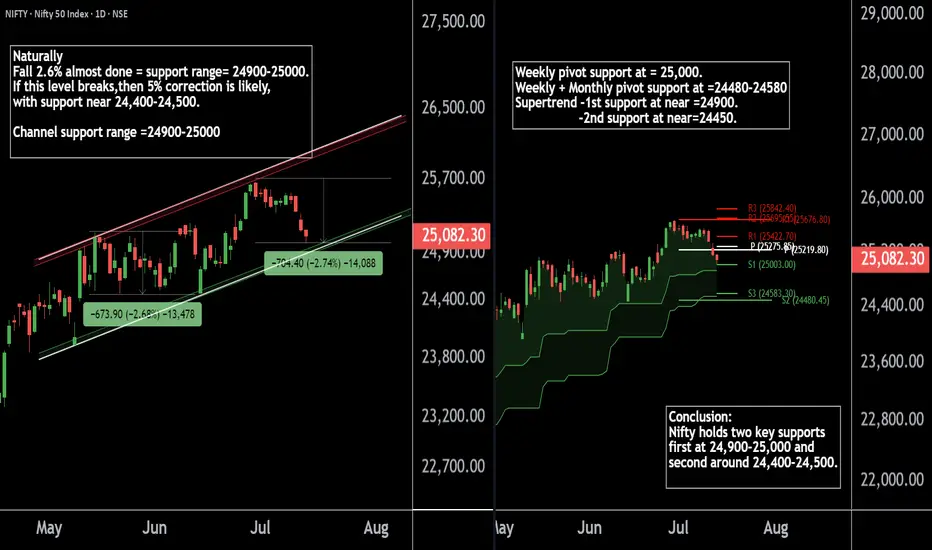
Nifty50's Key Level !! Keep an eye on these levels.Here are two Nifty charts, both on the daily timeframe.
Current Correction:
Nifty has naturally corrected by 2.7%, currently trading in the 24,900-25,000 range.
Weekly Pivot:
The weekly pivot support is positioned at 25,000, providing immediate support.
Support Levels:
First Support: 24,900-25,000 zone.
Second Support: If this level breaks, Nifty may see a 5% correction, with the next support around 24,400-24,500.
If this level sustain we may see higher prices in Nifty 50.
Thank You !!
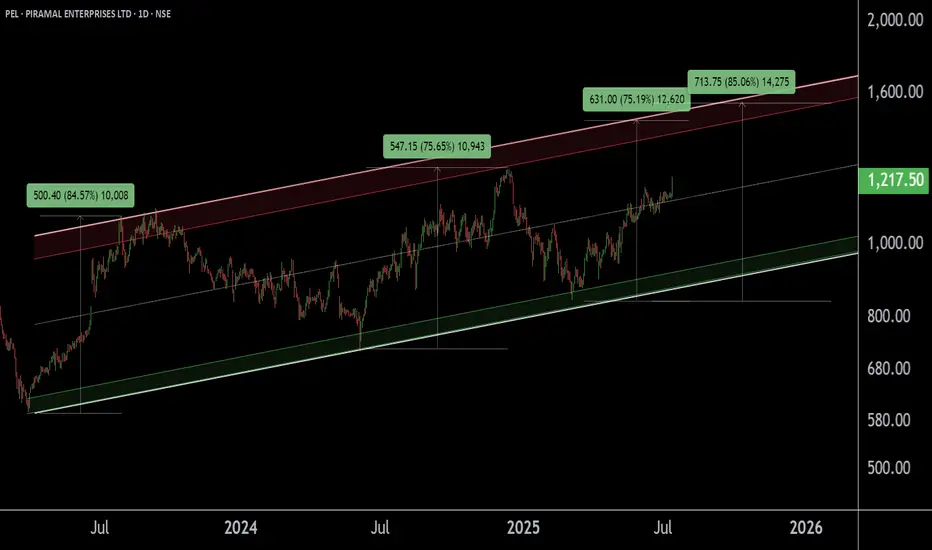
PEL !! PIRAMAL ENTERPRISES LTD appear to be in a Breakout phase This is the Daily Chart of PIRAMAL ENTERPRISES LTD.
PEL is trading above the midline of its ascending parallel channel, with strong support in the ₹1080–₹1150 zone. Historically, whenever it sustains above the midline, it tends to retest the upper boundary resistance of the channel near at 1500 -1540.
If this level is sustain then we may see higher prices in PEL.
Thank You !!
AXIS BANK at Best Support !!This is the 1 hour chart of AXIS BANK .
Axis bank having a good law of polarity at 1200 level.
Axisbank is moving in well defined parallel channel with support range 1160-1180 .
If this level is sustain , then we may see higher prices in AXISBANK.

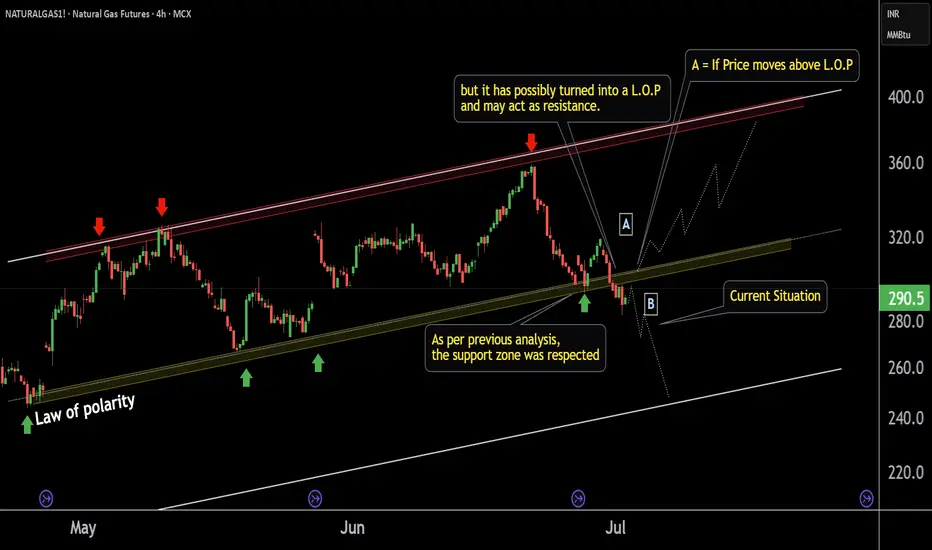
NATURALGAS1! Short time Breadkdown Alert !!This is the 4 hour chart of Natural Gas Futures.
NATURALGAS1 has given a short-term channel breakdown; the previous support may now possibly act as resistance at 300 level.
The breakdown target is the lower boundary of the broader channel, which may now act as support near at 240 level.
If lop is sustain then we may see lower prices in NATURALGAS1.
Thank You !!
NIFTY at Best Resistance !!This is the 1 hour Chart of NIFTY 50.
NIFTY 50 is trading near it's Resistance zone at 24400 range.
NIFTY 50 is forming a broadening pattern; resistance lies near 24,500.
Nifty 50 is forming parallel channel inside the pattern ; resistance lies near 24350.
If this level is sustain, then we may see Lower prices in Nifty 50.
Thank You !!

US100 – Eyes on $22,040 as bulls take chargeIntroduction
The US100 is currently showing signs of a bullish breakout, moving above the boundaries of a previously established parallel channel. It is now approaching an important area of imbalance, known as a Fair Value Gap (FVG), on the 4-hour chart. If the index manages to break through this zone, there is a strong potential for continued upward momentum. Let’s take a closer look at the technical setup and what might come next.
Parallel Channel
For some time, the US100 had been trading within a downward-sloping parallel channel, consistently making lower highs and lower lows. However, today's price action has changed that narrative. The index has broken out of the channel to the upside and is currently pushing towards new short-term highs, which could mark the beginning of a bullish trend reversal.
4-Hour Fair Value Gap (FVG)
The current focus is on an open 4-hour FVG that ranges from approximately 21,840 to 21,870. This zone could serve as a significant resistance level, potentially rejecting further upward movement. However, if the US100 breaks decisively above this range, it could open the door for a rapid push toward previous highs. Such a move would signal strong bullish momentum and confirm the breakout as legitimate.
Possibility of a False Breakout
There is always the risk that this breakout could turn out to be a false move. If the US100 fails to hold above the 4-hour FVG and reverses back below the channel breakout point, it could indicate a bull trap. In that case, the index may resume its downward trend. Still, based on the current momentum and market structure, this scenario seems less likely at the moment.
Upside Target
If the breakout above the FVG is successful, the next significant target lies at the recent highs near 22,040. This level is expected to act as strong resistance. Should the US100 manage to break through it, we could see a test of the all-time high in the near future. However, it’s important to approach the market with patience and let each level confirm itself before expecting further upside.
Conclusion
While the US100 has successfully broken out of its parallel channel, it is now facing a key test at the 4-hour FVG. A clean break above this zone would likely shift market sentiment to bullish and set the stage for a move toward 22,040 and potentially beyond. Until then, traders should watch closely for confirmation and be mindful of the possibility of a pullback.
Disclosure: I am part of Trade Nation's Influencer program and receive a monthly fee for using their TradingView charts in my analysis.
Thanks for your support.
- Make sure to follow me so you don't miss out on the next analysis!
- Drop a like and leave a comment!

US100 - Trading within a bearish parallel channel!Introduction
The US100 is currently trading within a well-defined parallel channel to the downside, consistently finding support along the lower trendline and facing resistance near the upper boundary. This structure has led to a clear pattern of lower lows and lower highs on the 1H timeframe. Most recently, price action broke market structure, and we now anticipate a reaction near a high-confluence resistance area.
Parallel Channel
A distinct parallel channel has been developing on the US100 over the past several days on the 1H timeframe. During last night's move, the price touched the lower boundary of the channel and has been trending upward since. After breaking above the midline at $21,640, momentum suggests a potential continuation toward the upper boundary of the channel around $21,830.
FVG
During the most recent downward move, the US100 created a significant 1H Fair Value Gap (FVG), stretching from $21,775 to $21,840. This zone represents a key imbalance that could generate a strong reaction to the downside if price revisits it.
Conclusion
Given the break in structure on the 1H timeframe, short-term upward moves are likely to face resistance. The confluence between the upper boundary of the parallel channel and the 1H FVG creates a high-probability area for price rejection, making it a critical level to watch for potential downside pressure.
Disclosure: I am part of Trade Nation's Influencer program and receive a monthly fee for using their TradingView charts in my analysis.
Thanks for your support.
- Make sure to follow me so you don't miss out on the next analysis!
- Drop a like and leave a comment!

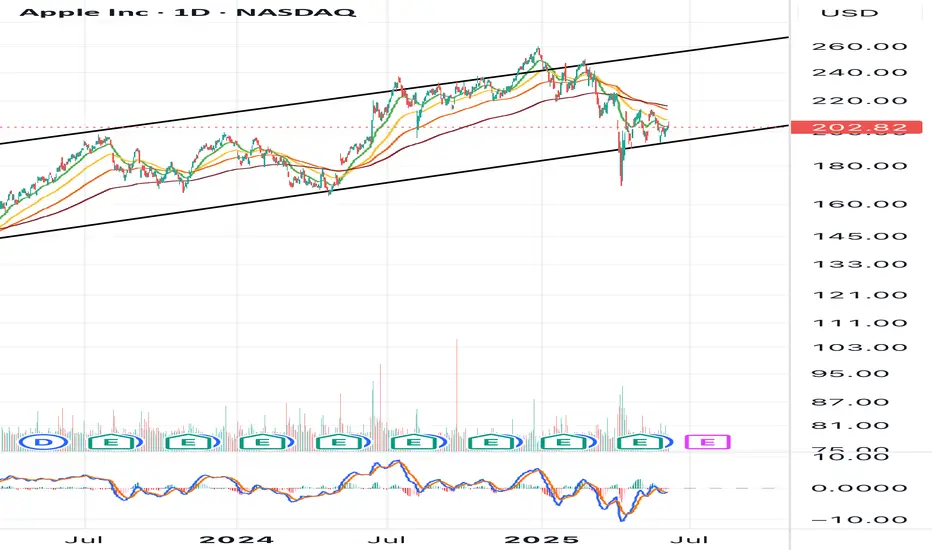
AAPL Ascending Price ChannelAAPL has been in ascending price channel since August 2020. At the start of April we saw a retest of support where it temporarily broke through, tested the 200 ema, bounced, then broke back above the previous support line. Since then it has retested support 3 separate times which is a strong indication that AAPL will continue to remain in this price channel for the foreseeable future.
NZDCHF - Bullish - BUYCALL BULLISH INDICATIONS:
1- Market currently in consolidation phase with in a down channel
2- market has bounced back from good support level
3- if the market break the last LH / neckline, we can enter into the market with
a TP of R:R of 1:1 and the Stoploss slightly below the LL or the Support level.

CHANNAL PATTERN - KAJARIACERTechnical Analysis:
Current Price: ₹1,003.9
Target: ₹4,000. This is a very ambitious long-term target, implying a substantial increase.
"History Repeat Based": Identified a historical pattern that, if repeated, could lead to such a significant price move.
Time Frame: 1 Year to 3 Year (indicates a long-term investment horizon for the target).
Trendline Support and Parallel Channel Pattern: These are bullish technical indicators. Trendline support suggests that the stock is finding buyers at a certain level, preventing further declines. A parallel channel typically indicates a sustained trend within defined upper and lower boundaries; a breakout from such a channel can signify an acceleration of the trend.
Fundamental Analysis :
Market Cap: ₹15,984 Cr.
Current Price: ₹1,004
Stock P/E: 46.8 (Higher than the Industry P/E, indicating a premium valuation)
Key Fundamental Observations:
Valuation Premium: Kajaria Ceramics trades at a P/E of 46.8, which is higher than the industry P/E of 40.2. It is also significantly above its intrinsic value and Graham Number. This suggests the market is pricing in substantial future growth or recognizing its brand strength/market position.
Declining Profitability: The negative profit growth of -17.9% and the decline in EPS from the preceding year (₹26.5 down to ₹18.5) and also from the previous quarter (₹4.88 down to ₹2.67) are significant concerns. This indicates a recent slowdown or reversal in earnings.
Strong Financial Health: Very low Debt to Equity (0.10) is a positive sign of strong balance sheet management. ROCE (16.8%) and ROE (12.8%) are decent, but could be better given the high valuation.
Shareholding Pattern:
Promoters: Stable around 47.49% as of Mar 2025.
FIIs: Have decreased their stake from 23.38% (Mar 2017) to 15.79% (Mar 2025), with some fluctuations.
DIIs: Have consistently increased their stake from 5.76% (Mar 2017) to 27.68% (Mar 2025). This strong DII buying is a positive sign.
Public: Decreased from 23.47% (Mar 2017) to 9.06% (Mar 2025).
No. of Shareholders: Increased from 37,855 (Mar 2017) to 89,567 (Mar 2025), indicating increasing retail participation.
Balance Sheet:
Consistent Growth: Total Assets have steadily increased from ₹1,176 Cr (Mar 2014) to ₹3,756 Cr (Mar 2025). Total Liabilities have also grown but seem managed.
Reserves: Growing steadily from ₹514 Cr (Mar 2014) to ₹2,728 Cr (Mar 2025), indicating reinvested profits.
Borrowings: Have fluctuated but remained relatively low compared to overall size, reaching ₹274 Cr in Mar 2025.
Corporate Action & Latest News:
Recent news would primarily focus on the company's latest quarterly results (which, as per your data, show a decline in EPS and profit growth).
Any announcements regarding capacity expansion, new product launches, or market share gains would be relevant.
Given its position in the building materials sector, news on real estate demand, construction activity, and government infrastructure spending would impact its outlook.
Overall Assessment:
Technical analysis of Trendline Support and Parallel Channel Pattern suggests a bullish outlook for Kajaria Ceramics. However, the fundamental picture shows some conflicting signals:
Positive: Strong balance sheet with low debt, increasing DII participation, growing shareholder base, and a history of growth in assets/reserves.
Negative: High valuation (P/E above industry, above intrinsic value), and importantly, a significant negative trend in profit growth and EPS (both year-on-year and sequentially in the latest quarter).
Target of ₹4000 (1-3 years): This is an extremely ambitious target, requiring a nearly 4x increase from the current price. While "history repeat" can be a valid technical argument, it would require a significant turnaround in the company's profitability to fundamentally support such a valuation in the long term, especially given the current negative profit growth.
Conclusion:
While the technical patterns you've identified could indicate short to medium-term upward movement, the long-term target of ₹4000 seems very aggressive given the recent fundamental trends of declining profit and EPS. For such a target to be plausible, Kajaria Ceramics would need to demonstrate a strong and sustained turnaround in its earnings performance in the coming quarters/years.
Considerations:
Confirm Technical's: Ensure the trendline support and parallel channel patterns are clearly established and holding on the chart.
Monitor Fundamentals Closely: Pay very close attention to upcoming quarterly results. A reversal of the negative profit growth trend is essential to support higher valuations.
Risk vs. Reward: Evaluate the risk involved, especially with a stock trading at a premium valuation while showing declining profitability.

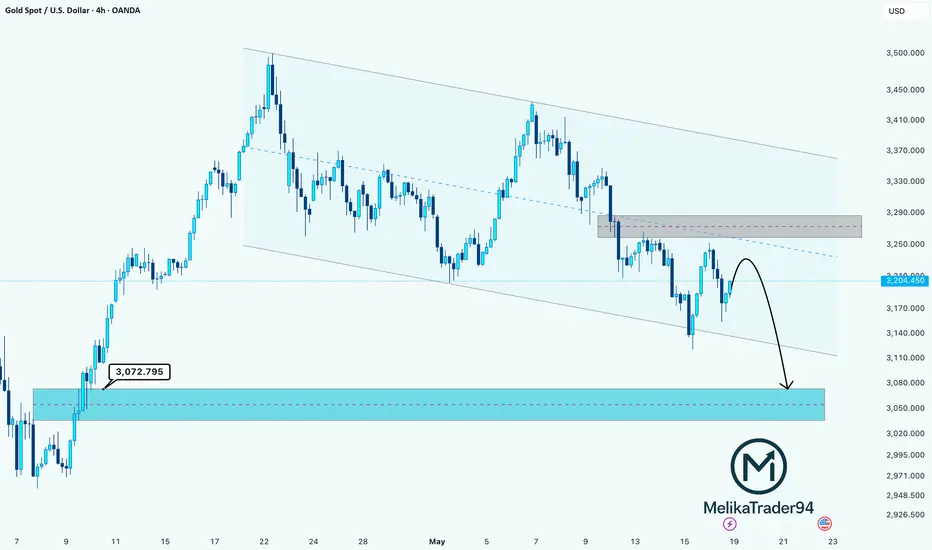
GOLD (XAU/USD) Bearish Play Setting UpHello guys!
Gold is currently respecting a bearish descending channel, forming clean lower highs and lows. After tapping into the supply zone around 3,285–3,295, the price is showing signs of exhaustion.
Now, a potential rejection from this zone could trigger another leg down targeting the demand zone around 3,060–3,080.
🧠 What I see:
🔹 Bearish channel = trending lower
🔹 Clean retest of supply block
🔹 Price respecting midline resistance
🔹 Momentum favors sellers
🎯 Bearish Trade Idea (Not financial advice):
Entry zone: 3,240–3,260 (on confirmation candle)
TP1: 3,110
TP2: 3,072 (demand zone)
📐 Risk/Reward: 1:2+ potential
💡 Watch for confirmation candlesticks near the supply zone for safer entries.
Monthly Closing above 7.50 - 7.60 will be very healthy!
Monthly Closing above 7.50 - 7.60
would be a very healthy sign.
We may then easily witness upside
towards 8.70 - 9.10 & then 10.50 - 11
Remember it is in a long consolidation
with Slowly moving in an Upward Channel.

AUD/USD On the weekly timeframe, AUD/USD approached a previously tested resistance zone around 0.63926, marked by prior price interactions. On the 1-hour chart, the price broke out above this level, signaling bullish momentum. On the 15-minute chart, a backtest of the breakout level occurred, with the price retesting the 0.63926 zone, now acting as support, before continuing upward.
Trade Plan:
Entry: Entered a buy trade at 0.64072 after the backtest confirmation.
Take Profit (TP): Targeting 0.64352, aligning with the next significant resistance level.
Stop Loss (SL): Placed at 0.63926, just below the breakout level, to protect against a false breakout.
Risk-Reward Ratio (RR): The distance to TP is 280 pips (0.64352 - 0.64072), and the distance to SL is 146 pips (0.64072 - 0.63926), yielding an RR of approximately 1:1.9.
This AUD/USD trade capitalizes on a breakout and backtest strategy, offering a structured setup with a favorable risk-reward ratio for potential upside.

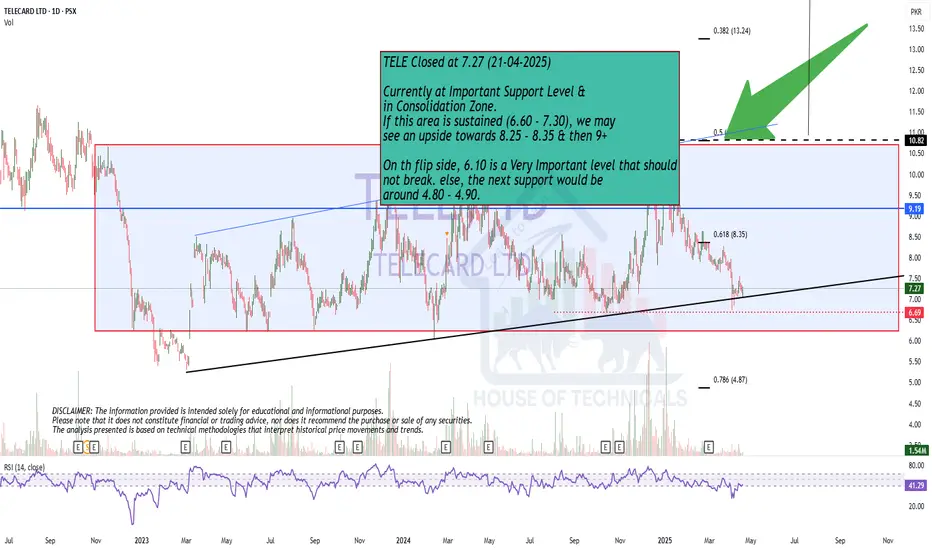
Currently at Important Support Level..
Currently at Important Support Level &
in Consolidation Zone.
If this area is sustained (6.60 - 7.30), we may
see an upside towards 8.25 - 8.35 & then 9+
On th flip side, 6.10 is a Very Important level that should
not break. else, the next support would be
around 4.80 - 4.90.
Breakout from a Parallel Channel.
Breakout from a Parallel Channel.
Monthly Closing above 20.20 - 20.30
would be a positive sign.
Re-tested the Breakout leve around 21.20
Stoploss as of now should be 20.20 with
Buy on Dips Strategy.

parallel channel vs goldgold price went up in last march month
but rising price has made a clear parallel channel on h4 chart
price testing upper line and get intraday rejection instantly. if price start correction then lower line of the channel will be next big dynamic support level

Trading in a Parallel Channel on Monthly TF.Trading in a Parallel Channel on Monthly TF.
Strong Support around 49 - 50 & then 54.
However, 53.20 if SUstained on Weekly
basis, may give further upside around 57 - 58
To be in Uptrend, it should cross 61 - 62. &
Don't Forget the Channel Top is around 75 - 77
On the flip side, 46 is the last level that should
not break.
