BITCOIN out of parallel channel retest and more gain 📖🚀Hello 🐋
we expected the retest of the support zone (parallel channel support) to be completed ✔️
if
the price doesn't break the support zone to the downside and just complete the retest, we will see more gain, at least to our upper trend line 💣🚀
otherwise
we can see more correction to lower support level ❌🧨
if
breakout of the upper resistance zone be completed, we can see more pump to the upside ✔️🚀
besides
brief amount of red candlesticks to the downside before any other movement is logical 📖💡
👌 Notice: pay attention to the price on shortcut chart (located above the main chart with black colour) 📖💡
Please, feel free to share your point of view, write it in the comments below, thanks 🐋
Parallelchannels

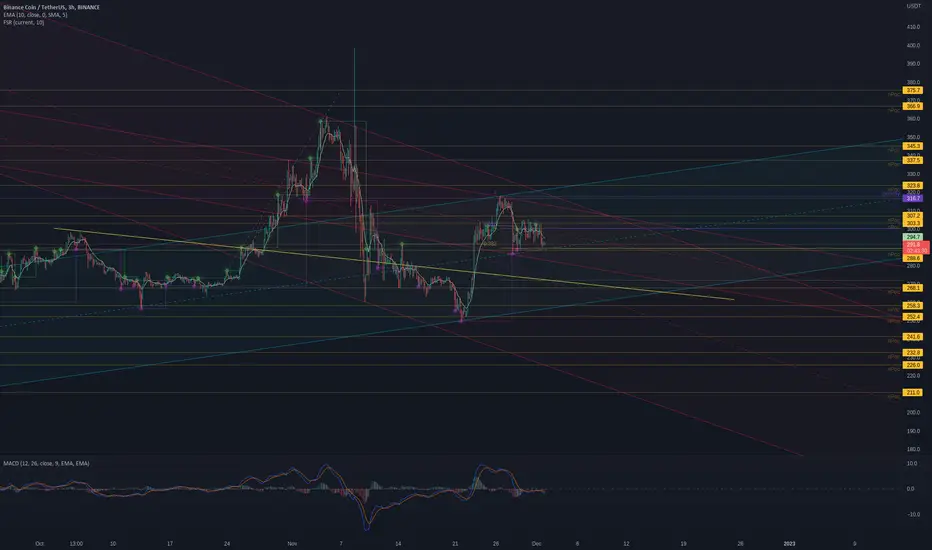
BNBUSDT - Parallel Channels, Poc, and Support/Resistance levelsMultiple channels, naked point of control (courtesy of Exocharts), incl. support and resistance levels. Keep an out on BTCBNB chart - it's a key indicator as is ETHBTC, BNBBTC, all BTC pairs. Dont forget the Dollar Index :) Fun .. Live to eat or eat to live? Love the game! :p
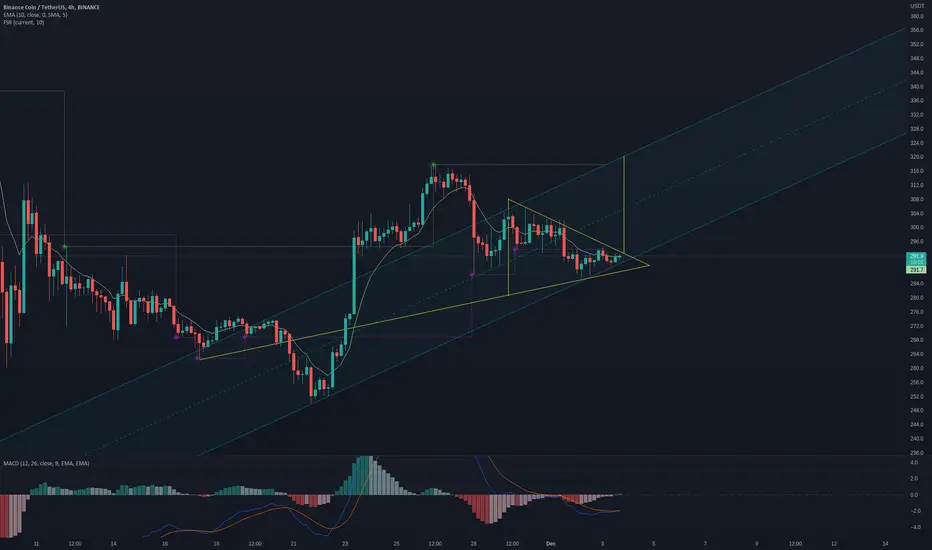
BNBUSDT - Triangle and ChannelNice formation and possible breakout BNBUSDT with confluence of ascending parallel channel.
TRBUSDT - Trend and Analysis Inspired technical s from a followee. Risky asset, assets have to start somewhere. 24 hour volume 23.22M (low - by that prefer something over 700M). Market cap (low - 33M). Trade with caution. Make sure that you learn from anything you do. Next time Crush It!
Timely support on Monthlies seem difficult to find and draw. Because of this, concluding choppy and unproductive, and therefore risky. Having said that, zooming in on Weekly and Daily time frames seem to be more accurate. The latter daily more so.
Price levels with what I think are support/resistance levels on left against Tether. On the Right (what Token is this again?), TRB/BTC.. Using FSR (Fractiles Support and Resistance - Indicator on Daily), any Green and any Red a support and resistance, may be an indicator for a breakout or breakdown.
OBV looks good and consistent.
Be nice to get some fibs on this and possibly a fib channel. Someone?

4H Analysis on AUDJPYHello traders. On this 4H analysis of AUDJPY, we have an ascending channel setup. Price has just recently tested the 90.500 support region in the channel, providing us with a good entry point. We now await a good entry reason. A good place where price may go next would be to the resistance level in the 93.000 region.

Expanding Diagonal Scenario
Overall, everything is going along with our predictions.
BTC formed a bearish Seahorse , metamorphosing into a bearish Dragon , substantially achieving its target, and then testing one of the parallel channels effective for months.
I presented the idea of forming a triple zigzag with a pitchfork, but the chart also seems different.
If this 21400 level holds, the chart could form an expanding diagonal with the help of a harmonic bullish deep crab (green), up to approx. 22800 area, where the H & S's neckline zone, the pitchfork's Fib 2 level, and the 4H Ichimoku cloud are present.
Suppose the new high fails to establish there. In that case, point (D) will be the final pivot of the expanding diagonal triangle into the 20500-20700 zone, where there is a confluence of many S&R elements (daily cloud, parallel channel, pitchfork, H&S' s Fib 1.618, and significant volume zone).

Potential double or triple zigzag
BTC got rejected at 4H Ichimoku cloud, and the bearish dragon pattern is still valid. With its cleanest theoretical target being a .786 retracement of XC, the prescribed bearish movement is likely if the price fails to mark a new high.
Considering parallel channels serving as S & R for months, a WXY formation (double zigzag) would be a candidate movement.
Even a WXYXZ move (triple zigzag) could be possible if an H&S pattern forms.

S&P 500 Range Short and Long TermRed short term green long term range with Fibs and Fib Resistance Fan. Bottom and support below the ranges. On the basis of my current knowledge. Bias on sideways price action, and potential bullish. Not accounting for down trending price movement. 0.75 Fan a support.

JSWSTEELJswsteel broke out of descending channel on 30 min TF with good volumes.
Could be bought with mnetioned stoploss & target.

DOUBLE BOTTOM PATTERN FORMINGDouble Bottom Pattern is Signaling a Buy on Hydra!
The Double Bottom is also called the BIG WINNER, because it forms a W on the chart.
I expect HYDRA CHAIN (on the 1 Day Chart), to continue bullish until we reach top of the parallel channel before breaking out to resistance at $3.60+.
One Key Target area to watch as we approach the neckline & top of parallel channel @ $3.20, we must close candle above $3.20 to signal a breakout.
When this happens, we will surely have a retest of $3.60 before continuing with higher highs.
FUN FACT:
HYDRA also has a 40% Staking Incentive that is hard to pass up that will compound daily when you reinvest your staking rewards. That is 0.1% in Hydra/day & Compounded Daily. As a traded security, you have the amazing potential of having those percentages exponentially increased.
KEY TAKEAWAYS:
>The double bottom looks like the letter "W". The twice-touched low is considered a support level.
>The double bottom pattern always follows a major or minor downtrend in a particular security, and signals the reversal and the beginning of a potential uptrend.
Remember to DYOR and Happy Trading!

ETHEREUM close to the channel resistance 🚀Hello 🐋
as I mentioned,
in my previous analysis, the price hit the target
and now
Based on the chart, the price is close to the green trend line and the support zone ✔️📖
we can see more gain 🚀🚀
otherwise
we can see more correction to lower support level ❌🧨
👌 Notice: pay attention to the price on shortcut chart (located above the main chart with black colour) 📖💡
Please, feel free to share your point of view, write it in the comments below, thanks 🐋

BITCOIN out of ascending channel retest and more gain 📖🚀Hello 🐋
Based on the chart, the price is close to the channel support area and break out of the ascending channel , and we expected the retest to be completed ✔️
if
the price doesn't break the support zone to the downside and just complete the retest, we will see more gain, at least to our upper trend line 💣🚀
otherwise
we can see more correction to lower support level ❌🧨
if
breakout of the upper resistance zone be completed, we can see more pump to the upside ✔️🚀
👌 Notice: pay attention to the price on shortcut chart (located above the main chart with black colour) 📖💡
Please, feel free to share your point of view, write it in the comments below, thanks 🐋

GHSTUSD - Significant Breakout of ChannelAs yuo can clearly see, GHST has been ranging this descending paralled channel for well over a year now, top to bottom and back again! Just recently however, something different has happened..
We've had a significant breakout from this channel to the topside and now we've got a massive green bar indicating the potential for a bullish market starting.
There's a few layers of resistance above the current price, around 10%, 20% and 30% up. Which one are we targeting? We'd like to keep Trailing Stops reasonably tight on this and tick each target off as we get there!
If you enjoyed or agree with this idea - drop us a comment, like & follow! :)

BITCOIN breakout of the parallel channel to the upside 📖🚀Jan 29
Hello 🐋
Based on the chart, the price is close to the channel support area and break out of the descending channel, and we expected the retest to be completed ✔️
if
the price doesn't break the support zone to the downside and just complete the retest, we will see more gain, at least to our upper trend line 💣🚀
otherwise
we can see more correction to lower support level ❌🧨
if
breakout of the upper resistance zone be completed, we can see more pump to the upside ✔️🚀
👌 Notice: pay attention to the price on shortcut chart (located above the main chart with black colour) 📖💡
Please, feel free to share your point of view, write it in the comments below, thanks 🐋

GALA analysis ...Hello guys...
As you have seen over the past few weeks, the cryptocurrency market has been very bearish and no signal has been observed to change the trend. I still encourage you to short position.
here we have #gala, this cryptocurrency formed in a bearish channel and in my opinion will break main lower low (main support level).
but be aware if this channel break up top line it will be bullish for a few weeks at least.
always do your own research.
If you have any questions, you can write it in comments below, and I will answer them.
And please don't forget to support this idea with your like and comment.

Optimism Blockchain Market Cap Evaluation 6% of ETH ATH MKT CAPOptimism Blockchain Market Cap Evaluation at $33 Billion if Linear Channel is respected.

BITCOIN close to the parallel channel retest and more gain 📖🚀Hello 🐋
Based on the chart, the price is close to the channel support area and break out of the parallel channel has completed, and we expected the retest to be completed ✔️
if
the price doesn't break the support zone to the downside and just complete the retest, we will see more gain, at least to our upper trend line 💣🚀
otherwise
we can see more correction to lower support level ❌🧨
👌 Notice: pay attention to the price on shortcut chart (located above the main chart with black colour) 📖💡
Please, feel free to share your point of view, write it in the comments below, thanks 🐋

BITCOIN close to the parallel channel retest and more gain 📖🚀Hello 🐋
Based on the chart, the price is close to the channel support area and break out of the parallel channel has completed, and we expected the retest to be completed ✔️
if
the price doesn't break the support zone to the downside and just complete the retest, we will see more gain, at least to our upper trend line 💣🚀
otherwise
we can see more correction to lower support level ❌🧨
👌 Notice: pay attention to the price on shortcut chart (located below the main chart with black colour) 📖💡
Please, feel free to share your point of view, write it in the comments below, thanks 🐋

BANK NIFTY ANALYSIS - 19/01/2023Buy Above - 42540
SL - 42480
Targets - 42600,42680,42760,42900
Sell Below - 42400
SL - 42480
Targets - 42320,42260,42180,42060
Expiry Day Range is 42000 to 42700

USDCAD; Bear Market; Descending Parallel ChannelsContinue to watch for short opportunities with USDCAD.

AUDCAD; Bull Market; Parallel ChannelAs long as AUDCAD is inside the recent parallel channel, AUDCAD market is bullish.

Bearish Divergence on SolUSDCOINBASE:SOLUSD
Bearish Divergence on 1H timeframe of COINBASE:SOLUSD suggests drop in price.
Further adding parallel channel enforces this idea; upper level prevails around 23.9-24.2, lower level around 22.6-22.4 is probable.
