USDJPYHello dear friends. I determined my analysis of these currency pairs along with the entry area, SL and TP1 and TP2 . Check it with your analysis.
Parallelchannels


ETC elliott waves #ETC/USDT
$ETC Elliott waves and descending parallel channel show this downtrend is going to end between $12 and $5.

ADA above last support zone#ADA/USDT
$ADA weekly chart shows price is above middle line of descending channel that is the same with long term support zone.
this support zone is between 1.272 and 1.414 fib level of last weekly swing high.
🐻 if price break down from 1.414 fib level it will continue its downtrend to lower line of channel that is the same with 1.618 fib level which is below $0😁!!
🐮 so price should hold this support and maybe in short term or mid term it has sideways moves to help bulls gather strength, and start a new rally in long term.

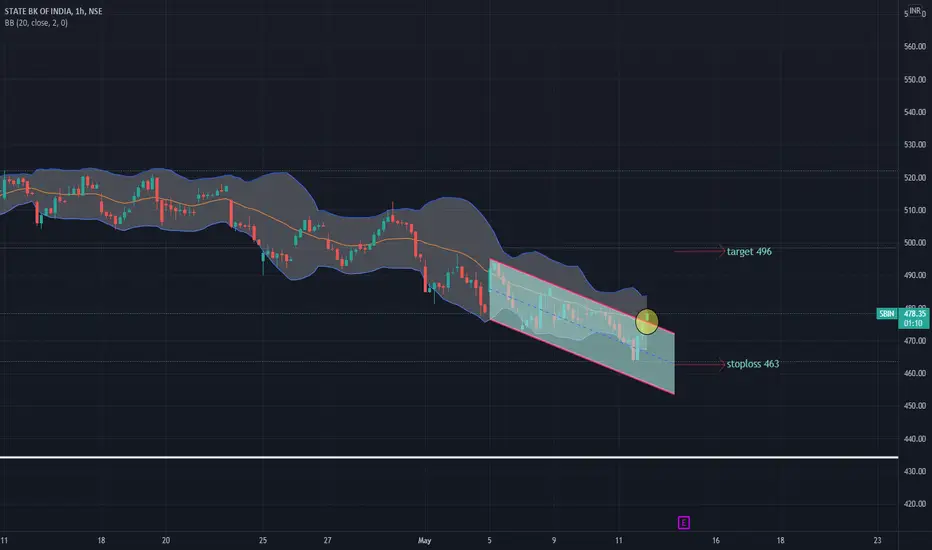
SBINSBIN broke out of parrallel channel on an hourly chart with very good volumes.
Could be bought with mentioned stop-loss & targets
[Bitcoin] Attempt to reboud at $29.8K, how far can it go?#Crack #Bitcoin #Binance #Daily
- Bitcoin is trying to rebound after falling to the $28.1k-$29.8k section, which was importantly mentioned after the last briefing.
- The green trend line connecting the low on January 4 and the low on June 22 also shows a rebound in the overlapping section and a signal of the possibility of a continued trend reversal in the RACD candle indicator, so if the 31k-31.6k resistance is broken, $35,071 and blue bullish channel lower resistance retest draws an bull trend.
- A break of $35k is important if a strong rebound occurs. Even after the breakout, the $35k support retest should be successful until the $37.8k-$39.4k resistance breakout, where the lower resistance of the bearish flag pattern is located.
- If the $28.1k-$29.8k support fails after the failure to break out the $31k-$31.6k resistance, as mentioned in the previous briefing, a decline to the $10k-$12k should also considered in the future scenario.

AUDUSD SELL!AUDUSD has been trading inside the given parallel channel since February 2021 . Recently, the price succeeded to break through a significant support 0.69865 , went back retested it and is now ready to move down all the way to a significant support on monthly Chart 0.68709, which would be my final Target . the downward move is further confirmed by the price trading below the 200 and 50 EMA !

ETH ab=cd to $1000#ETH/USDT
$ETH descending channel shows price is at middle zone.
🐮 holding this zone as support can increase price to upper line around $3k
🐻 but as we are in a sharp downtrend price can break down from this zone and drop more to lower line that is the same with 2 fib level and complete AB=CD pattern around $1000.

BTC sideway moves #BTC/USDT
$BTC touched the middle line of descending channel that is the same with ling term support zone and 1.272 fib level of last swing high.
Price may have sideways move between $28k and $37k for days to touch the upper line of channel.
🐮 then break out from upper line will increase price to resistance zone around $45k.
🐻 and rejection from upper line can drop price to middle line around $20k.

BTC ab=cd to 16k#BTC/USDT
$BTC is inside a descending parallel channel.
there is a support zone between $33k and $28800 that is the same with middle line of this channel, that bulls 🐮 need to hold to start a new rally.
🐻 break down from the middle line can drop price to lower line of channel and help to complete AB=CD pattern between $16k and $8k.

[Bitcoin] Fail to support the bull trend channel..#Crack #Bitcoin #Binance #Daily
- This is the appearance of Bitcoin's bearish breakout at the bottom of the blue large bull channel.
- It seemed to rebound while keeping the $35,071 closing support level, but it showed a bearish trend again the day before and eventually fell.
- In the event of a rebound, it is important to settle upwards of $35,071, and keep in mind that even after an upward stabilization, the bearish trend continues until it breaks above the $37,578 upwards.
- If an additional decline occurs, a decline to $31k-$31.6k can be expected, and if the support in the above section fails, it is likely to decline even to $28.1k-$29.8k, which provided strong support.
- If the $28.1k-$29.8k support fails, there is a possibility that a bearish departure of the bear flag pattern has appeared from the appearance since November, and there is a possibility that a gloomy period of falling to the simple target price of the pattern of $10k-$12.1k may appear.

!!! $BTC LOSING THE SUPPORT TRENDLINE! - CME GAP NEXT? !!!price action has been shit lately
bitcoin is losing the lower channel of the parallel channel it had been forming since the start of 2021 on the weekly timeframe, which has been a big support in the past weeks
if the breakout is confirmed and we close this 1W candle (only 8 hours to go) below that, I think we might see a bear market for the next few weeks
rsi is about 32 on the 1D timeframe and 38 on the 1W timeframe, which shows us we have a lot of room for a huge fall to the downside
I think the price is going to fill the CME gap @ 26K which I highlighted on the chart, it would be a huge drop, but I think that's what's going to happen since CME gap are almost always filled and this one has been waiting to get filled since December 2020
let me know what you think about this! and drop a like and follow if you enjoyed this idea or you found it helpful!

BTC UNSEEN DOWN CHANNEL 9 TEST PRICEBTC confirms and strongly tests this channel 9 Times from April 2021.
if breaks then look for the new bull session and if downward then wait for a squeeze of low channel squeeze or strong wick.
previous targets reached, check it out.
Feel Free to ask any questions.
Like and Follow for more sharpness
Thank you.

United States Oil Fund (USO) in bullish channelThe price has broken out of a long bearish channel (green color), and is now in a bullish channel (cyan color).
Within the long bearish channel, we can see a downward seasonality in the second half, in the months of July and October.
Will the cycle repeat itself in July or October of this year?

[Bitcoin] Is it finally rebound? But still be careful!#Crack #Bitcoin #Binance #Daily #briefing
- Bitcoin, which had been on a bull trend since the start of the daily candle the day before, showed an additional bull trend following the announcement that Powell's interest rate hike of 75bps was not considered and broke the $39.2k-$39.5k resistance.
- Further bull trend can be expected with a strong rebound at the bottom of the orange bull trend channel and the $37.7k support section, but I think it is too early to say that it has completely turned into a bullish trend as it failed to break out the resistance of $39,742, the closing price that was resisted during the previous movement.
- $39.2k-$39.5k support is important when the $39,742 resistance is failed, and if the support in the corresponding area fails, we can expect a further bearish trend to confirm the $38,525 support.
- If the $39.2k-$39.5k or $38,525 support is successful and rebounds, we can expect an upside to $41.5k-$41.9k in the short term and $43.9k-$44.5k in the long term.
- If a correction appears by $38,525 but support fails, consider the possibility of a $35k-$34.2k support confirmation.
- As mentioned above, as it failed to break out of the $39,742 resistance, there seems to be a risk in chasing after the previous day's bull trend.

DXY : weekly triple top !hi every one I think we are moving towards the formation of a flag , If resistance 94 is broken, 85 will be available

ADAADA (H1)
It is back to the daily support range and is in the descending channel at 1 hour time frame
It can rise from the midline and grow
Positive divergence from macd is evident in the 1-hour and 4-hour half-frames

[Bitcoin] Finally Rebounding!! Expectations are 43.9k-44.5k!!#Crack #Bitcoin #Binance #Daily
- It looks like a rebound is emerging from the $37k-$37.7k I mentioned over and over again.
- Bitcoin is showing a strong rebound since the low of $37,386 the day before, and seems to be trying to break out the resistance above the blue bearish wedge.
- A break of the $39.2k-$39.5k resistance seems important if the break above the blue bearish wedge. If that resistance is not broken, we should keep in mind the possibility of retest support at the intersection of the upper wedge, $37.7k and the lower orange bull trend channel.
- If the retest support is successful after being pressed, the three golden crosses of the RACD indicator will also serve as a strong bull trend. At this time, the long-term target price can be expected to rise to the resistance of $43.9k-$44.5k, which is the overlapping section of the orange bull trend centerline, the sky blue high-trend line and $43.9k.
- However, it is recommended to carefully examine the $41.5k-$41.9k resistor located before $43.9k-$44.5k.
- If the $37k-$37.7k support fails, $34.2k-$34.6k support is very important, and if the $34,322 low is renewed, the possibility of a big bear trend should be taken into account as the breakout of the lower blue long-term bull trend channel is possible.

FTM ANALYSISOn daily timeframe chart is forming a "descending parallel channel"
If the candle closes below the major support zone of $0.74 then price will reach the weekly support zone of $0.5.
Wait for breakout of the resistance trendline of the parallel channel or touch to weekly support zone to build a position.

AVAX going to the moon?I believe this is where AVAX is going and I see a new ATH not so far away from here... what are your thoughts?
EP, TPs, and SL are shown in the chart.

"Accurate Channel for Nifty50"This Analysis is not a trade recommendation, this study is purely for education purpose only, Do your own Study and Research before getting into any trades.
It worked for me....

BTC continue dropping to $35k#BTC/USD
$BTC broke down from ascending channel.
🐻 price can have a boring moves between $40k and $37k for days, then drop more to $35k.
and breaking down from support of $33k will drop price to $30k and $27k.
🐮 if bulls success to keep the support of $35k price can head up to middle line of weekly channel.

BTCUSDT - as long as price is in asc. channel,it will be bullishBTCUSDT
price is following an ascending channel and channel's lower trendlines are acting as strong support for the price, due to yesterday's strong down move the price is close to critical support area, as long as price is in the ascending channel and above support structure the bias will be bullish, previously the channel's lower trendlines triggered a strong bullish move twice we can expect the same if price holds above the support.
In case, if price breaks below the asc. channel and support structure, then the bias will turn from bullish to bearish.
Trade Wisely
*The content on this analysis is subject to change at any time without notice, and is provided for the sole purpose of assisting traders to make independent investment decisions.
