BTCUSDT - H4 Analysis For Next Possible Move!Hello Traders!
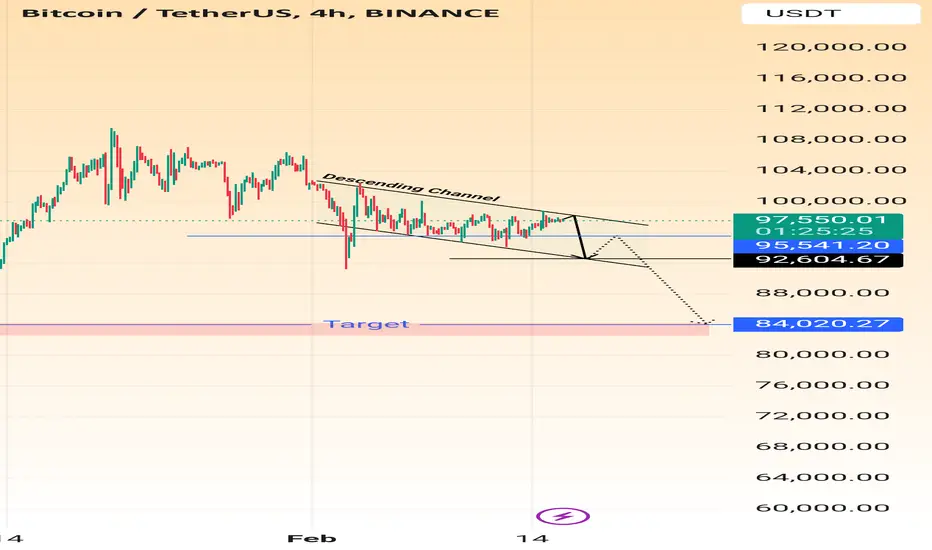
As price is moving within a downward-descending channel, which suggests a bearish trend.
The chart labels this pattern as a Descending Channel, which typically signals continued downward movement unless a breakout occurs.
Bitcoin is currently priced at $97,680.
A breakdown from the descending channel, leading to lower price levels.
The target price is set at $84,020.27.
The price is expected to test the lower boundary before breaking further down.
If BTC breaks below $92,604.67, it may trigger further declines toward $84,020.27.
Alternative scenario
May wait for a breakout above the descending channel to confirm a trend reversal.
If BTC breaks upward, a move toward $100,000+ could be considered.
Thanks
Regard: PipsOptimizer
Parallelchannels
A possible long market on NZDCHF The Market has been in a parallel channel and we might see a short sell on a 4hr and 1hr timeframe but the overall market looks bullish

XRP Is Warming Up Will This Breakout Ignite a Rally ?XRP is currently trading at 2.30, moving within a descending channel formation. This pattern is typically bullish, suggesting that a breakout may occur soon. The price has been respecting the channel boundaries, making lower highs and lower lows, but momentum is showing signs of potential reversal.
A critical support level lies at 2.25, where buyers may step in to prevent further downside. If this level holds and the price forms a bullish candlestick pattern, such as an engulfing candle or strong green close, it could indicate the start of an upward move. On the upside, the key breakout level is at 2.42, where a decisive 1H candle close above this level would confirm bullish momentum.
Using Fibonacci retracement from the recent high of 2.70 to the swing low of 2.25, important levels align with structural resistance. The 0.382 retracement around 2.40 to 2.42 coincides with the upper boundary of the descending channel, making it the first confirmation zone. The 0.5 level at 2.48 is a mid-range resistance, while the 0.618 level at 2.55 to 2.57 serves as a strong bullish target if the breakout occurs. Additionally, the 1H 50 EMA is positioned near 2.35 to 2.38, acting as dynamic resistance that, once reclaimed, would further validate the bullish move.
Momentum indicators suggest that the market is at a crucial juncture. The RSI is currently below 50, indicating weak momentum, but if it moves above 55 to 60, it would confirm a shift in trend strength. Volume has been decreasing, which often precedes a breakout, meaning a sudden surge in volume above 2.40 would validate buyer interest and increase the probability of a sustained upward move.
For a trade setup, the ideal long entry would be upon confirmation of a bullish candlestick pattern, especially if accompanied by a breakout above 2.42. The first target would be 2.48, aligning with the Fibonacci 0.5 level, followed by 2.55 to 2.60, where further confirmation of bullish momentum is expected. A stop-loss should be placed below 2.25 to mitigate the risk of fakeouts and potential downside continuation.
If the price successfully breaks above 2.42 and sustains momentum, it could lead to a rally toward 2.60 and beyond. However, if support at 2.25 fails, the price could retrace further toward 2.20 to 2.15 before finding stability. It is crucial to wait for a proper breakout confirmation before entering a trade to avoid unnecessary risks.

XRP | Bull Flag ContinuationPrice action successfully holding up above liquidity after breaking out from $2.80
As this retest develops it looks like we're forming a bull flag for a continuation towards $4.35 and then to see another rip onwards on the high side of the parallel channel with a second target of around $5.50.

GOLD: Parallel Channel inside a parallel channelWe see a parallel channel inside a parellel channel.
Still massive up-trend support.
As for now, GOLD is still consolidating and preparing for the next big move.

PEPE/USDT Ascending Channel Breakout WatchThe price is currently moving within an ascending channel pattern, indicating a potential bullish continuation. A breakout to the upside is expected, but confirmation is key. We'll look to accumulate PEPE near the lower trendline support around 0.0001995 for a long position. The breakout target is set at 0.0002412, offering a promising risk-to-reward opportunity. Ensure proper risk management by placing stop-losses below the lower trendline. Keep an eye on volume during the breakout attempt for stronger validation.

Nifty Short Term Analysis. Nifty today has given a poor closing below 200 days EMA but the only saving grace can be that the closing is just above Mid-Channel support of 23500 and Important Fibonacci support of 23263.
These Two supports are broken then more hell can break loose and we can get to see the next Fibonacci supports being tested. The next Fibonacci supports can be near 22509 or 21585. On the positive side if either of the support is held and then we can see a new rally in Nifty wit resistances at 24718 and 25347. It looks like Nifty will take some time to reach new highs as the the mode is bottom searching and consolidation as of now.
Fresh rally and Bullish recovery can start only after we get a closing above these 2 levels. However, this can be a good time to go long by picking good blue chip stocks available at good valuations.
Disclaimer: The above information is provided for educational purpose, analysis and paper trading only. Please don't treat this as a buy or sell recommendation for the stock. We do not guarantee any success in highly volatile market or otherwise. Stock market investment is subject to market risks which include global and regional risks. We will not be responsible for any Profit or loss that may occur due to any financial decision taken based on any data provided in this message.

#XRP/USDT 12h / Elliott-Fibonacci-Financial ChannelAccording to Elliott Wave theory, the price rose during the impulsive first wave and corrected in the second wave as an ABC zigzag to the 0.382 Fibonacci level. This aligns with Elliott's rules, suggesting that the correction of the fourth wave will likely be at 0.5 - 0.618.
Based on the impulse of the first wave, the target for the third wave is 4.25, followed by a correction within the fourth wave.
Using Fibonacci projections by shifting the grid from the start of the first wave impulse to the end of the second wave, the target for the third wave aligns with Fibonacci 1.618 (5.82). Without shifting the Fibonacci grid, the target for the third wave at Fibonacci 1.618 is 4.40.
To confirm this scenario, the price must break above the peak of the descending financial channel. Successful trades!

FET/USDT Long: Did you take it? See linked chartsIf you like these posts please remember to give me a boost and a FOLLOW! Any questions please ask away.
FET/USDT Long signal. Did you take it? Bullish order flow was there. We have our targets, and stops are at entry.
FET has been lagging compared to the rest of the market, especially in AI. Recent developments in their EARN & BURN mechanism look to be bringing excitement back and I believe there's plenty of catching up to do!
Bullish Orderflow:
EWT analysis & macro forecasting:

FET Long: EWT Analysis +$10 coming? By April 2025?All roads lead to roam.
+ Cycle Parallel Channel
+ Impulsive Parallel Channel
+ Cycle Wave 3 impulse of Wave 5 Primary.
The target is 1.618 to 2 Fibonacci extension.
Last Rally for Cycle Wave 5 topping around Nov/Dec 2025

BTC is Down for short timeAs you see it is simple price action technical analysis that showing the BTC lower price TPs.

EUR/GBP 4-Hour Bearish Continuation Trade PlanEUR/GBP on the 4-hour chart suggests a bearish continuation within a parallel channel. A Fibonacci retracement is drawn from the previous Lower High (LH) to the recent Lower Low (LL), highlighting potential resistance levels. An immediate sell order is placed at 0.8282, with a stop loss positioned above the last LH at 0.83418 to mitigate risk if the trend reverses.
The parallel channel, showing consistent Lower Highs (LH) and Lower Lows (LL), reinforces the bearish trend. For profit-taking, the first target (TP1) is set at 0.8222, and the second target (TP2) at 0.8162, aligning with the Fibonacci support levels. This setup confirms a continuation pattern, suggesting further downside within the established channel.

Gold can continues to grow inside upward channelHello traders, I want share with you my opinion about Gold. By observing the chart, we can see that the price a few moments ago started to grow inside the upward channel, where it at once rose to the resistance line and then made a correction movement. Next, the price continued to grow and later reached the resistance line of the channel again, which coincided with the current buyer zone, after which rebounded to the support line of the channel. Then Gold rebounded from this line to the resistance line of the upward channel, thereby breaking the 2605 support level, and also later exited from the channel. Price little grew and then started to decline, and in a short time fell to the support level. After this, Gold started to grow inside another upward channel, where it bounced from the support line and rose to the 2730 level. Price long time traded between this level, trying to break it, and later finally broke the 2730 level. After this, Gold rose to almost the resistance line of the channel, but not long time ago turned around and fell to the support area. At the moment, I think that the price can correct to support the line of the channel and then continue to grow inside the channel. For this reason, I set my TP at 2825 points, which coincides with the resistance line of the upward channel. Please share this idea with your friends and click Boost 🚀

golden channel gold price are going up inside a yellow parallel channel
price is making higher highs with higher lows so technically it is up trend until lower trend line breakout
price not only testing upper line of channel it is also testing big psychological level $2800 near upper trend line
today is last day of October month
tomorrow we will have last nfp number before election
just few working days before usa election results and fed rate decision

GOLD - Price can rise a little more and then start to fallHi guys, this is my overview for XAUUSD, feel free to check it and write your feedback in comments👊
Some days ago price started to grow inside the rising channel, where it at once fell below $2505 level, but soon rose back.
Prie made a retest, after this and continued to grow to resistance line of channel, which coincided with resistance level.
After this, Gold turned around and fell to support line, and soon exited from rising channel and declined a little more.
Then, price turned around and continued to move up, and later it reached $2685 level, and recently broke it.
At the moment, Gold continues tp move up, and I think that price can make grow a little more and then start to fall.
Gold will fall to support level, break it, and then continue to decline to $2640
If this post is useful to you, you can support me with like/boost and advice in comments❤️

Indusind Bank - Trendline SupportNSE:INDUSINDBK at major Trendline support in weekly Time Frame.
One can start accumulating slowly on seeing positive momentum from these levels. Medium term targets of Channel high can be achieved.

parallel channel on weak dollar gbpusd is going up
making higher high with higher low inside a yellow parallel channel
1.34297 first big resistance
lower yellow line first big support

Bitcoin's Breakout from a Wedge Pattern: Heading Towards $66,000hello guys.
let's dive into btc analysis after the previous analysis:
Broken wedge pattern: The chart shows a clear breakout from a descending wedge, a bullish reversal signal, indicating a potential trend shift.
Upward channel: After the breakout, Bitcoin has been moving within an ascending channel, which provides a strong bullish structure for price movement.
Support and resistance levels: Immediate support can be found near $62,000, while the next target on the upside is projected around $66,000.
Potential pullback: A minor retracement within the channel might occur, but overall momentum remains bullish as long as Bitcoin stays within the channel.
Bullish momentum: With the strong volume and the breakout from the wedge, the next logical resistance area to test is around $66,000 or higher.
___________________________
✓✓✓ Always do your research.
❒❒❒ If you have any questions, you can write them in the comments below, and I will answer them.
❤︎ ❤︎ ❤︎And please don't forget to support this idea with your likes and comment

Gold can break support level and continue to declineHello traders, I want share with you my opinion about Gold. By observing the chart, we can see that some days ago price rebounded from the support line of the upward channel and rose to the 2550 support level, which soon broke it. After this, the price tried to grow and some time traded higher, after which it made a correction movement to the support line of the channel, which is located inside the support zone. Then price turned around and continued to rise to the current support level, which coincided with one more support zone, and when Gold reached this level, it at once broke it. Next, the price some time traded near this level inside the support area and a not long time ago rose to the resistance line of the upward channel. But soon, Gold rolled down and in a short time declined to support the area, so, I think that Gold can make a move up and then continue to decline next. Also, I expect that XAU will break the support level and fall to the support line of the channel, therefore I set my TP at 2615, which coincides with this line. Please share this idea with your friends and click Boost 🚀

Dow Jones, Bullish !!!Dear All,
Although, I am not so sure about bullish ideas on US markets but as you know simplicity is everything and that is why I see long bullish channel (orange one) and last 45 years channel (red one) confirmed we will continue the bull run and the mid term targets are 48500 and 53800 for DJI.
See if markets price it in next year or not?!

HDFC - The Controversy UnleashedHere is the HDFC Chart published on July 22nd (inside my article) - "Nifty Analysis - The No-Nonsense "0" Indicator Strategy"
Now - compare HDFC's price action on Sep 24th - Precisely following the defined Path in Blue and rising like a Phoenix from the bottom of 1600 levels and breaking the ATH created on Jul 2023
Now by next week - End of September, HDFC would have the a Final Dip to test 1757 levels and then blast beyond the ATH of 1795 lifting Nifty to New Heights and the Target of 26,430
In this entire analysis - we didn't use any Indicators and No "Ifs & Buts". The Top 10 heavy weight constituents of Nifty were decoded, the Nifty's Daily, Weekly, Monthly and Quarterly Charts were analyzed for both Candlestick Patterns and Chart Patterns with Targets.
Once Targets were identified - and basis the status of each of the Top 10 heavy weights, the probable timeline required to reach the target was identified
1. From the Index's (Nifty) price action - the future of individual stocks were determined
2. From the Stock's price action - The Nifty's direction was determined
Only when both matches - the prediction is accurate - just like how we do Division / Multiplication in Maths to re-confirm our arithmetic
We don't depend on ANY NEWS or ANY Expert Opinion or ANY Technical Indicators to guide us. Because, these factors don't handle both Internal and External elements. Either they talk about a Sector but not a stock or they talk about the historical values of a Stock (example: RSI, MACD, EMA, DMA, Bollinger Bands uses historical values of stock).
The Indicators become handicapped when it has to consider the outside elements and hence loses it accuracy and value.
Learn to Stand on your Own 2 Legs...
Ignore the Noise...
Don't follow the Wise...
Make your Own Spice...

GOLD - Price can fall from top part of flat to support areaHi guys, this is my overview for XAUUSD, feel free to check it and write your feedback in comments👊
Some time ago price entered to rising channel, where it at once fell to support line, breaking $2385 level.
Soon, price rose higher than $2385 level, breaking it again, and then rose to resistance line of channel, and made a fake breakout.
Next, price declined to $2385 level and later bounced up to $2475 level and soon broke it, exiting then from channel too.
After this, Gold started to trades inside flat, where it some time traded between top and bottom parts.
Now, price trades near top part of flat and I think it can rise a little more and then bounce down to $2465 support area.
If this post is useful to you, you can support me with like/boost and advice in comments❤️

Which way for Sandstorm Gold?Been in a downtrend since August 2020.
Now repeatedly testing the upper downward channel.
Not much volume though, but upward sloping RSI on the weekly chart.
Is this the right time for a breakout?
You decide. This is not a recommendation to trade (i.e. buy, hold, sell or initiate any other transaction).
