ADA Daily View ADA Update
As you can see right now we are retesting the broken trend daily and it's very important for Cardano to hold this level.
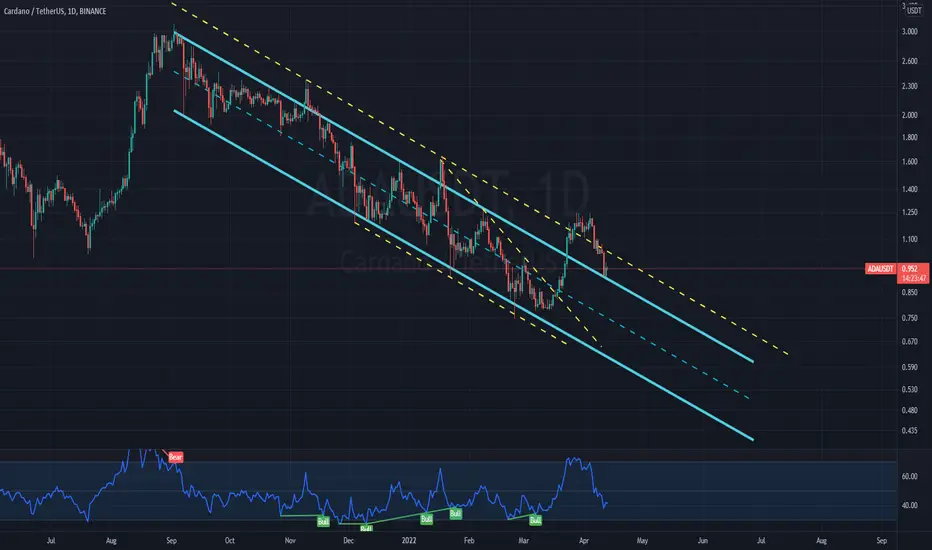
Parallelchannels
FTM ready to fly?I see FTM in these parallel channels and I think FTM can see higher prices in the mid-term timeframe so if you agree buy some and wait for profit.
support and resistance are shown in the chart.

parallel channel price making higher high and higher low
testing upper and lower white trend line making a perfect parallel channel
buying at the test of lower trend line and holding the profit until it breaks lower trend line

SHIBA World (Update)hi every one , The fake Ukrainian war made me think of buying . Follow for updates

BTC flag pattern bearish scenario#BTC/USDT
$BTC shaped an ascending channel that can act as flag pattern.
🐻 as you know flag is a continuation pattern, so if price break below the lower line of channel it will drop to support zone between $35k and $29k.

ZIL above middle line of channel#ZIL/USDT
$ZIL is at weekly parallel channel.
resistance zone between 0.5 and 0.618 fib levels of whole swing down rejected the price but price still have the support of middle line of channel.
🐮 holding the support of middle line can increase and even pump price to break out from channel to reach 1.414 fib level and more.
🐻 break down from middle line can drop price to lower line of channel around $0.025

BTC USDT Daily (Right Shoulder Formation) ?This is my continuation pattern trend from previous BTC charts for the 20k retracement.
A Bounce off the current dip on the middle trend line upto 54 / 55k to form the Right Shoulder and then the test on the neckline, retest on the neckline and then the bigger retracement down through the Fibs back to 20k.
Daily chart and a few more weeks for the cycle trends to work its way up and down.

Bitcoin Channels & Price ActionBitcoin is currently in an ascending consolidation channel, breaking down each of the last 4 times.
Given BTC's consistency/tendency with ascending & descending channels, expectation is to see $BTC price breakdown as inflation reporting and FOMC draw nearer.
Pretty straightforward approach to assess $BTC price/direction.
Once PA sets a consolidation channel, determining channel preference (ascending or descending), price action assessment is simplified.
If Bitcoin is in an ascending channel, price typically breaks down as it comes our of the channel's range.
Conversely, descending channel consolidation results in price breakouts.
Interesting side note, both rallies resulting in ATH's in 2021 also resemble relatively consistent head & shoulders patterns.

Bitcoin Looking Bullish !!!!!Let's start with the parallel channel formed since Jan 2022 (Red parallel channel). BTC has been moving within this channel till now. Important to notice is the Orange downtrend line breakout (orange circle) and then retest at the trendline yesterday (7/04/2022). Next, notice the short term bullish flag forming (blue bullish flag). BTC showed some bullish momentum when it made the 2nd bottom touch in the bull flag, retested the trendline and bounced back up.
If BTC maintains the momentum and can break out of the short term bullish flag, Major resistance at 48k and then the parallel channel we can see a massive pump towards 56-58k. Watch out for the massive resistance and pullback if we reach there.
This is not financial advice please DYOR

$ZILUSD - Wants to break this resistanceHello everyone!
Zilliqa hit this dynamic resistance 3 times already.
Now it has tested an important resistance as support and looks to break the upper border of the downtrend channel.

GMT UP Channel Pattern formationPossible formation of UP Channel Pattern.
If we break through channel line, then this idea will not be valid.
If we break upper line, we can get another pump, otherwise it can go down to previous support level.
-----------------------------------------------------------------------------------------------------------------
Please note that this is not a financial advice. Just my personal idea. Do your own research.

$BTC - Ascending channel break to Descending ChannelOverall I am bullish on $BTC however this appears to be the start of a descending channel as we appear to be breaking out of the ascending channel from previous week(s). I hope that I am incorrect. Would like to see how this plays out.

KCSIt is positive on the bottom of the descending channel with a hidden divergence
The trigger line is also activated

XAUUSD 1hHi everyone. You see the gold symbol in the 1 hour time frame. I think this path is predictable for that

Parallel channel tool (Requested) Somebody asked how i draw it..
Parallel channel, One of most use tools in analysis
to identify trend and dynamic support and resistance
.
Here's how i draw parallel channel with setting
.
At the beginning i was like u guys didnt know TV has this tool
but one of my good friend introduced me this.
.
Trade safe n fun

SLP flag and ab=cd pattern#SLP/USDT
$SLP is inside a parallel channel that can act as flag pattern.
🐮 price can drop to support zone around $0.017 that is the same with lower line of channel and then head up to break out upper line.
breaking out of flag can increase price to resistance zones and if price going to complete AB=CD pattern it will reach $0.05.
weekly time frame shows price can increase to $0.07 and $0.12 or even more


ATOMERA Weekly Technical AnalysisATOM Weekly - No RECOMMENDATION or ADVICE Status / EDUCATIONAL only - Support, Resistance, Trend Lines , Parallel Channels, Confluences, Fibonacci Extension - Hope it Helps, Good Luck


AUD/CHF Short 15 minA nice low risk high reward trade. the pair is expected to form WXY. At the break of the trend line is where you should enter. trend line clearly visible on 5 min. this is a high probable 120 pip trade.


SHIBA World (Update)Hi everyone , The Shiba channel that I had in my analysis gives us the last entry area. You have to be very careful because the lower Fibonacci channel can be activated.
