Clean impulse on $CRCT - Wave 3 to follow
It had a clean impulse on the daily chart. Now with 61% retracement done, it would be a good idea to consider Wave 3.
Momentum Indicators are bullish on the weekly chart and it has taken a support from 40-week EMA. The candlestick is a hammer pattern as well.
Classic example of resistance turned into a support or in other words, breakout and a retest.
Morning Star Candlestick pattern on the daily chart which is a Bullish Reversal Pattern.
The setup has a Risk-Reward Ratio of more than 8 with the SL being recent low and profit level being the equality level by Elliot Wave method.
With parallel channeling, the approximate time for the trade can be expected around one month.
Parallelchannels

SOXL pullback is ready to buy longSOXL the 3X leveraged ETF of semiconductor stocks has gained 145% for the first half of the
year. As shown on a 2H chart, the price has pulled back but the overall trend of HH and HL
is intact within an ascending parallel channel. Price previously touched the lower
trendline on May 24th while it touched the upper trendline May 30th and then again
June 15th. Between May 31st and June 7th it did a Fibonacci retracement. Price is presently
reversing at the lower trendline and is above the Ichimoku cloud a sign of bullish predominance.
Price is above the mean VWAP anchored to the low of May 24th another bullish sign.
The RSI indicator showing Ichimoku features has an RSI above 50 and above the cloud
affirming a bullish bias. I believe that this is setup for a long trade with about 12-15% upside in
two weeks or less for a much smaller risk. A call option trade could also be entertained
if a setup with a good delta low spread and high volume / liquidity can be found.

Watch These Bitcoin Levels Locally!When taking a look at Bitcoin on the hourly timeframe, we can see that on a local level (Low Timeframe) Bitcoin has been very choppy. This price action is currently for the professionals or the ones that like to get REKT.
I marked a few areas on the high of the range and the low of the range that I would be interested in trading as long as we get the right price action. Until then, I remain patient on the sideline waiting to execute with my alerts set.
Every day the charts provide new information. You have to adjust or get REKT.
Love it or hate it, hit that thumbs up and share your thoughts below!
Don't trade with what you're not willing to lose. Calculate Your Risk/Reward!
This is not financial advice. This is for educational purposes only.

ENSUSDTOCEANUSDT is trading in bullish momentum ,currently the is hovering around support zone in 8.10 region. If the instrument hold this support region, it will be nice buying option.

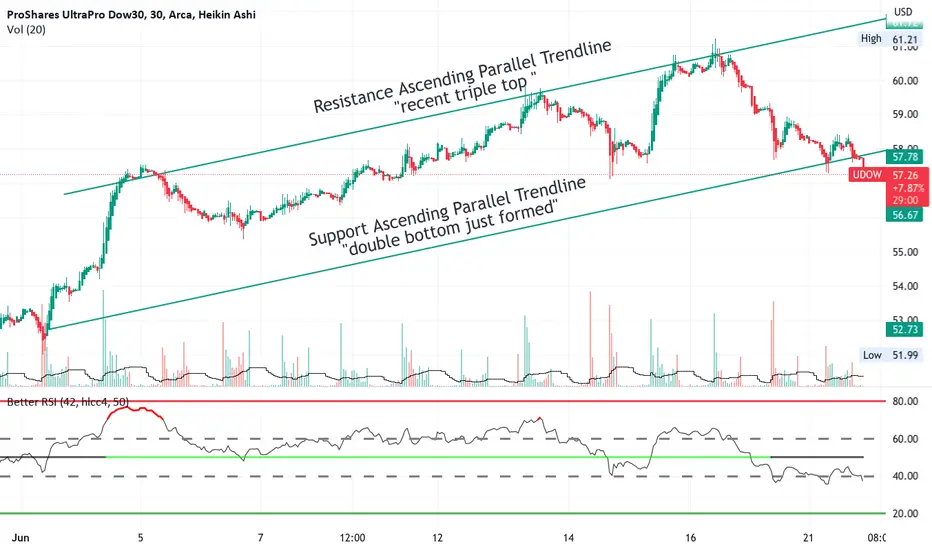
UDOW a triple leveraged ETF of the DOW indexUDOW is shown here on the 30-minute chart rising over the past month in an ascending
parallel channel. The chart shows the price currently situated near to the bottom of
the channel which is the support trendline drawn onto the chart with the resistance
trendline as well. My trading plan is I will take a long trade of 50 shares with a stop loss
immediately below the support trendline. I see a targets as $ 62 and $ 65 making for
a very favorable reward for the risk taken. For the entry, I will use the 5- minute chart
and enter when the HA candles are green and the RSI is above 50. I realize that the DOW
has less volatility than the S & P or NASDAQ but with that is less overall risk of reversals
and pullbacks. I tend to take higher-risk trades but see this as having a balancing effect
in my overall portfolio.
Kirloskar Ferrous Swing Trade SetupThis will be my personal trade Setup, This is not an advice of any kind to initiate trade according to this setup. This is for only for my learning purpose and maintaining my trading journal.
Price was in uptrend and then at ATH it was in consolidation from last 4-5 months and broke today with good volume support.
Nearby Support is now 478 which was acting as resistance. Once Resistance broke becomes support. If it sustains tomorrow or till this week then we can see good move upwards.
will try to buy if price retest this resistance or if there is any pull back near support of 477. and will buy with stoploss at 477. Target will be 515,520.
I cannot update charts or my ideas coz i don't have pro subscription i can only post additional charts if reputation level is above 10..need your supports who ever watch or agrees with setups i am posting. It will only take seconds.
Thanks everyone.

Bitcoin Hourly Chat at Bullish FlagBitcoin 1 hr. #TA on #BullishFlag
As per Bitcoin present movement, its basically starts their Descending Parallel Channel as well into Bullish Flag Pattern too.
But, in both conditions, major chances to break out FWB:25K support this time within 48 hrs. Maximum.
So, #DYOR and trade Wisely at this time.

Gold Epic Bull RunGold has been in the ascending channel since the second half of 2022.
We have seen 2 small falling channel formations within this huge channel and we are currently experiencing the 3rd falling channel formation.
We can understand that we have come to the end of this small falling channel, so we have come to the support of the rising channel.
The rejection of gold from these levels will indicate that it is entering a potential bull run.
As we can analyze from the Fibonacci time zone indicator, this run has the potential to continue until mid-July.
Breaking the ascending channel and falling below the $1900 level will invalidate this analysis and stop it.

USDCADUSDCAD is trading in strong bullish momentum and currently trading at strong support zone and also getting support from inclining trendline.
Will it continue its bullish trajectory from multiple support zones?

KAVA Long Idea bases on Channel, fib and OBVCheck out Kava's chart! It's positively sizzling with excitement! Not only has it just touched the lower trend line of the channel, around the Fibonacci 0.786 level (ALTS seem To love Fib 0.786), but there's also a tantalizing OBV divergence taking place!
This is a prime opportunity for a potential buy signal, friends. Just be sure to set your take profit at the $1.50 area, and your stop loss below 55 cents to manage your risks.
So buckle up and hold on tight, because Kava is about to take you on a wild ride to the moon and back!

GBPAUD SELL !!Price has been trading inside the given upward channel since September 2022 . Recently , the price reached the pivot line of the Channel and has shown signs of rejection to the downside ! My next Traget will be the lower limit of the Channel i.e. 0.83700 which is also is the 0.382 retracement of the previous move above , henceforth making it a strong support point !!

BTCUSDT - Trade Setup Gartley and Channel Support below 0.618 above Probable Macro Wave 4. Parallel channel for channel support resistance, fibs 0.618 above resistance, Bearish Gartley looking at a possible flat top Wave 5 otherwise 36k probable on breakout to the upside from previous highs.

A Closer LookThe Intriguing Factors That Have Sustained My Interest in This Promising Buying Opportunity
When it comes to GBPUSD, my sights are set firmly on one direction: buying opportunities. The stage is set for a potentially lucrative trade, and I'm eagerly awaiting the perfect entry point.
On the 4-hourly chart, a retest of the trendline (right) holds the key to triggering a buying opportunity. As long as the price remains above the lowest trendline, a breakout could present an ideal entry. Alternatively, a break and close above the high at 1.2483 (also on the 4-hourly chart) could be the signal to jump in.
Delving deeper, the 1-hourly chart (left) offers additional scenarios for a potential buying opportunity. A retest of support at 1.2421 or a more significant level at 1.2395 could both serve as triggers for an entry.
But why this unwavering persistence? Let's turn our attention to the weekly chart, where a break and close above resistance becomes a compelling catalyst for my bullish stance. Although we remain within the sell zone, I'm already scouting for buying opportunities, anticipating a potential shift in momentum.
Now, what if I'm wrong? It's a calculated risk. I understand that hitting stops is a possibility, but I mitigate that risk by ensuring most of my trades have a profit factor of 2. This means I can maintain profitability with a 40% accuracy rate.
So, as the GBPUSD landscape unfolds, I remain resolute in my pursuit of buying opportunities, armed with strategic insights and a calculated approach to capitalize on potential gains.

BTCUSDT - Parallel Channel and Speed Resistance Fan Depicted channel in White to me is our Parallel Channel. Fib speed resistance fan currently 0.618 support in line with the channel. 0.75 major support level as can be seen on our previous impulse to the bottom, that was a support for I think was a fake out to the downside.

Price Channels — Quick and Easy Guide.Greetings, @TradingView community!
When it comes to analyzing market trends, there's a technique that takes trend theory to the next level: price channels.
This is @Vestinda, bringing you a helpful article on the topic of the price channels, also known as trend channels, offer an exciting way to identify optimal buying and selling opportunities in the market.
Price channels serve as a valuable tool in technical analysis, helping traders determine favorable entry and exit points. By drawing parallel lines that align with the angle of an uptrend or downtrend, we create a channel. The upper trend line acts as resistance, while the lower trend line represents support. These lines highlight potential areas where the market could experience reversals or continue its current trend.
Understanding the sentiment of a price channel is crucial. Channels with a positive slope (upward) are considered bullish, indicating an upward trend, while those with a negative slope (downward) are bearish, pointing to a downward trend. Recognizing the slope of a price channel allows traders to gauge the prevailing market conditions and make informed trading decisions.
Price channels can be categorized into three main types:
Ascending channels
Descending channels
Horizontal channels
Ascending channels display higher highs and higher lows, signaling a bullish sentiment. To create an ascending channel, draw a parallel line touching the most recent peak, aligning it with the angle of the uptrend line.
Conversely, descending channels exhibit lower highs and lower lows, suggesting a bearish sentiment. To create a descending channel, draw a parallel line touching the most recent valley, aligning it with the angle of the downtrend line
Horizontal channels , also known as ranging channels, indicate a consolidation phase with no clear trend direction.
These channels provide insights into potential buying zones when prices hit the lower trend line and selling zones when prices approach the upper trend line. Understanding these channel types empowers traders to adapt their strategies to different market scenarios.
Constructing a price channel requires parallelism between the trend lines. The lower trend line is typically considered a "buy zone," while the upper trend line serves as a "sell zone." It's crucial not to force price action into the drawn channels. When the channel boundaries slope at different angles, the pattern is no longer a price channel but a triangle pattern, requiring a distinct analytical approach.
Remember that price channels don't have to be flawlessly parallel. In reality, it's rare to find price action that perfectly aligns within two trend lines.
As traders, it's important not to solely rely on textbook price patterns but also consider broader market context and other essential cues from price action. Effective price channel analysis involves embracing imperfections and making informed decisions based on the available information.
In conclusion, price channels provide traders with a powerful technique to uncover profitable opportunities in the market. By drawing parallel trend lines and identifying support and resistance levels, traders can gain valuable insights into market sentiment and enhance their trading decisions.
However, it's essential to remember that perfection isn't the goal. Instead, focus on understanding market dynamics and adapting your strategy accordingly.
💜 So there you have it - a quick and easy guide to understanding price channels in trading! 💜

NASDAQNASDAQ look for double top before a major correction?
A Major correction in NASDAQ is on the table.

GBPUSDGBPUSD was trading in strong bullish trend and lately tested the weekly highs. After the weekly high testing , the pair fall back to lower side of bullish channel.
Now will the GBPUSD rise again to high of the channel.

Head Shoulders Inverse and Parallel Uptrend with TargetsThis is an update to a previous post. RLC / BTC saw a strong reaction, bouncing hard off the neckline of the inverted head and shoulders on its 2nd re-test attempt. The 1st attempt nearly failed but also reacted strongly.
Now we're forming a parallel uptrend as it works its way to the TP 1 of the HSi. Reaching TP 1 would confirm a breakout of that as well and provide even higher targets.
RLC is an AI-based crypto. If Bitcoin manages to hold up, AI-based crypto projects may be the next big thing after NFTs and DeFi.
Why a new chart? The previous chart was not a logarithmic view, this one is. Either could be used, but I'm lately tending to prefer log charts.
Both of my previous charts for BTC and USD pair are linked below under related ideas.

Eur USD - Bullish trends 1 Hr TF FOREXCOM:EURUSD - Bullish Trend in 1 Hr TF. Buy Stop Entry Break of Previous H.H. Wait for Confirmation

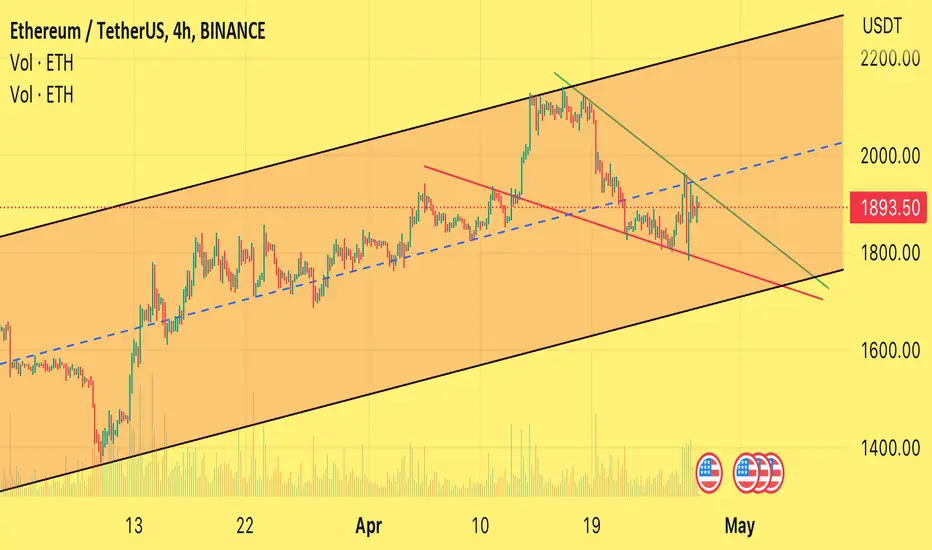
Eth falling wedge and ascending channel Eth is consolidating in ascending channel and falling wedge. It will stay in this range for some days. Btc will pump more than Eth these days. It’s not ETH time.
BITCOIN again in parallel channel range and more correction ❌🧨Hello 🐋
we can see more correction to the downside at least close to great daily support level ($26000) ❌🧨❌🧨❌
in other word
if
the price doesn't break the resistance zone to the upside and just complete the retest, we will see more correction, at least to our lower trend line ❌🧨
otherwise
we can see more gain to upper resistance level ✔️🚀
for
any other huge pump, we need more correction 📖📖📖📖📖
if
breakout of the lower support zone be completed, we can see more correction to the downside ❌🧨
brief amount of green candlesticks to the upside before any other movement is logical 📖💡
👌 Notice: pay attention to the price on shortcut chart (located above the main chart with black colour) 📖💡
Please, feel free to share your point of view, write it in the comments below, thanks 🐋

USDJPY, Five Count Diagonal, 1hrGood afternoon,
I hope everybody had a wonderful week and trading week. This week my bias has changed up a bit on the direction of where the market is going. Currently, I am leaning toward the market being in a diagonal consolidation in five wave count. Once the diagonal five wave count is complete, UJ will continue to be a dominantly bullish market.
Focusing on current events, I am currently looking for a retracement back into the price zone of 132.900 area. Once or if price takes this drop, I am looking for price to shoot back up to complete wave 4 and hit price point 134.541.
If you have any questions, comments, concern, or agree with my analysis, Please like, share, or comment.

ODAS channelsODAS is abiding the parallel channels since April 2022.
Two levels are given according to the price action. You can swing trade between the red intervals if it gives an opportunity.
