GBPCAD a short-term long trade into a HTF short area.GBPCAD presents a potential LTF long trade into a HTF short area. I am overall still bearish biased, but considering we have gaps to the top of the structure we might get an opportunity for a short-term counter long trade to finish the consolidation before we see the next bigger move to the downside.
📈 Simplified Trading Rules:
> Follow a Valid Sequence
> Wait for Continuation
> Confirm Entry (valid candlestick pattern)
> Know When to Exit (SL placement)
Remember, technical analysis is subjective; develop your own approach. I use this format primarily to hold myself accountable and to share my personal market views.
⚠ Ensure you have your own risk management in place and always stick to your trading plan.
Patience

AUDUSD looks promising for a continuationThis pair presents a potential trade opportunity in the form of a short continuation. The price did reach a significant Area of Interest (AoI) in form of an expanding 3-touch structure before turning around. Price did close outside the structure on the H4 with a candlestick reversal pattern and printed a bearish high-test candle on the daily timeframe. This clearly shows a shift in momentum and I am now waiting for a lower time frame (LTF) continuation pattern to confirm the direction and a valid candlestick pattern for entry.
📈 Simplified Trading Rules:
> Follow a Valid Sequence
> Wait for Continuation
> Confirm Entry (valid candlestick pattern)
> Know When to Exit (SL placement)
Remember, technical analysis is subjective; develop your own approach. I use this format primarily to hold myself accountable and to share my personal market views.
⚠ Ensure you have your own risk management in place and always stick to your trading plan.

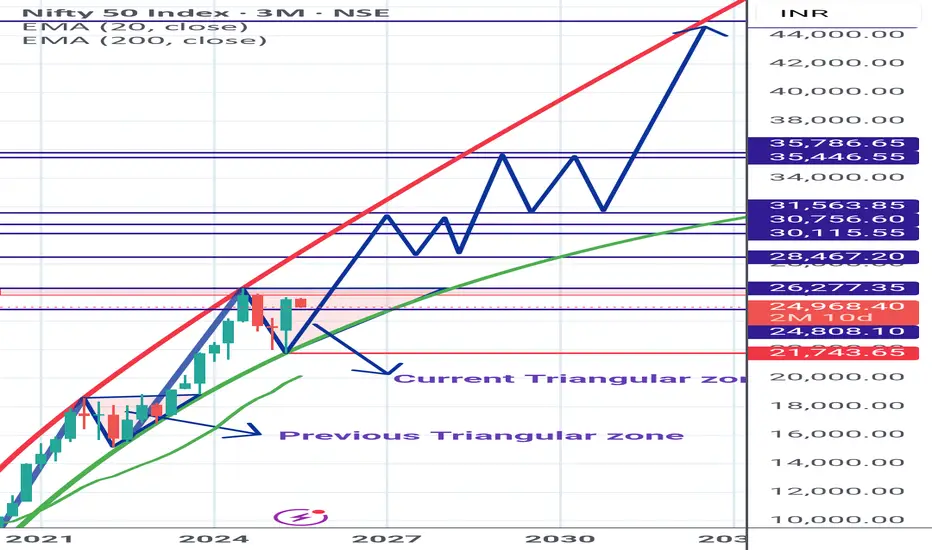
Nifty Spot Longterm View *Nifty Spot* Chart for members Reference.
Currently trading in Parabolic trend and inside Triangular zone.
On closing above the triangular zone, big rally to Begin.
Shared *My Study* based on chart pattern.
Kindly do your analysis from your side too.
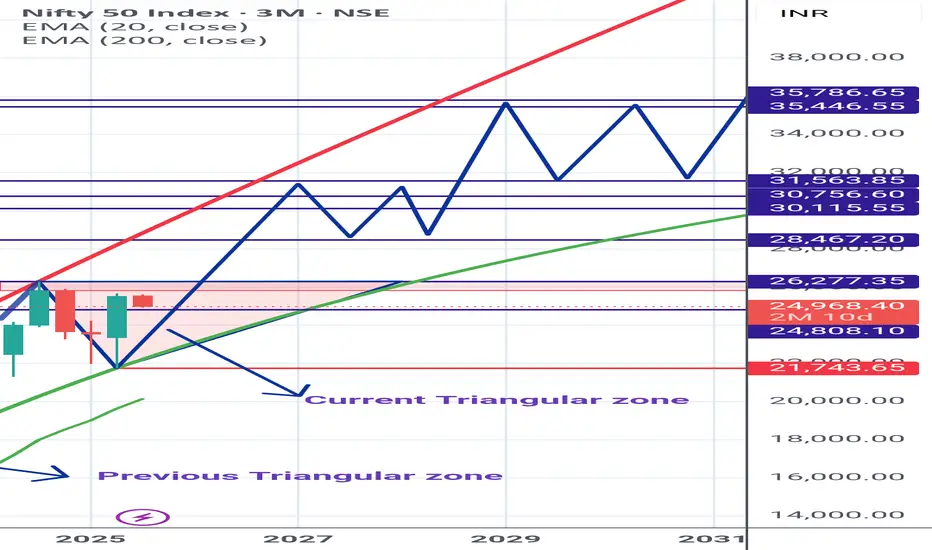
Nifty Spot Longterm View*Nifty Spot* Chart for members Reference.
Currently trading in Parabolic trend and inside Triangular zone.
Shared *My Study* based on chart pattern.
Kindly do your analysis from your side too.
XAUUSD Daily Outlook – July 21, 2025Hey traders 💙
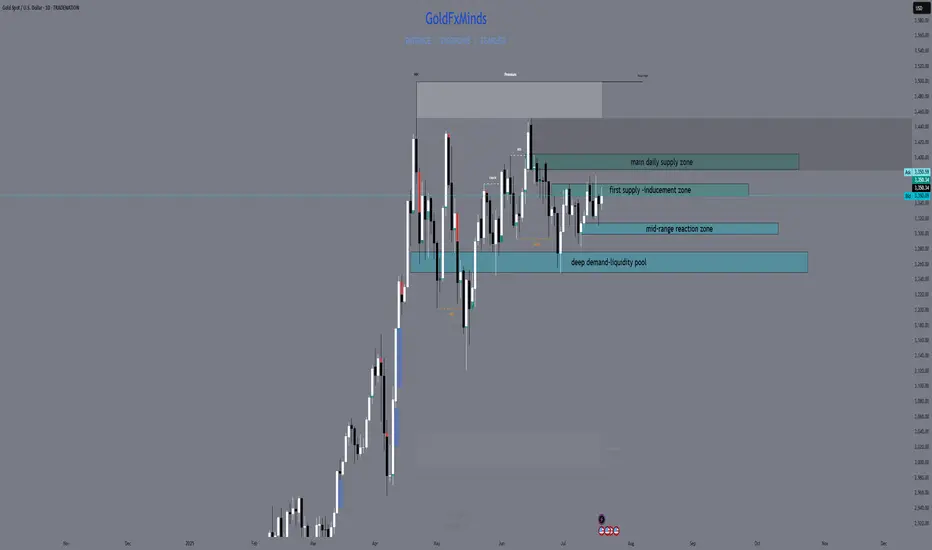
Gold continues to move inside a high timeframe range, with both bulls and bears defending structure at the edges. Price remains stuck between supply and demand — and only the strongest levels matter now. Here’s how the chart truly looks:
🔸 Key Supply Zones
1. 3380–3405: Main Daily Supply / Liquidity Pool Above
This is the top wall of the current range and the zone with the highest supply. Multiple failed breakouts, long upper wicks, and a clear cluster of liquidity just above. Unless we get a solid daily close above 3405, this area remains a trap for late buyers and a magnet for liquidity grabs.
2. 3355–3375: Internal Supply / Inducement Block
This zone has acted as an internal ceiling since the last CPI event. Here, price repeatedly failed to close above, and every return has produced quick rejections or fake breakouts. It often works as an inducement, catching breakout buyers and flipping the market lower.
🔹 Key Demand Zones
1. 3312–3300: Internal Demand / Mid-range Reaction
Here we see a clear reaction point where buyers have defended aggressively after CPI and NY session moves. It’s an internal demand area, often working as a temporary bounce or a place for stop hunts before larger moves.
2. 3275–3250: Main Daily Demand / Liquidity Pool Below
This is the base of the range, holding as support multiple times this month. Every dip into this zone has triggered large bounces, but the liquidity sitting below is also a key magnet for potential sweeps. Only a full daily breakdown here would flip the higher timeframe bias bearish.
📊 Technical Structure & Strategy
We are stuck between Main Supply (3380–3405) and Main Demand (3275–3250).
Every “middle” move is either inducement or a set-up for liquidity collection — not a real trend.
No daily close above 3405 → no bullish continuation.
No breakdown below 3250 → no clean bearish momentum.
Your edge: Only act when price confirms a reaction at a major zone with CHoCH/BOS, strong OB, or a liquidity sweep.
🧠 Takeaway:
This is not the time to guess direction — let the market show its intent at the edges. Use TradingView alerts on your key levels, be ready for volatility from macro news, and don’t get trapped in the mid-range games.
💬 Comment your bias or questions below.
Follow GoldFxMinds for more advanced XAUUSD updates and sniper-level education.
Stay patient, stay precise, and let structure work for you!
Posted using Trade Nation broker feed. As a participant in the Trade Nation Influencer program, I receive a monthly fee for using their TradingView charts in my educational content.
— GoldFxMinds 💙
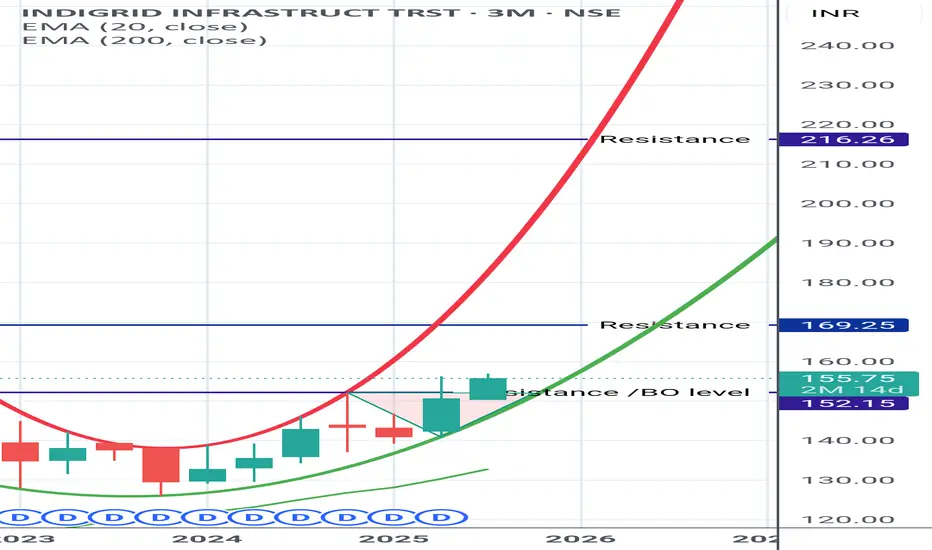
INDIGRID (REIT) INDIGRID - (REIT)
Dividend and Growth (Almost like investing in a BOND)
*At Present they are giving Rs. 4/- as dividend every quarter.*(here it is called as Distribution)
Slow and steady moving stock.
Can have a Small portion.
Technical view is *BULLISH*
Shared it for Reference purpose based on chart pattern and My STUDY.
Do Your analysis from your side before taking the ENTRY.
Hold on, here is the real deal.District court ruling on the joint motion (June12) still pending—no update yet.
Judge Torres’ ruling – could come any day; depends on district court docket.
Appeals proceedings remain on hold until at least August 15, 2025.
XRP spot ETF decisions delayed:
SEC ETF decisions, comment periods suggest
Franklin Templeton: very likely by late July
ProShares: by June 25
Grayscale: likely October
Bitwise: through June to October
CPI must fall under 2.0%
Oil must retrace to the $70s
Fed must signal a real cut, not conditional pause
DXY must fall below 103
Current War that we all are focused is going to be ended swiftly.
Until then, Hold Your Horses!

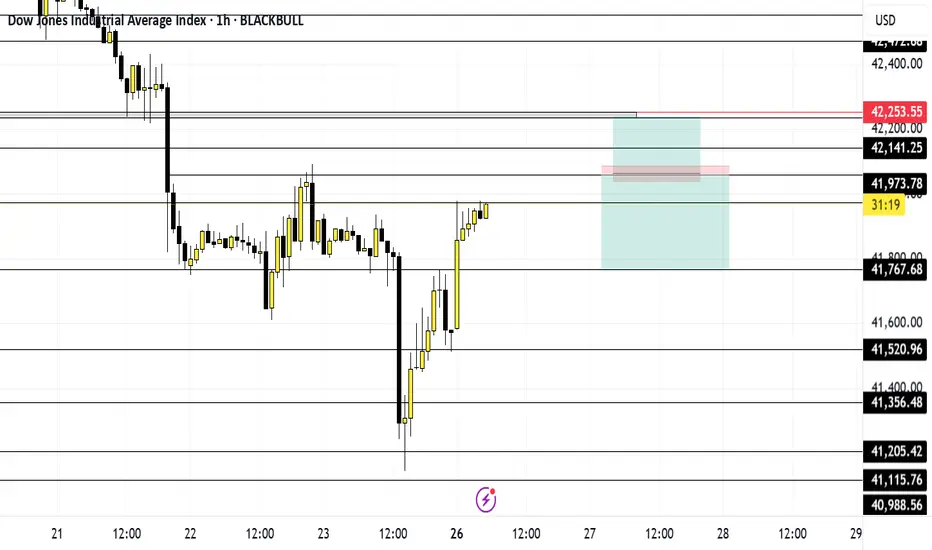
May 26 US30Let's get to work... Price at the moment is trending down, creating lower highs and lower lows on the 4hr. However it broke structure on the 1hr and is trending upward.
I'm going to wait for price to get to 42,055 level and wait for it to break and retest for a buy or break structure for a sell.
Caution. Monday is a holiday so I most likely won't trade until Tuesday.
And ultimately whichever way price goes I'm going to get out at my net key level.
Have fun, stay safe and enjoy your journey
Why Traders Chase — and Always LoseHard truth:
You don’t miss opportunities. You chase noise.
Let’s break down the real reason you keep “missing moves”:
1. FOMO is not urgency — it’s confusion.
When you enter because “everyone’s talking about it,” you’re not trading a setup. You’re reacting to social proof.
2. Volatility ≠ opportunity.
Big moves look attractive, but if they’re not in your plan — they’re distractions, not trades.
3. The market rewards patience, not activity.
Every click, every chart, every refresh feeds your dopamine — not your edge.
🚫 Solution?
Stop scanning. Start filtering.
Use tools that prioritize structure over noise. That’s why we built TrendGo — to give clarity in chaos and help you avoid traps masked as opportunity.
📌 Don’t chase. Build your edge.

PARTI IS PREPARING FOR PARTYHi everyone ,
PARTI is about to make a huge party .
Our indicators shows that the coin is undervalued by far and sellers start coming in..
That's mean that this coin is about to explode..
It's a good idea to manage your risk accordingly and be prepared to book your profits at 0.88 area! It might go higher as ALT coins are easy toi be manipulated.
At this point you have to be prepared for a 20% drop and if this happens it will be a perfect timing to buy more!!!
We will keep you updated when our price target will meet, it might go higher!

"Godshield’s Gold Play: Going Short or Waiting for ConfirmationThe XAU/USD M30 chart from April 27, 2025, at 08:57 AM WAT shows gold at $3,302.27, after a significant drop from $3,421.64 earlier in the session on April 26. The chart highlights a bearish move with multiple annotations—labels like "Sell," "PUT," "BOS" (Break of Structure), and "OB" (Order Block) indicate a strong downtrend. The price broke below a key level around $3,307, which aligns with a bearish order block labeled "Sell" and "OB," where sellers stacked orders. The "BOS" label shows a break of structure, confirming a bearish shift with lower highs and lower lows. The trendlines (red and yellow) form a descending channel, guiding price lower, with a recent test of the upper trendline around $3,316.98 before the drop.The question is: am I going short now at $3,302.27, or waiting for confirmation? Let’s run through my checklist. I start with harmonic patterns—while no specific XABCD structure like a shark is labeled here, the chart’s bearish momentum aligns with my earlier analysis of a bearish shark on April 25, suggesting the downtrend is continuing. Market structure confirms bearish continuation—the break of structure below $3,307 (labeled "BOS") shows sellers in control, with lower highs and lower lows on H4 and H1. The bearish order block around $3,307, marked "Sell" and "OB," is where smart money distributed, and price has reacted strongly after retesting this zone. Volume profile isn’t shown, but I’d expect high volume at $3,307, with a Fair Value Gap below acting as a magnet, likely near $3,293.66, as indicated by the chart’s price levels. Top-down analysis aligns—H4 is bearish, H1 and M30 confirm the downtrend, and I’m looking for an M15 retest of $3,307 as resistance for a sell. Heikin Ashi candles (though not visible here) are likely red, as the chart is titled "Heikin," supporting the downtrend. Fibonacci extensions (not drawn) from the high at $3,421.64 to the low at $3,293.66 point to a target near $3,289.46, the next support on the chart. Gann angles (implied by the trendlines) align with this target. MACD and RSI aren’t shown, but based on my system, I’d expect a bearish crossover with a negative histogram and RSI below 50, likely showing bearish divergence at the $3,316.98 high. Risk management is set—sell at $3,307, stop-loss above the recent high at $3,316.98, take-profit at $3,289.46, giving a 1:2 reward ratio. News and liquidity traps are clear—no fake spikes above $3,307 yet, though I’m watching for them, especially with the volatility noted earlier this week (gold hit $3,499.99 on April 22, per my previous chart).Given this setup, I’m going short now at $3,302.27. The price has already retested the $3,307 order block and rejected it, as shown by the "PUT" label and the drop to $3,302.27. Waiting for confirmation isn’t necessary here—the break of structure, order block rejection, and bearish momentum are my green lights. My target’s $3,289.46, with a stop-loss at $3,316.98, locking in a solid risk-reward ratio. I’ve been refining this strategy for six months, backtesting like a beast, and I’m confident in this hunt. That said, I’ve missed momentum signals before—like on April 22 when I didn’t catch the RSI overbought signal at $3,499.99—so I’m staying sharp.The asker mentioned waiting for confirmation at $3,300, but that’s not a level on this chart. The closest support is $3,293.66, which aligns with my take-profit. Waiting for $3,300 might mean missing the move, as the bearish momentum is already in motion, and my target is below that level. If price consolidates or shows signs of reversal (like a bullish Heikin Ashi candle on M15), I’d reassess, but for now, I’m in.
What do you think, fam? Am I right to go short now at $3,302.27, or would you wait for a different confirmation? Drop your thoughts below—I’m curious to hear how you’d play this XAU/USD setup! If you’re one of the two ready to join me at Academia for Forex Trading, let’s talk—we’ll hunt these markets together. And while you’re at it, check out Icon Collections Store—does RiverSide, Desire, or Icoca vibe with your trading energy? Let me know!

Why you should WAIT for trades to come to YOU!In this video, we dive deep into one of the most underrated but powerful habits that separates consistently profitable traders from the rest: waiting for the trade to come to you.
It sounds simple, even obvious. But in reality, most traders—especially newer ones—feel the constant urge to do something. They scan for setups all day, jump in at the first sign of movement, and confuse activity with progress. That mindset usually leads to emotional trading, overtrading, and eventually burnout.
If you've ever felt the pressure to chase price, force trades, or trade just because you're bored… this video is for you.
I’ll walk you through:
1. Why chasing trades destroys your edge—even when the setup “kind of” looks right
2. How waiting allows you to trade from a position of strength, not desperation
3. The psychological shift that happens when you stop trading to feel busy and start trading to feel precise
4. How the pros use waiting as a weapon, not a weakness
The truth is, trading is a game of probabilities and precision. And that means you don’t need 10 trades a day—you need a few good ones a week that truly align with your plan.
Patience doesn’t mean doing nothing, it means doing the right thing at the right time. And when you develop the skill to sit back, trust your process, and wait for price to come to your level… everything changes. Your confidence grows. Your equity curve smooths out. And most importantly, your decision-making gets sharper.
So if you're tired of overtrading, feeling frustrated, or constantly second-guessing your entries—take a breath, slow it down, and start thinking like a sniper instead of a machine gun.
Let the market come to you. That’s where the real edge is.

EURNZD Price has been extremely bullish the past few weeks so I'd continue looking for buys until price breaks the previous H4 higher low/support around the 1.88900 area. IF that support is BROKEN, then I'd look for sells towards the 1.85400 area.

Today's Market Overview and for Tomorrow Today's Market Overview:
General Trend:
The market seems to be consolidating after breaking key structural levels (BOS and CHoCH). The price is hovering near resistance zones (Premium and EQH) and shows potential for a move toward lower support zones (Discount and Equilibrium).
Key Support and Resistance Levels:
Support Zones (Fibonacci Levels):
The range of $2,690 to $2,684 serves as a critical support area.
Resistance Zones:
The area around $2,718 to $2,725 acts as a strong resistance zone, likely to impede further upward movement.
Scenarios for Tomorrow (January 21, 2025):
If the price breaks above the $2,718 level and sustains, it may target the next resistance at $2,725 or higher.
If the price drops below $2,698, it could retest the support zone between $2,690 and $2,684.
Fibonacci Insights:
Key Retracement Levels:
Based on the chart, critical Fibonacci retracement levels seem to align near $2,705 (0.382) and $2,690 (0.618), making these levels important for potential reversals.
Recommendations for Tomorrow:
For Bullish Traders:
Wait for the price to stabilize above $2,718 and look for buy (long) opportunities targeting $2,725 or beyond.
For Bearish Traders:
If the price breaks below $2,698, short positions targeting the $2,684 support zone could be profitable.

Long Biased Market -> Wait for CorrectionPrice is moving towards a weak low. This should be ignored and we should wait until we reach the stronger level of demand formed via double bottom + absorption pattern.
Bullish Order Flow, but we need to wait until we reach a fair value to enter this market.

Don't FOMO into $EOSE, Be a LION and wait for your moment! NASDAQ:EOSE 🔋🪫
Another BANGER from Charturday!
I've adjusted the CupnHandle Breakout as it's now right at the Measured move of the Bull Flag breakout while also being at prior wick high.
IMO this is not a good entry and would be considered chasing. I'm going to wait for the Wr% to peel off the Williams CB red barrier and look for support to form and enter then.
If it doesn't happen and continues to run it's OKAY! You can't have endless plates or delicious HAM or PIE during the Holidays! The same goes for the stock market friends!
Not financial advice.

USDT Dominance Raises Caution: Time to Stay Patient in Crypto?USDT dominance is looking quite concerning right now!
It might be wiser to stay patient and wait for clearer signals before moving.
#Crypto

TP Hit, Letting Remains RunMore To The Upside Bias As We Above Both daily & Weekly.
Potential Discounts To Occur As We In OverBrought Zone, Therefore Pullbacks Retracements On The Rise Before Continuing To The UpSide.
Trade Safe Everyone.
Happy Wednesday.
😎

Are You Trading the Right Zones?Understanding key areas like demand zones, liquidity grabs, and volume profile levels is crucial for consistent success in trading.
Here's how I approach them:
1️⃣ Liquidity Grabs: I wait for the market to grab liquidity from obvious levels. Why? It’s often a signal of institutional players stepping in.
2️⃣ Demand and Supply Zones: These zones are where price historically reverses. Identifying them helps me anticipate high-probability setups.
3️⃣ Volume Profile Insights: Volume tells a story! Zones with strong volume usually act as magnets, drawing price back for a reaction.
🔑 Pro Tip: Patience is key. Wait for confirmation at these levels instead of rushing into a trade.
💬 Let me know—what tools do you use to identify your trade zones?

Psychology in Trading: Overcoming Fear of LossesFear of Losses"
"As traders, we often fear losses, but it’s important to understand that losses are part of the game. Instead of avoiding them, we should learn from them. Here's how I’ve learned to overcome this fear:
1️⃣ Accept losses as part of the process.
2️⃣ Focus on consistent execution, not on short-term results.
3️⃣ Develop a mindset that values learning over perfection.*
Remember: losses are temporary, but discipline leads to long-term success!

Patience is LONGSo in this image, I hope that you can see the obvious. We have a wide range that we could potentially be trading from top to bottom until one side breaks. My idea right now is that we still haven't taken out the range low, which would also take out some of the liquidity wicks. I've also added the downtrending range to keep in mind and backup my thoughts that this could just be a correction for a bigger jump to the upside.
That's where I would look for:
A loss of that level
A reclaim ( possibly a swing failure pattern, ie, wick below and close above the lows )
A change of market structure
A long trade entry
This is assuming we come back down here, of course. If we don't, then we look for the top of the range for vice versa option or a continuation of this incredible bullish trend where we find support at the highs and continue on.
Always keep in mind that we may not get the SFP and the close back above the lows, this could take patience if we start to see a back test of them laws, and a loss of that level.
Losing BITGET:BTCUSDT.P $36,000 ish would look more bearish and we might even end up closing the CME gap below.
Just sharing some thoughts, so you are aware of the range that we're in. Sometimes I miss these things and they could be really great opportunities for both long and shorts until one side breaks.
This is not financial advice.

Intel (INTC): Patience is key while the market is rangingNothing significant has changed on NASDAQ:INTC since our last analysis. It appears that Intel may have found a bottom at the 88.2% Fibonacci level, but the stock has remained in a range since then. Unless the resistance level above is reclaimed, we wouldn’t be surprised to see continued ranging behavior.
Even Intel’s latest earnings report didn’t create much movement. Despite posting a considerable net loss due to impairment and restructuring charges, Intel projected fourth-quarter revenue above estimates. As one of the largest producers of PC chips, Intel has recently benefited from renewed demand for PCs, driven by on-device AI features and a fresh Windows update cycle. These factors allowed Intel to exceed Wall Street’s low expectations, but not enough to break the current range.
We’ll continue to monitor NASDAQ:INTC , but as it stands, trying to long it into the overhead resistance doesn’t make sense from our perspective. Patience is often the best strategy in such uncertain market conditions.

FET Solid Long Entry & TargetA few untested KEY levels below would be a nice place to enter a long trade if we get the reaction we are looking for. The target would be the Value Area High & other untested KEY levels above.
Calculate Your Risk/Reward so you don't lose more than 1% of your account per trade.
Every day the charts provide new information. You have to adjust or get REKT.
Love it or hate it, hit that thumbs up and share your thoughts below!
This is not financial advice. This is for educational purposes only.
