GBPCAD update Patience is key, right now waiting for good confirmation if price will hold or get back inside the up-trend channel! For my own pleasure, i would like to see scenario A happening!
What do you think? leave your opinion in the comments!
Also, if you like to discuss ideas and enjoy my analysis, join me in Telegram! Link in the bio
Patience

Can the VTC cycle repeat leading up to BTC halving?Here's what VTC would look like if it followed the same pattern as last time.
Good luck.

BEING PREPARED & PATIENT YIELDS RESULTS*DISCLAIMER: NOT FINANCIAL ADVISE BUT WHAT WORKS FOR ME*
This post is to highlight though we are in a bearish market there are still good opportunities to make great gains if you're prepared and patient. I rarely make intra-day trades when gains are far greater if you can weed out the chop and stay focused on the bigger picture. I.E. in the last 30 days I've been able to achive 40% gains in my active trading portfolio *(excluding hodl, savings, other investment accounts)* using leverage and hodl'n positions 5-15 days. We've seen a 33%ish drop in $BTC price and I was able to capitalize on 21%, I consider the other 9-13% to be educational tax, with a win loss rate of 20:1 (I consider this very fortunate and the trend mainly moved short).
*Variety is absolute key, don't put all your eggs in one basket but also don't spread yourself too thin.*
This has been achieved through the following steps:
Trading plans for both scenarios before entering a position
Trading Logs, Record EVERYTHING. The data will uncover trends in your own trading.
Trade Management
Trading with the trend
Many many more but these are the big guys
...
A very interesting positions here, we've broke downward of a major trend line (in red) and the neck of the head and shoulders developed by 9k-14k prices on the daily and weekly charts. Looking at the 4hr we've also built a quick inverse head and shoulders just under the red trend line.
Lots of contradicting signals here today so I've devised both bullish and bearish scenarios. I suspect the 9MA/18MA on the daily moving into current price action could be the time-frame triggers
BULLISH
SIGNALS: Bullish divergence on the daily RSI, Price action bottoming out on it's bearish channel, and the 4hr inverse head and shoulders could be a small signal.
ENTRY TRIGGERS: Price breaking LONG and a daily close ABOVE 7500
FIRST TROUBLE AREA: 8000
TARGET: 8500 13% MOVE
STOP-LOSS: 7300ish PRICE ACTION DEPENDENT
BEARISH
SIGNALS: Possible weekly close under major trend (In RED) which is now also .618 FIB off the 20K ATH, Major trend being bearish
ENTRY TRIGGERS: Price breaking SHORT and a daily close BELOW 6800
FIRST TROUBLE AREA: 6500
TARGET: 6100 and BELOW 12+% MOVE
STOP-LOSS: 7000ish PRICE ACTION DEPENDENT
At the end of the day I remain long term bearish with the trend, just too risky atm to confirm a bearish move is to follow.

It does not look too bad Although it seems to be down quite heavily looking at Binance charta only, it doesn't look so bad when looking at the whole picture.

CADJPY Ascending/Descending Channel Support Zone ConfluenceSTRATEGY: Chart Patter/S&R Strategy (Ascending and Descending Channel)
Focus TF: 4H
TP Target: 2.04R
ET: 1H - Abandoned Baby; Bullish Engulfing
AOV: Ascending and Descending Channels' Support Zone (Confluence)
1D Analysis:
Long Term - Price moving inside a large Ascending Channel.
Short Term - Inside Ascending Channel, there's a Descending Channel and the price approached both Large Ascending and Descending Channels' Support Zone.
Pin Bars occurred on the Support Zone showing rejection of the area. There is a high probability that the price will bounce and hit the Major Resistance (Horizontal) area.
4H Analysis:
Price struggled to create a new low, showing mini consolidation and price rejection of the Support Zone
1H Analysis:
ET:
- Abandoned Baby
- Bullish Engulfing - Series of Bullish Engulfing occurred on 1H TF. These are a great sign that price is ready to bounce and go up.
Note: This post is my personal journal/opinion only. Please trade at your own risk.

Bitcoin almost done correctingIf you're not looking at Bitcoin logarithmically, then you're not seeing the long-term price trajectory. Remember, fiat currency is now moving into hyper-devaluation, so it's more prudent than ever to hold onto something that isn't chipped away at by banks or other greedy hands. crypto and precious metals are the only two things left, and you should own both. (not financial or investment advice)


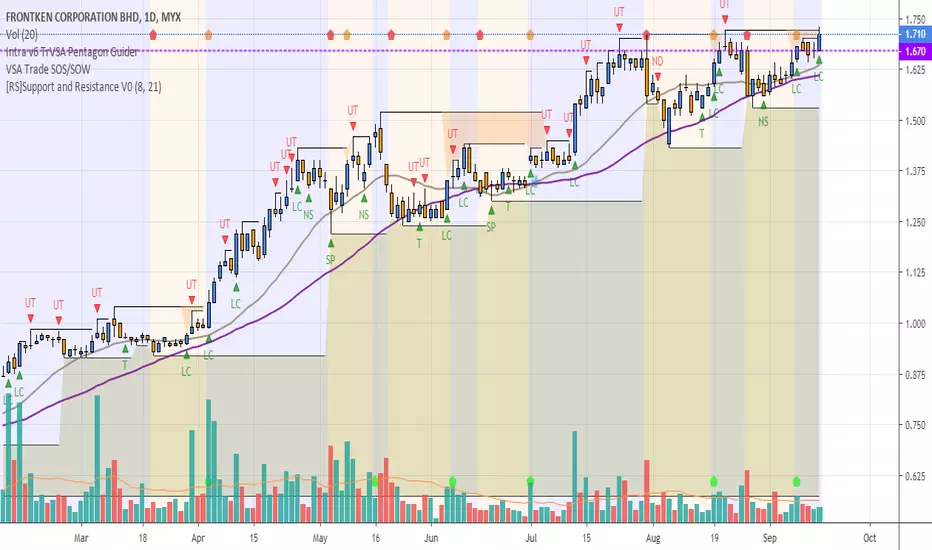
How high can Frontken (0128.kl) go?- Frontken has been on an Uptrend for some time. I did write about it months ago (click on the link below).
- In the recent chart, we see that the price is trying to break Resistance @ RM1.67.
- At the time of writing, we see an LC breaking through this Resistance at its 3rd attempt.
- If this is a genuine break, volume must be high and price will then do a pullback just above the Resistance line.
- One should not trade based on emotions. Let's wait and see the progress after few days.
XAUUSD 2/10/2019Hello Traders!
We play with Smartmoney concepts, that means that we look mostly on PA to determine what will happen in future.
As we all know, price is moved by BIG players: Banks, Institutional traders, HFT bots (we call them all of them SM).
They can't play as we do, cause of a HUGE lot sizes, so cause of that they need to SELL to BUY and BUY to SELL for positioning them self in the best possible spot.
If u were learn about trading from free and accessible knowledge, u probably heard about BUYing LOW and SELLing HIGH?
So SM must BUY LOWER and SELL HIGHER :)
We as retail traders are just a small fish in this ocean, so we need to catch the waves which are created by SM.
CHARTS AGENDA:
SM - SMART MONEY
PA - PRICE ACTION
BITCOIN SIGN - MONEY POCKET
ARROWS ARE ABOVE AND BELOW OF EQUAL HIGHS AND LOWS
BLUE LINES - ENTRIES WITH SM
MARKED LINES - POTENCIAL ENTRY POINT
BOX - GAP's
GOD BLESS U ALL!

USDJPYI am anticipating on seeing USDJPY creating a second shoulder and before making its way to the upside to create a new high on the 4 hours time frame which is a retracement back to the swing point to create a new Lower High .

Patience Pays Off: 3-to-1 EURAUD Trade!Hi all, @FollowMyForex here with a new trade signal that just triggered.
After patiently waiting for almost exactly a month, we have a new trade setup. That's right, our last trade was exactly 1 month ago! How many people can say that they have the patience and trust in their system to sit out a month of no trades before waiting for the perfect next setup?! We don't say this to brag, but to emphasize how important it is to be aligned with your system and remove any and all emotion from trading.
During this month there were thousands of people who lost entire accounts. More people who ended negative, and maybe a few who ended slightly positive. But do you want mediocre results like that just to trade more often? We've long since made that choice - no! We'd rather sit on our hand and wait for an A+ setup rather than take mediocre trades that just end up eating into our year's a profits. We still have all the profits we had a month ago and that is vital to remember!
Having waited this long is another thing I love about our trend following system... if the markets aren't trending, we don't get false signals!
A lot of pairs are starting to set up right now so it looks like there will be more action in the weeks ahead.
Safe trading!

Potential Correction - Daily Interval - EURJPYHello Successful Traders,
The prevalent push towards the upside (bullish) has begun to manifest intriguing (potential trend transfer) analytics for the days (and weeks) to come.
Be Conscientious and Stick To Your Trading Plan***
Not Investment Advice. For Analytical and Educational Purposes Only.
- LionGate

Potential Temporary Reversal - 1 Hr Interval - AUDUSDHello Successful traders,
Considering the prevalent uptick in PA (Price Action) within the 1 hour interval (and in-ward), a probable correction may be imminent.
Be Conscientious and Stick To Your Trading Plan***
Not Investment Advice. For Educational and Analytical Purposes Only.
-LionGate

BAC over extended and feds coming!BAC pushing up into zone. Looking to follow this one this week and see if we get rejected. FEDs will be a catalyst. Might wait til wed after announcement unless solid tell is present. Love the options chains and liquidity on this stock!

Potential Trend Continuation - Daily Interval - USDJPYHello Success Traders,
The currency pair (USDJPY) is manifesting the formation of a "cup and handle" formation. Considering the prevalent uproar (bullish) in PA (Price Action), a probable correction with the next few days, to then a significant spurge into bullish territory to re-contest previous relative highs. (Long Term Bullish, Relative Short).
Be Diligent and Stick To Your Trading Plan***
Not Investment Advice. For Educational and Analytical Purposes Only.
-LionGate

Temporary Bearish Momentum - 1 Hr Interval - EURUSDHello Successful Traders,
Considering the current uproar in PA (Price Action), an imminent correction may take place within the next few hours.
Be Conscientious and Stick To Your Trading Plan***
Not Investment Advice. For Analytical and Educational Purposes Only
-LionGate

Gold holding Trend. Up then down againGC still holding the trendline pretty well with a "zone" to match. Could be an easy entry. Loking for this to rise maybe overnight up into the trendline/zone with a drop to follow. Could see good prices on PUTs if this happens and catch it off the rise. Any positions held nust be patient. Trend is your friend "until the end"

Potential Bullish Break Out - Daily Interval - AMRHHello Successful Traders,
As the time is approaching, for some of us we have been anticipating the announcement of the Earnings Report. Tomorrow at 8:00 A.M. EST, the company will release it's report. Await confirmation prior to entering the market.
Resistance Level 2 - (0.40 - 0.50) 10 cent interval
Resistance Level 1 - (0.33 - 0.40) 7 cent interval
Key Price Zone (KPZ) - (0.25 - 32) 7 cent interval
Support Level 1 - (0.20 - 0.25) 5 cent interval
Support Level 2 - (0.10 - 0.20) 10 cent interval
Furthermore, the company has released a number of promising PRs that can truly assist its revenue stream within the upcoming quarters.
Not Investment Advice. For Educational and Analytical Purposes Only. (Be Conscientious and Stick To Your Trading Plan)***
- LionGate

There are mainly 3 phases in the so called Price ActionThe very same day you learn to read your graphics correctly, you will certainly know it because your Bank Account
will always be bigger than before.
Your only JUdge will be the merciless Dollar value. Anything else can be considered as illusions.
It is very easy to cheat everybody, including ourselves, however we cannot cheat the Filthy Dollar $ value.
Here, it seems like if ... WHATEVER YOU WANT TO BELIEVE .... it is here in front of your own eyes.
Knowing that there are mainly 3 phases in the so called Price Action, it might help. We seem to be here in the
CONSOLIDATION PHASE, then we have the next one where the price moves UP and DOWN cautiously ...(sort of)...
Then we wait for the fabulous TRENDING PHASE. .
You get on board at the right time and jump out of the wagon at the exact location and you will find yourself in
Wonderland. ........................ Good luck.


BTC + SPX Symmetrical TriangleSymmetrical triangle pattern in BTC and SPX, waiting for a breakout. Looks like bullish momentum is fading and we are headed for corrective territory. BTC has the potential to explode higher, but I just don't see it for the SPX... there are too many fundamental factors on the table to currently justify passing 3000 without more "trade talks going well!" nonsense.

XRP LONG - Winters Algorithm XRP LONG - multiple confluences. first - the use case. XRP is rocking and rolling, and beating to the sound of their own drum. fundamentally, they are one of the most motivating companies across all spaces. positive news is released daily about this particular asset class.
technically - many areas to focus on. the liquidity pullback and retest is a clear sign that support is in effect. the slow bear trend has been creating a solid consolidation area to buy from. we have finally retested that previous area - and are looking for a slingshot style candlestick.
we all know what happens when you tap on the glass for long enough. it shatters. prepare for turbulence northbound.
good luck. these are my personal visions and opinions. make your own.
Best,
Winters
