LTCUSDTThe tool watches for a strong upward move (called the flagpole).
Then it looks for a small pullback or sideways move (called the flag).
Pattern

BNB will rest after reaching 1000BNB has successfully bounced back from the support area and heading towards the next resistance which is around 900-1000. This target is easily achievable for BNB since is fundamentally strong and BNB ecosystem is heavily used.
I'm expecting BNB to reach 1000 in 3rd of this year.
Follow Our TradingView Account for More Technical Analysis Updates, | Like, Share and Comment Your thoughts.
Cheers
GreenCrypto

Tatasteel on the MoveTatasteel NSE:TATASTEEL on the Move. You can make a safe Target for 160 and exit.

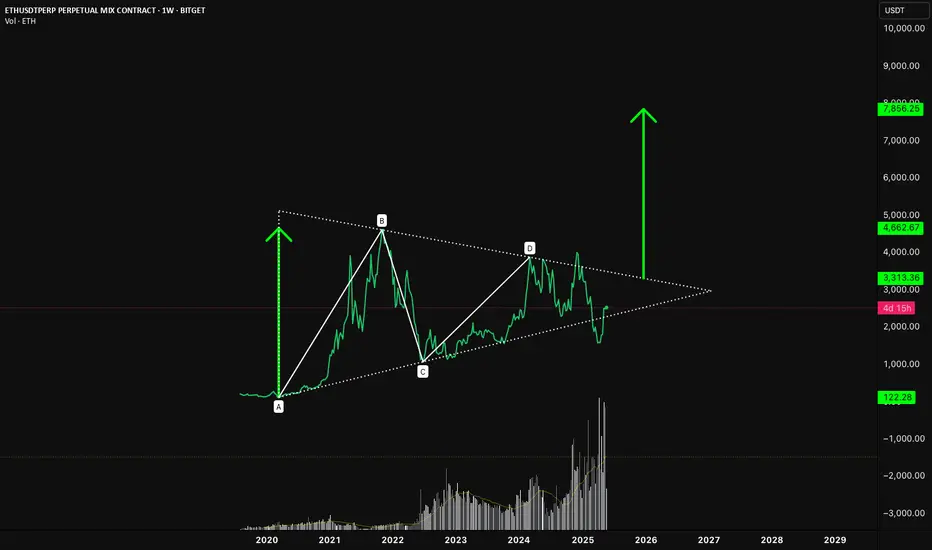
ETH/USDT – The Ethmuda TriangleZoom out.
Since the 2021 highs, Ethereum has spent years grinding sideways, printing what now looks like a textbook symmetrical triangle. Labeled here as an ABCD compression pattern, this structure has been tightening since the macro top (B), slowly building energy within narrowing volatility.
🔺 Structure Breakdown:
• A to B: The explosive bull run from the March 2020 low to the all-time high.
• B to C: A deep correction that shook out weak hands and set the bottom.
• C to D: A multi-year coil of consolidation, forming higher lows and lower highs.
• D to ?: We’re now nearing the apex, where compression typically leads to expansion.
📍 The Trigger Zone
The key level to watch is $4,000–$4,200. A clean breakout above this zone would invalidate the downtrend line and break the triangle to the upside. From a pattern-measured move perspective, the height of the triangle (A to B) projected from the breakout point suggests potential upside into the $7,800–$8,000 region.
🧠 Why This Matters
• Volume has been tapering throughout the structure — classic behaviour in large triangles.
• Market sentiment remains uncertain, making a breakout all the more impactful.
• Ethereum fundamentals are arguably stronger than they were in 2021 — Layer 2s, institutional use cases, and new ETH ETF speculation all add fuel.
📊 Potential Target:
• Immediate resistance: $3,300
• Breakout trigger: $4,000–$4,200
• Projected move: ~$8,000
🕰️ When? Well.. who knows but it does sort of line-up with my previous idea using a SOL/USDT chart that says early next year.. and not this year.
This is the type of setup plays out pretty well on lower timeframes, why not a massive one? The real question is: Are we on the verge of expansion after compression?
Let the chart do the talking.
⚡️ Not Financial Advice
US30 SHORT1. This is the deciding factor as it is at the high created last week and should have a lot of resistance
2. M15, M30 and H1 are overbought and there is a double top with divergence
3. This is a type 2 pattern on H4 however there is a smaller pattern on M15 below
4. Stop loss of 200 pips

BTC: Next Big Move is Brewing – $116K Target Locked!🚀 Hey Traders! 👋
If you’re finding value in this analysis, smash that 👍 and hit Follow for high-accuracy trade setups that actually deliver! 💹🔥
Bitcoin has been following a highly consistent rally-consolidation-breakout pattern over the last few weeks — each time breaking out with nearly +10% upside moves after forming solid accumulation zones. 📈
📊 Observational Pattern:
Let’s break it down:
Phase 1 (April 19–21)
Accumulation range: GETTEX:82K –$84K
Breakout: ~11% gain to ~$93K
Phase 2 (April 25–May 7)
Range: ~$91K–$94K
Breakout: ~10% rally to ~$103.5K
Phase 3 (Current Zone: May 9–Now)
Range: ~$101K–$104K
Price is consolidating, showing signs of continuation.
🧠 What the Chart is Telling Us:
Bitcoin is forming a bullish continuation structure (like a stepping staircase) — a pattern often seen in strong trending markets.
Each green box (marked in chart) represents a clear demand zone followed by a breakout.
If this pattern repeats, we can expect a move towards $114K–$116K.
Invalidation Level: A daily close below $101K would break the rising support and flip sentiment short-term bearish.
✅ Summary:
Target: $114K–$116K
Invalidation: Daily close < $101K
⚠️ Trade with discipline. Let the chart confirm before aping in.
We’ll keep updating as the setup evolves — pin this for reference. 🧠

Havells India - Tend ChangeNSE:HAVELLS Trend has changed. 1st Target would be 1782 and this can go upto 1960, if it sutains, which is Risk Reward. However if you are planning for the 1960, please keep stop loss as 1782 and proceed. This is to ensure you get the Virtual Money for which you have put your efforts!!

HK50 Short 1. This trade is against the H4 trend however, there is a pattern on M15 and M30
2. All timeframes are overbought, and there is a triple top with divergence
3. This is the week's high, and it will have a lot of resistance at this level.
4. Stop loss of 200 pips
5. 1st target is at 23150

Solana - This just faked out literally everybody!Solana - CRYPTO:SOLUSD - just faked out literally everybody:
(click chart above to see the in depth analysis👆🏻)
Over the course of the past 25 days, Solana dropped a significant -30% and wiped out a ton of bulls before creating a complete reversal. Especially with the current horizontal support level, bulls are taking over again, offering us another major crypto trading opportunity.
Levels to watch: $120, $250
Keep your long term vision!
Philip (BasicTrading)

NASDAQ SHORT1. All timeframes are massively overbought with RSI
2. There is a triple top on H1 and H4 with a lot of divergence
3. Trend is still up, so look to exit with any indicator
4. There is a AB=CD pattern on H1 and H4 which shows that this trade will finally retrace
5. Target 1 is at 20200
6. Previous days high is not broken which shows there is a lot of resistance at this level.

Massive GER30 Short 1. This trade is at an all-time high and has made a double top on weekly with massive divergence
2. H4 is overbought and has a double top with divergence as well
3. This will indicate a fall until H4 is oversold to compensate for the sharp movement up
4. Stop loss of 250 pips
5. There is a Deep Crab pattern on M15

Gold (XAU/USD) Analysis – Technical + Fundamental OutlookTechnical Outlook
Gold is currently trading inside a descending channel and has reached the midline, which is acting as dynamic resistance.
📍 Key Levels:
Resistance: 3310 – 3320 (aligned with the midline of the channel) – price has not yet confirmed a breakout above this zone
Next Bullish Targets: 3350 – 3358 / 3385 – 3390
Support Zone: 3270 – 3280 (potential bullish re-entry area)
🟣 All key price levels are marked on the chart with light purple lines for clarity.
🟠 RSI is near 65, showing bullish momentum but approaching overbought territory, signaling a possible short-term pullback.
🔁 Likely scenario: A minor correction toward 3270–3280 followed by continuation toward 3350+ if support holds.
Fundamental Context
The ISM Services PMI came in stronger than expected (51.6 vs. 50.2 forecast), reflecting economic resilience in the U.S. This typically supports the USD and weighs on gold, but:
Rising tariff threats from Trump raise recession concerns.
Services Prices Index rose to 65.1, signaling growing inflation pressures.
These inflation concerns may impact the Fed’s upcoming rate decisions.
Central bank demand and geopolitical risks continue to support gold medium-term.
Summary
Despite being inside a descending channel, gold is showing short-term bullish strength. A confirmed break above 3320 could open the way toward 3350+. Otherwise, a pullback to the 3270–3280 area may offer the next setup.

Godshield Icon’s Gold Hunt: I Went Short at $3,305.69—Hey fam, I went short on XAU/USD at $3,305.69 on the M30 chart from April 25, 2025, at 09:02 PM WAT, and I’m here to break down my trade setup for you. I’ve been hunting gold all week, balancing my trades with my passions like curating scents at Icon Collections Store, and I’m excited to share this move. Let’s recap the setup, see how it aligns with my checklist, and make this interactive—grab a smoothie from Tastequest.com and let’s dive in!
The XAU/USD M30 chart shows gold at $3,305.51 (sell price) as of 09:02 PM WAT on April 25, 2025, after a drop from $3,306.57 earlier in the session. I entered my short at $3,305.69, just above the current price, aiming to capitalize on the bearish momentum. The chart highlights a bearish order block at $3,306.21, labeled "SELL 0.03," where smart money distributed before the sharp drop to $3,294.71 earlier in the session (as seen in your previous chart). Price retested this order block and rejected it, dropping to $3,305.51, which aligns with my entry at $3,305.69.Let’s run through my checklist to see how this trade fits your criteria, which you’ve fine-tuned over six months:Harmonic Patterns: No specific XABCD structure like a bearish shark is visible here, but the bearish momentum aligns with my earlier analysis this week—bearish three drives, head and shoulders, and a bearish shark on April 25, suggesting the downtrend continues.Market Structure: Bearish continuation is clear—lower highs and lower lows after the drop from $3,306.57. The break below $3,306.21 (the order block) confirms sellers are in control, aligning with the break of structure (BOS) I often look for, as seen on your April 27 chart.Order Blocks: Confirmed at $3,306.21, where sellers distributed. My entry at $3,305.69 came after the retest and rejection of this zone, as price dropped to $3,305.51, validating the bearish order block.Volume Profile: Not visible, but I’d expect high volume at $3,306.21, where sellers defended, and a Fair Value Gap below acting as a magnet, likely near $3,294.71, the session low.Top-Down Analysis: H4 and H1 (not shown but implied) are bearish, as I’ve noted this week with gold dropping from $3,499.99 on April 22. M30 narrows the setup, and M15 would be my strike zone for the retest of $3,306.21 as resistance.Heikin Ashi: Not visible here, but I prefer red candles for sells. Given the bearish momentum and the drop after my entry, I’d expect red Heikin Ashi candles on M15, confirming my sell.Fibonacci: Drawing Fibs from the high at $3,306.57 to the low at $3,294.71, the 38.2% retracement is around $3,299.21, and the 61.8% is near $3,302.21. My entry at $3,305.69 is just above the 61.8%, and I’m targeting the 0% Fib at $3,294.71.Gann Theory: Not drawn, but the descending trendline from my earlier charts points to a target near $3,294.71, aligning with Gann angles I often use.MACD and RSI: Not shown, but based on my system, I’d expect a bearish crossover with a negative histogram on MACD and RSI below 50, likely showing bearish divergence at $3,306.21, as noted in my follower note.Risk Management: I risk small to win big. My sell at $3,305.69, stop-loss above the high at $3,306.57 (88 pips risk), and take-profit at $3,294.71 (1098 pips reward) gives a 1:12.5 reward ratio—higher than my usual 1:3, but I’m aiming for the session low given the strong momentum.Confirmation: I wait for all pieces to align. The retest of $3,306.21, bearish momentum, and likely red Heikin Ashi on M15 were my signals. I entered at $3,305.69, just after the rejection, which is slightly early but still within the order block zone.
Trade Assessment: My entry at $3,305.69 is solid, as it’s within the order block zone and follows the rejection at $3,306.21. However, in my last message, I suggested waiting for a pullback to $3,306.21 for the best entry, which would’ve given a slightly better risk-reward ratio (36 pips risk, 114 pips reward, 1:3 ratio). Entering at $3,305.69 means I jumped in a bit early, but the trade is still valid given the bearish momentum and rejection. I’m targeting $3,294.71, the session low, with a stop-loss at $3,306.57 to protect against a liquidity grab. This trade aligns with my system, which I’ve rated a ten out of ten, but I need to work on my patience—waiting for that exact retest could’ve optimized my entry, as I’ve missed timing before (like on April 23 when I entered a sell late at $3,310 instead of $3,315).
What do you think, fam? Was my short at $3,305.69 a good move, or should I have waited for $3,306.21 as I initially planned? Drop your thoughts below—I’m curious to hear how you’d play this XAU/USD setup! If you’re one of the two ready to join me at Academia for Forex Trading, let’s talk—we’ll hunt these markets together. And while you’re at it, check out Icon Collections Store—does RiverSide, Desire, or Icoca vibe with your trading energy? Let me know!

Godshield Icon Entries on Gold market Hey fam, someone’s asking if I’m going short on the gold market right now or waiting for confirmation at $3,300, and I’m here to spill the tea on my XAU/USD M30 strategy. I’ve been hunting gold all week, balancing my trades with my passions like curating scents at Icon Collections Store, and I’m ready to dive into this setup. Let’s break it down with my checklist, share my thoughts, and make this interactive—grab a smoothie from Tastequest.com and let’s talk!

Head and shoulder - sellThis is a possible head and shoulder pattern, one neckline is broken and price is creating another shoulder aka pullback before heading down in a reversal after price attempted to push up.

SBICARDNSE:SBICARD
Note :
1. One should go long with a Stop Loss, below the Trendline or the Previous Swing Low.
2. Risk :Reward ratio should be minimum 1:2.
3. Plan your trade as per the Money Management and Risk Appetite.
Disclaimer :
>You are responsible for your profits and loss.
>The idea shared here is purely for Educational purpose.
>Follow back, for more ideas and their notifications on your email.
>Support and Like incase the idea works for you.

GRASIMNSE:GRASIM
Note :
1. One should go long with a Stop Loss, below the Trendline or the Previous Swing Low.
2. Risk :Reward ratio should be minimum 1:2.
3. Plan your trade as per the Money Management and Risk Appetite.
Disclaimer :
>You are responsible for your profits and loss.
>The idea shared here is purely for Educational purpose.
>Follow back, for more ideas and their notifications on your email.
>Support and Like incase the idea works for you.

US500 Historical Rallies & Pullbacks with a Potential ProjectionI’ve observed the US500’s performance over the years, marking rallies with a blue line and pullbacks with a yellow line. Looking at the chart, a systematic repetition of these movements emerges, which, at first glance, seems to follow a recognizable pattern.
Specifically, I’ve cloned the blue line from the rally that started on 03/23/2020 and ended on 12/20/2021, now represented by a green line, to hypothesize a potential future rally. This clone is based on the duration of previous pullbacks:
The first pullback, before the 2020 rally, began on 02/20/2020 and ended on 03/23/2020.
The second pullback, the current one, started on 02/17/2025 and might conclude around 04/07/2025, potentially paving the way for a new rally.
the angle of those pullbacks is almost identic
This "snapshot" observation suggests we could be nearing a turning point. Of course, this is just a hypothesis based on historical patterns, and I encourage cross-referencing it with other indicators or analyses. What are your thoughts?

BANKNIFTYNSE:BANKNIFTY
CURRENTLY DOESNT LOOK GOOD TO INVEST,
LONG TERM TRENDLINE BROKEN.
ONE SHOULD WAIT FOR FURTHER SUPPORT ON WEEKLY BASIS.
LOOKS TOUGH SHORT TERM AND MID TERM !!!!!!!
Note :
1. One should go long with a Stop Loss, below the Trendline or the Previous Swing Low.
2. Risk :Reward ratio should be minimum 1:2.
3. Plan your trade as per the Money Mangement and Risk Appetite.
Disclamier : You are responsible for your profits and loss.
The idea shared here is purely for Educational purpose.
Follow back, for more ideas and their notifications on your email.
Support and Like incase the idea works for you.

LONG AMD: Keep it simple trends, time and duration3 Positions in AMD from 2018-2025
Duration of trades: 106 - 1,064 days
Gains: +217% - +917%
Closing in on the trend line, look for a bounce at the line or likely if it goes under, wait for a rally back above the line. This chart is set at the daily timeframe. If you trade on the minor volatility within the major trend, I've found the 2 hour timeframe using a combination of indicators, Relative Trend Index and HH and LL, net favorable results.

$NVIDIA ─ Wyckoff Distribution #4 aka Rising Wedge PatternVANTAGE:NVIDIA ─ Wyckoff Distribution #4 aka Rising Wedge Pattern
Although Rising wedge turning into more like Rising Channel distribution idea is still valid.
#2 Long Trade TP1 Hit so far 🔥
------------
------------
Note: This is the most positive outcome possible.
As always, my play is:
✅ 50% out at TP1
✅ Move SL to entry
✅ Pre-set the rest of the position across remaining TPs
It's important to take profits along the way and not turn a winning trade into a losing trade.

EUR/USD - Bull Flag Pattern Breakout in ProgressThis EUR/USD 1-hour chart showcases a classic Bull Flag Pattern , a strong continuation formation indicating the potential for further upside momentum.
- The pair experienced a sharp bullish impulse move, forming the flagpole.
- The price then entered a consolidation phase within a downward-sloping channel, forming the flag.
- A breakout above the upper trendline of the flag could confirm a continuation of the uptrend.
Traders should monitor key resistance levels and volume confirmation upon breakout. A successful retest of the flag's resistance as new support could provide a strong buying opportunity, with the next target potentially aligning with the flagpole’s measured move projection.
As always, apply risk management and consider additional confluences such as Fibonacci levels, moving averages, or fundamental factors.

Bitcoin Analysis: Potential Path to $150K and Market TrendsCurrent Price & Key Levels
- BTC/USDT Price: BINANCE:BTCUSDT (as per chart).
- Critical Support: Bottom of the ascending channel .
- Key Resistance: Upper trendline of the channel (to be confirmed).
Technical Signals
1. Ascending Channel:
- Price is at the bottom of the channel, historically a bounce zone.
- A break above the upper trendline could signal a bullish continuation.
2. Moving Averages:
- SMA 200 (4H) and SMA 20 (1D) are critical for trend confirmation.
- A bullish crossover (e.g., SMA 20 > SMA 200) would strengthen the buy signal.
3. Dominance (BTC.D):
- If Bitcoin dominance turns bearish, expect capital rotation into altcoins (altseason potential).
- Monitor dominance alongside price action for market shifts.
$150K Target: When and How?
- Scenario 1:
- A strong breakout from the ascending channel + rising volume → Acceleration toward $150K.
- Timeline:Mid-2025/Late-2025 (historically aligns with post-halving cycles).
- Scenario 2:
- Slow grind upward with corrections → $150K likely by 2026, pending macroeconomic stability (e.g., ETF inflows, regulatory clarity).
Altcoin Season Watch
- Trigger:
- If Bitcoin’s dominance drops below 57%, altcoins may surge.
- Focus on high-cap alts (ETH, SOL) and narratives like AI, DePIN, or RWA.
Trade Strategy
- Entry:
- Buy on confirmed breakout above the channel + SMA crossover.
- Stop Loss:
- Below the channel’s lower trendline (e.g., $80,000).
- Take Profit:
- targets: $100,000.120,000
- Final target: $150,000 (scale out profits).
Risks to Monitor
- Macro Factors: Fed rate decisions, geopolitical tensions.
- Bitcoin ETF Flows: Sustained inflows/outflows impact momentum.
- Regulation: Crackdowns or approvals (e.g., ETH ETF).
---
Conclusion
- Bullish Outlook: $150K is achievable if Bitcoin holds the ascending channel and dominance remains stable.
- Altseason Hedge: Prepare a basket of altcoins if BTC.D trends downward.
Like, comment, and follow for updates! 🚀
