22.05.25 Morning ForecastPairs on Watch -
FX:EURUSD
FX:EURGBP
FX:GBPJPY
A short overview of the instruments I am looking at for today, multi-timeframe analysis down to what I will be looking at for an entry. Enjoy!
Patterns

NZDUSD Bearish Setup🔍 Market Structure Analysis
WSD Zone Rejection (Top):
Price tapped a wick-based supply & demand (WSD) zone at the top around 0.59486.
That zone also aligns with the previous liquidity grab + mitigation of the OB.
Price is now rejecting that area — forming a lower high (LH) inside the zone → classic sign of distribution.
Rising Channel Break:
Price was rising inside the red ascending channel.
Currently showing bearish intent, with multiple internal BOS (breaks of structure).
If price closes below the channel, that confirms bearish expansion.
Downtrend from Premium Zone:
We're clearly in premium pricing, where institutions prefer to offload longs.
This area also completes a liquidity sweep of prior highs inside the WSD zone.
🧠 Trade Logic (Sell Setup)
🔺 Entry Zone: Inside or after rejection of WSD at 0.59486.
🛑 Stop Loss: Just above the WSD zone and local high.
🎯 Take Profits:
TP1: 0.58669 → Local support + lower WSD zone (reaction zone).
TP2: 0.58398 → Previous liquidity pool and external low.
🧾 R:R = Clean 1:4.5+, textbook SMC setup.
📌 Confluences for Bearish Bias
✅ Multiple WSD zones tested with bearish rejection.
✅ Rising channel inside premium is breaking.
✅ Mitigation + BOS on smaller TF.
✅ News candle marked by blue vertical line may act as final volatility spike before continuation.
✅ Price is near VWAP/50% equilibrium → Ideal for smart money to expand to downside.
🧯 Invalidation Conditions
❌ If price closes above 0.59486, we reassess the bias.
❌ A re-entry into the upper WSD with strong bullish volume invalidates the current bearish flow.
🔮 Forecast Summary
This is a classic distribution setup with liquidity engineered into a WSD zone, now showing early mitigation and markdown signs. Unless major manipulation occurs, expect price to expand toward the 0.58398 low in the next 24–48 hours.

21.05.25 Morning ForecastPairs on Watch -
FX:GBPAUD
FX:EURNZD
FX:GBPJPY
A short overview of the instruments I am looking at for today, multi-timeframe analysis down to what I will be looking at for an entry. Enjoy!

20.05.25 Morning ForecastPairs on Watch -
FOREXCOM:COFFEE
FX:EURUSD
FX:AUDJPY
A short overview of the instruments I am looking at for today, multi-timeframe analysis down to what I will be looking at for an entry. Enjoy!

19.05.25 Morning ForecastPairs on Watch -
FX:GBPJPY
FX:CADJPY
FOREXCOM:COFFEE
A short overview of the instruments I am looking at for today, multi-timeframe analysis down to what I will be looking at for an entry. Enjoy!

LUNC Bullish Inverted Head and Shoulders – Target Ahead!🚀 SEED_DONKEYDAN_MARKET_CAP:LUNC Bullish Inverted Head and Shoulders – Target Ahead! 📈
SEED_DONKEYDAN_MARKET_CAP:LUNC has formed a bullish inverted head and shoulders pattern. If confirmed, the first target could be the green line level! 📊
Let’s catch this breakout together! 💼💸

DEGEN Testing Red Resistance – Breakout Potential!🚀 DEGEN Testing Red Resistance – Breakout Potential! 📈
DEGEN has formed a red resistance zone, where we’re seeing some sellers stepping in. If the price breaks through, the trend could continue with the first target at the green line level! 📊
Let’s watch for that breakout together! 💼💸

CRV Head and Shoulders Pattern Formed – Breakout Confirmed🚨 CRV Head and Shoulders Pattern Formed – Breakout Confirmed 📉
CRV has formed a head and shoulders pattern and has already broken out of the neckline. This could signal the start of a potential downtrend, with further downside ahead. 📊
Let’s monitor this downtrend together! 💼💸

PENDLE Bearish Head and Shoulders – Potential Pullback at the Ne CRYPTOCAP:PENDLE Bearish Head and Shoulders – Potential Pullback at the Neckline 📉
CRYPTOCAP:PENDLE has formed a bearish head and shoulders pattern. We could see a potential pullback at the neckline before the price moves down to the green line level as the next target. 📊

DEXT Potential Inverted Head and Shoulders – Bullish Setup! 🚀 $DEXT Potential Inverted Head and Shoulders – Bullish Setup! 📈
$DEXT is potentially forming an inverted head and shoulders pattern! 🧠 This bullish pattern could signal a strong move to the upside if confirmed. 📊
Let’s catch this breakout together! 💼💸

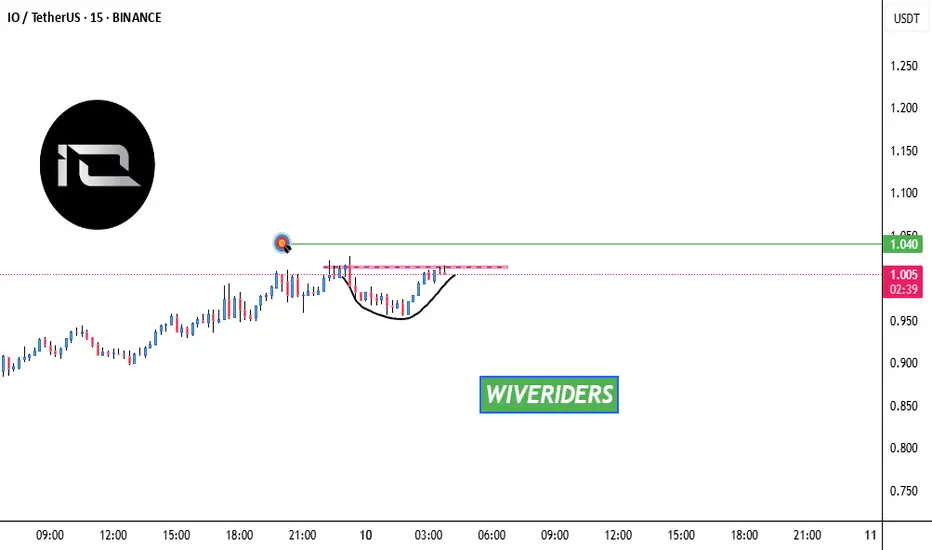
Bullish Cup with Handle🚀 SEED_ALEXDRAYM_SHORTINTEREST2:IO Forming Bullish Cup with Handle – Breakout Potential! 📈
SEED_ALEXDRAYM_SHORTINTEREST2:IO is forming a potential bullish cup with handle pattern! 🧠 If the price breaks the red resistance, the first target could be the green line level! 🔥
Let’s catch this breakout together! 💼💸
MANA Testing Red Resistance🚀 OTC:MANA Testing Red Resistance – Target Ahead! 📈
OTC:MANA is currently testing the red resistance zone. If the price breaks through, the target could be the green line level! 📊
Let’s watch this breakout together! 💼💸
09.05.25 Morning ForecastPairs on Watch -
FX:EURCAD
FX:USDCHF
FX:EURUSD
FOREXCOM:COFFEE
Heads up guys!! I will be heading to Greece today so next week my morning forecast videos may not be as consistent, due to internet and just not having my full equipment, so I will do my very best to get some forecasting posted for you all!
A short overview of the instruments I am looking at for today, multi-timeframe analysis down to what I will be looking at for an entry. Enjoy!

Testing Red Resistance – Breakout Potential!🚀 $PNUT Testing Red Resistance – Breakout Potential! 📈
$PNUT is currently testing the red resistance zone. If the price breaks through, the first target could be the green line level! 📊
Let’s catch this breakout together! 💼💸

08.05.25 Morning ForecastPairs on Watch -
FX:AUDCAD
FX:EURCAD
FX:USDCHF
FOREXCOM:COFFEE
A short overview of the instruments I am looking at for today, multi-timeframe analysis down to what I will be looking at for an entry. Enjoy!

BTC - Will history repeat itself?In this description, I will compare the current price action of BTC with the market behavior seen in 2021. Both cycles share notable similarities in their structure.
-------------------------------
2021 bullmarket
During the 2021 bull market, BTC displayed classic topping price action. The chart showed slightly higher highs and higher lows, eventually forming a bearish Head & Shoulders pattern. This signaled a shift in momentum, and BTC subsequently broke down, confirming the bearish outlook.
At the lows later in 2021, Bitcoin’s price action became more corrective, with slightly lower lows and lower highs-often an early indication of a potential trend reversal. That reversal materialized as BTC launched into a strong impulse move to the upside, rallying all the way to the key Golden Pocket Fibonacci level before experiencing a modest retracement.
Following this healthy pullback, BTC gathered enough strength to break through resistance and surge to a new all-time high (ATH), which ultimately marked the peak of that bull cycle.
-------------------------------
This bullmarket
In the current bull market, BTC formed a classic double top pattern, echoing similar setups from previous cycles. After reaching highs near $110k BTC experienced a significant correction, dropping to around $74k. At this level, the price action turned corrective, with a series of slightly lower lows and lower highs-reminiscent of the consolidation seen at the 2021 market bottom.
During this consolidation, BTC established three notable lows, forming a potential base for a reversal. Following this corrective phase, BTC surged upward in a strong impulse move, reaching the critical Golden Pocket-the 61.8% to 65% Fibonacci retracement zone, which is widely regarded as a key area for potential reversals or continuation of trends.
Currently, BTC is consolidating near this Golden Pocket. Traders are watching closely to see if the price will face rejection here, as it did in 2021, or if it can break above and sustain a new uptrend. The outcome at this level will likely determine whether the next major move is a continuation to new highs or a deeper retracement.
-------------------------------
Conclusion
When comparing the corrections following the 2021 and 2025 peaks, the similarities are striking. Both cycles feature a bottom formed through a similar pattern, followed by a strong move up to the Golden Pocket Fibonacci level. The key question now is whether BTC will experience another corrective pullback before making a renewed attempt at the all-time high, or if it will break through resistance and continue its upward momentum. Only time will tell which path the market will choose.
-------------------------------
Thanks for your support.
- Make sure to follow me so you don't miss out on the next analysis!
- Drop a like and leave a comment!

07.05.25 Morning ForecastPairs on Watch -
FOREXCOM:COFFEE
FX:EURCAD
FX:USDCHF
A short overview of the instruments I am looking at for today, multi-timeframe analysis down to what I will be looking at for an entry. Enjoy!

06.05.25 Morning ForecastPairs on Watch -
FOREXCOM:COFFEE
FX:AUDJPY
FX:GBPUSD
FX:USDCHF
A short overview of the instruments I am looking at for today, multi-timeframe analysis down to what I will be looking at for an entry. Enjoy!

XAU/USD Market Outlook – Key Levels & Scenarios (May 2025)📊 Market Overview
Asset: XAU/USD (Gold vs. USD) – likely
Timeframe: 🕒 4H or Daily
EMAs:
🔴 50 EMA = 3,281 (short-term trend)
🔵 200 EMA = 3,179 (long-term trend)
🧱 Key Zones
🔺 Main Resistance Zone (🚫 Supply Area)
📍 ~3,320–3,400
🔍 Observation: Strong rejection zone with multiple failed attempts. 🚧 Price struggles to break and hold above here.
⚖️ Mid Support & Resistance Zone
📍 ~3,200–3,250
🧭 Current Action: Price is consolidating here. This is a key decision zone. A bounce or breakdown will likely decide the next big move. 🤔
🟦 Main Support Zone
📍 ~2,980–3,030
🛑 Observation: Major demand zone. If price falls here, it might attract buyers 👥 for a potential rebound.
📉 EMA Analysis
🔴 50 EMA is above 🔵 200 EMA → Trend still technically bullish ✅
🟡 BUT: Price is currently below 50 EMA, showing short-term weakness ⚠️
⚡️ 200 EMA is nearby (~3,179): Acting as dynamic support — a critical bounce zone! 🛡️
🔮 Scenarios
🐂 Bullish Path
✅ If price bounces from 3,200 support zone and reclaims 🔴 50 EMA:
🎯 Target: Retest of 3,320–3,400 🔺 zone
📈 Confirmation: Strong candle closing above 3,281 🔴 EMA
🐻 Bearish Path
🚨 If price breaks below 3,200 & 200 EMA:
🕳️ Expect drop towards 2,980–3,030 🟦 zone
📉 Confirmation: Candle closes below 3,179 with weak retest
✅ Conclusion
📍 Key Level to Watch: 3,200
⚖️ Market Sentiment: Neutral → Bearish bias unless price reclaims 50 EMA
🔒 Risk Tip: Avoid longs until price confirms bullish structure again 🔐

05.05.25 Morning ForecastPairs on Watch -
FX:USDCHF
FX:AUDUSD
FX:AUDCAD
FOREXCOM:COFFEE
A short overview of the instruments I am looking at for today, multi-timeframe analysis down to what I will be looking at for an entry. Enjoy!

A Bitcoin Prediction (2025)In this chart, we continue the journey of testing whether Bitcoin can live up to the expectations as published in my previous Bitcoin prediction chart (2024). Since we had technically hit my ATH cycle top for 2024–25, we are now gambling with the possibility that we might not have hit the highest cycle top targets and may just extend that little bit more. I think 2025 has most people asking, "Are we done yet?" or are we on the verge of something else? We'll just have to wait and see....
Upside:
As you can see in ATHs, there are several targets, and I've mentioned this in my previous chart. Ultimately, the high side of what this chart can expect from a cycle high is a 2-week close of $131k. Wicks can extend beyond this price, but I expect a close below (according to this chart). A close above will invalidate this chart. All prices within the lows and highs are acceptable.
Downside:
In my previous chart, I hadn't posted any projected targets during a bear market; I only highlighted the lows, as generally that is what most may consider important enough to know—when can we resume the bull market again? Well, in this chart, I have labeled two additional downside targets. Although these do not follow the same pattern as other targets, they do have a significant similarity to previous cycle lows. Expect bounces from these levels, but if the pattern holds true, they will fail and continue to lower prices. In the short term, resistance sits at $98,511, and again this is on a 2-week close. So this next week, we can wick above, which might be the path we are on.
Summary: I'll be posting updates close to each 2 week close, if I see something I'll be sure to post and update.
2024 Chart linked below.

AI16Z Forming Cup and Handle Pattern🚨 $AI16Z Forming Cup and Handle Pattern 🚨
$AI16Z is forming a cup and handle pattern and is currently waiting for a breakout above the red resistance zone. If the breakout is confirmed, the target will be the green line level.
📈 Technical Overview:
Pattern: Cup and Handle
Resistance Zone: Red area currently being tested.
🎯 Breakout Target: Green line level upon confirmation.

Mastering chart patterns - How to use them in trading!Chart patterns are visual formations created by the price movements of a financial asset—like a stock, currency, or cryptocurrency, on a price chart. Traders use these patterns in technical analysis to predict future market direction based on historical behavior. The main chart patterns are the reversal and continuation patterns.
-------------------------------
What will we discuss?
- Bullish reversal patterns
- Bearish reversal patterns
- Bullish continuation patterns
- Bearish continuation patterns
-------------------------------
Bullish reversal patterns:
Double bottom
A double bottom in trading is a bullish reversal pattern that signals the potential end of a downtrend and the beginning of an uptrend. It forms when the price of an asset falls to a low, bounces back up, then drops again to roughly the same low before rising once more. This creates a "W" shape on the chart.
How to trade it:
Before entering a trade, wait for the price to break back above the neckline with strong volume, as this indicates a potential bullish reversal. Once the breakout is confirmed, look for an entry on the pullback to the neckline.
Inverted head and shoulders
An inverted head and shoulders is a bullish reversal pattern that typically forms after a downtrend and signals a possible shift to an uptrend.
It consists of three parts:
* The left shoulder, where the price makes a low and then bounces.
* The head, which is a deeper low followed by another bounce.
* The right shoulder, a higher low similar in level to the left shoulder.
How to trade it:
Before entering a trade, wait for the price to break above the neckline with strong volume, as this confirms the pattern and signals a potential upward move. After the breakout, it's important to wait for a retest of the neckline to look for an entry. Traders typically place a stop-loss just below the right shoulder to manage risk.
Falling wedge
A falling wedge is a bullish chart pattern that often signals a potential reversal or continuation of an uptrend, depending on where it forms in a price trend.
It appears when the price is moving lower but within a narrowing range, creating two downward-sloping, converging trendlines. Both the highs and lows are falling, but the lower highs are coming down faster than the lower lows, which shows that selling pressure is losing strength over time.
How to trade it:
Wait for the falling wedge to break above the downward trendline and for the price to reclaim the most recent lower high. A breakout alone isn’t always reliable, sometimes the price moves briefly above the trendline without making a higher high, resulting in a fake-out. To confirm the move, wait for a clear higher high and then look to enter on the retracement that follows.
-------------------------------
Bearish reversal patterns
Double top
A double top is a bearish reversal pattern that signals a potential shift from an uptrend to a downtrend.
It forms when the price reaches a high, pulls back, then rallies again to the same or similar high but fails to break above it. This creates an "M" shape on the chart. The neckline is the support level at the low point between the two peaks. When the price breaks below this neckline with strong volume, it confirms the pattern and suggests that selling pressure is taking over.
How to trade it:
Before entering a trade, wait for the price to break below the neckline with strong volume, as this indicates a potential bearish reversal. Once the breakout is confirmed, look for an entry on the pullback to the neckline.
Head and shoulders
A head and shoulders is a bearish reversal pattern that typically forms after an uptrend and signals a potential shift to a downtrend.
It consists of three peaks:
* The left shoulder, where the price rises and then falls.
* The head, which is a higher peak followed by another decline.
* The right shoulder, a lower high that is roughly equal in height to the left shoulder.
How to trade it:
Before entering a trade, wait for the price to break below the neckline with strong volume, as this confirms the pattern and signals a potential downside move, After the breakout, it’s important to wait for a retest of the neckline to look for an entry. Traders typically place a stop-loss just above the right shoulder to manage risk
Rising wedge
A rising wedge is a bearish chart pattern that often signals a potential reversal or continuation of an downtrend, depending on where it forms in a price trend.
It appears when the price is moving higher but within a narrowing range, creating two upward-sloping, converging trendlines. Both the highs and lows are rising, but the highs are increasing at a faster rate than the lows. This suggests that buying pressure is weakening over time, and the market may be preparing for a downturn.
How to trade it:
Wait for the rising wedge to break below the upsloping trendline and for the price to reclaim the most recent high low. A breakout alone isn’t always reliable, sometimes the price moves briefly below the trendline without making a lower low, resulting in a fake-out. To confirm the move, wait for a clear lower low and then look to enter on the retracement that follows.
-------------------------------
Bullish continuation patterns
Bullflag
A bull flag is a continuation pattern that signals the potential for a price to continue moving upward after a brief consolidation or pullback.
It forms when the price experiences a strong upward move (the flagpole), followed by a period of consolidation or a slight downward movement (the flag). The flag typically slopes downward or moves sideways, and the consolidation phase usually occurs within two parallel trendlines, creating a rectangle or slight downward channel.
How to trade it?
Before entering a position, wait for the price to break above the downsloping trendline and establish a higher high. If the price doesn’t make a higher high, it could be a fake-out. Once a higher high is confirmed, look for an entry on the retracement. The target is typically the length of the flagpole projected upward from the breakout point.
Bullish pennant
A bullish pennant is a continuation pattern that indicates the potential for a price to continue its upward trend after a brief consolidation. It forms when a strong upward move (the flagpole) is followed by a period of consolidation, where the price moves within converging trendlines, creating a small symmetrical triangle or pennant shape. The consolidation typically shows lower highs and higher lows, and the pattern suggests that the market is taking a "breather" before continuing its upward momentum.
How to trade it?
Before entering a position, wait for the price to break above the downsloping trendline and establish a higher high. If the price doesn’t make a higher high, it could be a fake-out. Once a higher high is confirmed, look for an entry on the retracement. The target is typically the length of the flagpole projected upward form the breakout point.
Ascending triangle
An ascending triangle is a bullish continuation pattern that typically forms during an uptrend, signaling that the price is likely to continue moving higher.
It is characterized by a horizontal resistance line at the top, formed by a series of peaks at roughly the same price level, and an ascending support line at the bottom, formed by higher lows. This creates a triangle shape, where the price is gradually compressing between the horizontal resistance and the rising support.
How to trade it?
Before entering a position, wait for the price to break above the horizontal resistance level with strong volume. Once the breakout occurs, look for an entry on the retracement back to this area.
-------------------------------
Bearish continuation patterns
Bearflag
A bear flag is a bearish continuation pattern that suggests the price is likely to continue moving downward after a brief consolidation or upward pullback.
It forms when there is a strong downward move (the flagpole), followed by a period of consolidation or slight upward movement (the flag). The flag typically slopes upward or moves sideways, and the consolidation occurs within two parallel trendlines, creating a rectangular or upward-sloping channel. This pattern shows that, despite the short-term pullback, the overall downtrend remains intact.
How to trade it?
Before entering a position, wait for the price to break below the upsloping trendline and establish a lower low. If the price doesn’t make a lower low, it could be a fake-out. Once a lower low is confirmed, look for an entry on the retracement. The target is typically the length of the flagpole projected downward for the breakout point.
Bearish pennant
A bearish pennant is a bearish continuation pattern that signals a potential continuation of a downtrend after a brief consolidation.
It forms when there is a strong downward move (the flagpole), followed by a period of consolidation where the price moves within converging trendlines, creating a small symmetrical triangle or pennant shape. The consolidation typically shows lower highs and higher lows, indicating that the price is taking a pause before continuing its downward movement.
How to trade it?
Before entering a position, wait for the price to break below the upsloping trendline and establish a lower low. If the price doesn’t make a lower low, it could be a fake-out. Once a lower low is confirmed, look for an entry on the retracement. The target is typically the length of the flagpole projected downward for the breakout point.
Descending triangle
A descending triangle is a bearish continuation pattern that typically forms during a downtrend, indicating that the price is likely to continue moving lower after a period of consolidation.
The pattern is characterized by a horizontal support line at the bottom, formed by a series of lows at approximately the same price level, and a descending resistance line at the top, formed by a series of lower highs. The price contracts between these two trendlines, creating a triangle shape with a downward-sloping upper boundary and a flat lower boundary.
How to trade it?
Before entering a position, wait for the price to break below the horizontal support level with strong volume. Once the breakout occurs, look for an entry on the retracement back to this area.
-------------------------------
Thanks for your support.
- Make sure to follow me so you don't miss out on the next analysis!
- Drop a like and leave a comment!
