AUD/CHF Posssible short opportunityRULES WHICH I FOLLOW:
1.) stop loss for each trade should be about 1% of total account balance.
2.) take profit for each trade 1% - 2%
3.) Max daily loss 5% of total account balance
4.) Max lose 10% of total account balance
5.) Leverage 1:100
"RISK WARNING: YOUR CAPITAL MIGHT BE AT RISK"
This post is not an investment advice.
"CFDs are complex instruments and come with a high risk of losing money rapidly due to leverage. Between 74-89% of retail investor accounts lose money when trading CFDs. You should consider whether you understand how CFDs work and whether you can afford to take the high risk of losing your money."
Patterntrading

What is Rising Wedge pattern and how to trade with that?The Rising Wedge (also known as the ascending wedge) pattern is a powerful consolidation price pattern formed when price is bound between two rising trend lines. It is considered a bearish chart formation which can indicate both reversal and continuation patterns – depending on location and trend bias. Regardless of where the rising wedge appears, traders should always maintain the guideline that this pattern is inherently bearish in nature (see image).
HOW TO IDENTIFY A RISING WEDGE PATTERN ON CHARTS
The rising wedge pattern is interpreted as both a bearish continuation and bearish reversal pattern which gives rise to some confusion in the identification of the pattern. Both scenarios contain a different set of observation dynamics which must be taken into consideration.
Reversal Pattern:
Established uptrend
Rising wedge consolidation formation
Linking higher highs and higher lows using a trend line assembling towards a narrowing point
Look for break below support for short entry
Continuation Pattern:
Established downtrend
Rising wedge consolidation formation
Linking higher highs and higher lows using a trend line assembling towards a narrowing point
Look for break below support for short entry
How to trade with this:
*Entry Point: Right after the candlestick breakout of the support.
*Stop-Loss: At the highest resistance level of the Wedge pattern.
*Take-Profit: From the entry point, the distance is equal to the maximum width ( H ) of the rising wedge pattern.
This is the academic shape of this pattern, in the future we will publish Falling Wedge pattern 📚 . Please follow our page to be informed as soon as the materials are published.
Thank you all for supporting our activity with Likes 👍 and Comments ❤️

ETHUSDT is testing the weekly support The price bounced to 0.618 Fibonacci level on the daily timeframe (2900) and now the market is testing the previous daily support case for new resistance.
on 4h Timeframe, the price created two M patterns and the price is testing the second neckline above the 3100
How to approach?
IF the price is going to lose the weekly support and retest it as new resistance According to Plancton's strategy , we can set a nice order
Be aware to False breakout
–––––
Keep in mind.
🟣 Purple structure -> Monthly structure.
🔴 Red structure -> Weekly structure.
🔵 Blue structure -> Daily structure.
🟡 Yellow structure -> 4h structure.
–––––
Follow the Shrimp 🦐

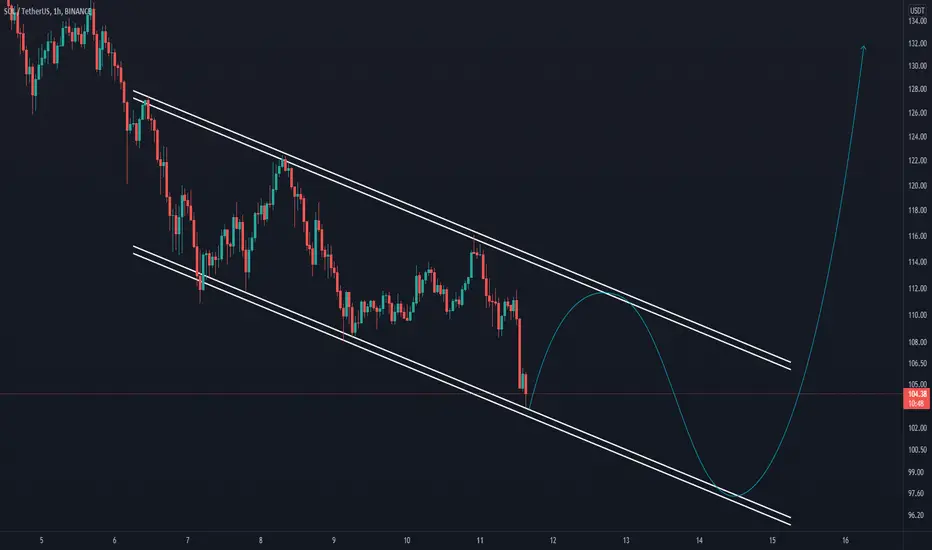
SOLAfter all the falls, it is now in a wedge in one hour time frame. K throws the price up.
It also has its own ascending channel floor in daily timeframe.
BTC Week close Draw Back 2 - great areas to watch & learnOn more hour. This is a great closing week, lots of activity , lots of correlation, Very exciting. Hoping to drop into my hub target.

This could be XAUUSD 's golden year!2011 marked a huge accomplishment for Gold peaking at 1920.
This peak was made possible fundamentally due to inflation brought on by the sub-prime 2008 crisis.
After peaking around 1920 back in 2011, Gold resumed to drop for a consistent 2 year period until 2013.
Between 2013-2019 Gold was trading within a triangle consolidation pattern that broke up June 2019.
Between 2019 to today Gold is trading in a technical weekly up-trend with higher lows.
On my previous bigger picture review of Gold when it was trading around 1800 back in 2020 - I've covered how Gold may continue to rally long-term with consistent new highs.
Gold resumed to rally after my idea was published and peaked at around 2080 just a couple month later, August 2020.
After peaking August 2020 - It resumed to trade down until November 2021, when for the first time we had a higher high on a weekly close.
Since November 2021 a consistent up-trend is ongoing, which started from a double bottom forming around the breakout which is also the weekly support stretching since 2018 connecting lows.
Most recently we have a weekly close above the previous high of 2011 (1920) and connecting highs stretching back a year to early 2021 , also at around 1920 - Together making up very bullish indications, which means a new all time high is targeted.
If this week closes above 1945, expect an extremely strong start to the week for Gold , with 1960, 1980 and 2010 as immediate possible targets.
Inflation , uncertainty , pandemic, war - All bullish factors supporting the bullish technicals reviewed on this weekly chart.
Please like and subscribe if you like my point of view , thanks!

S&P500 - NEARING CORRECTIVE RALLY ENDThe FOREXCOM:SPXUSD is nearing the completion of the corrective move higher. We have just completed the ABCD to the downside with a nice rally later in the US session yesterday to move off the low.
Today we have 2 levels to watch.
Option 1- Temp Bullish.
This will see us head higher into the 4680-4720 area a little higher than the 78% level. Then this would bring the start of the move lower towards 4k. April the 12-13th is a major Monthly AI turn point and astro event. This is where this scenario is lining up nicely.
Option 2 - Corrective move finished.
This more bearish option would take us to the 4550 -4565 area before failing in a 135 bearish pattern.
Either way we are nearing a top or its already in.
I hope this helps.
Let me know your thoughts.

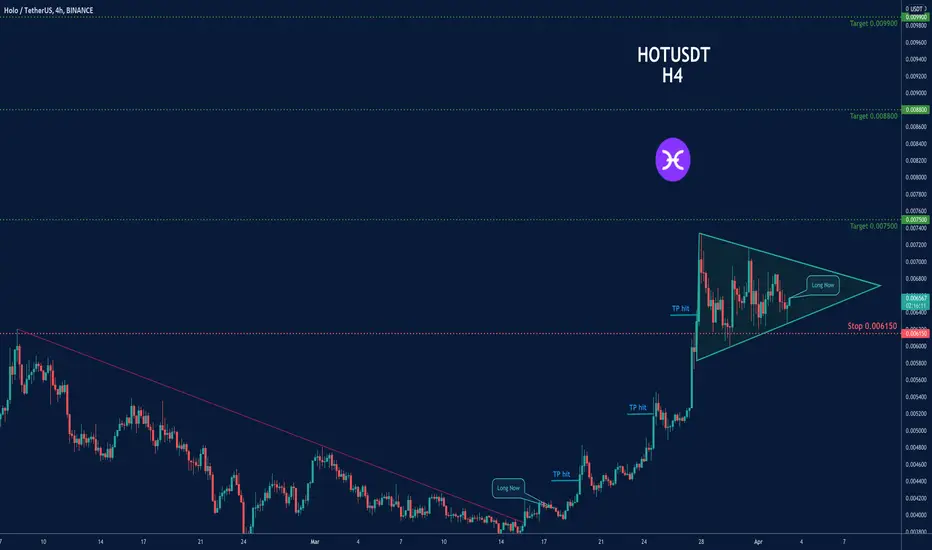
Trading opportunity in HOTUSDT- Symmetrical Triangle PatternBased on technical factors (Symmetrical Triangle Pattern ) there is a long position in :
📊 HOTUSDT
🔵 Long Now 0.006575
🧯 Stop loss 0.006150
🏹 Target 1 0.007500
🏹 Target 2 0.008800
🏹 Target 3 0.009900
💸Capital : 1%
We hope it is profitable for you ❤️
Please support our activity with your likes👍 and comments📝
Will ADA form a head and shoulders?I still hope ADA returns to the $1 KEY area
You can follow my previous analysis of Cardano.

What is Head and shoulders pattern and how to trade with that?*The Head and Shoulders ( Bearish ) pattern is one of the most popular and best known price patterns in trading.
This is a very accurate trading signal if you know how to use it properly and flexibly.
*What is Head and Shoulders? How to identify and characterize
Head and Shoulders is the name of a special type of price pattern that usually appears at the end of uptrends. This is a signal of future downtrends.
It is called Head and Shoulders because the shape of this pattern on the price chart is similar to that of the human body including Left Shoulder, Head, and Right Shoulder.
The line connecting the two troughs of the shoulders is often called the neckline. In fact, this pattern is perfect when the Neckline is horizontal (the prices of the two lows are approximately the same).
How to trade with this:
ENTRY POINT : Right after the candlestick breaks out of the neckline (or at the Retesting the neckline )
STOP-LOSS : At the peak of the right shoulder.
TARGET : Usually, Head and Shoulders is a pattern for starting a downtrend. Therefore, adjust the first target to the height of the neckline to the top (H) of the pattern and adjust the next targets according to the past price and chart.
This is the academic shape of this pattern, in the future we will publish other types of head and shoulder patterns 📚 . Please follow our page to be informed as soon as the materials are published.
Thank you all for supporting our activity with Likes 👍 and Comments ❤️

Multiverse Mid Term HoldMultiverse respecting the curve of the cup, found support on the 200 MA. Buy the breakout of daily resistance. This could be a nice mid term hold.

AUDUSD, Gartley Buy. AUDUSD has just hit the 78.6% Fib level also completing a Gartley.
This is where you get the low risk trades with great risk/reward.
I traded the C-D leg down as this was a completed smaller Gartley pattern.
Now the plan is to either go long to the 0.7280-0.7300 area which would set up a 135 Pattern to sell or we are heading back up to 0.7500 completion of the bigger ABCD.
Yesterday was a down day on lower volume which is why im looking for a bounce today.
AI also to follow.
I hope this helps.
Send me a comment with your thoughts agree or disagree.👍👍

TOTAL CRYPTO MARKET CAP. In this chart I take a look at the Total Market Cap of the Crypto market.
We have a critical date coming up on the 16th of March if we look at the AI. This could be a potential sell off or the start of a rally depending on if we are making a low or a high coming into that date.
As it stands a rally over the next couple of days would set up that sell off but if we get down to the 1.5T level the that could be the start of a big rally.
We have big ABCD patterns at 1.375T and down at 1T, this would scare a lot of people but would be the best time to buy.
Watching for now and looking for set ups in the market.
I will post a couple of charts for the near term.
I hope this helps with the way I look at things. Enjoy the day. 👍👍

🔻 BTC/USD symmetrical triangle patternBTC/USD chart shows me the symmetrical triangle pattern at 4hours time frame we must stay to see price break the top of the triangle or from the bottom but at this moment I can see RSI trend have break the ascending trendline and for me it means more likely to break from below of the triangle .

GOLD to new All Time Highs.. Are we looking at GOLD about to turn into new all time highs.
The last 2 sharp retracements have been 100 points into the 50-61.8% area from the previous rise. If the market repeats then 2163 is the upside target or 2134 is the 1.618% extension from this retracement.
Another option is a rally into 2020 then another leg lower to 1920 before the next run up.
The AI for the day has the GOLD rallying into tomorrow, another piece to add to the puzzle.
Plenty to watch in this market and the constant news events making it jump around so dont forget to use stops.
I hope this helps.. Enjoy the trade. 👍👍

LUNA/USDHello everyone. This is my short term bullish scenario for LUNA/USD pair. As 50 daily EMA and 200 daily SMA are converging with no crossing. I'm expecting the price is up between $108-128. My analysis based on combined trend lines of LUNA previous bullish and bearish price movement which i called 'box-trap' in short with take a look LUNA/USD charts pattern during Nov-Dec'20. This is not my financial advise, please do your own research before you make your own decision.


LINKUSD 13.36 - the crossing watch - buys entered for dipHere we are at the 13.36 line. I am very hopeful we all get some buying opportunities here. id love to see the 7s again. I think id start loading up at 8. Maybe a little taste at 10. So much of what is occurring is manufactured. Participate. Russia just announced a plan basically the same as what the Federal reserve wants. That at the end of the transaction is USD. The vehicle is irrelevant Like a coupon. A stock. Ukraine just legalized it in a similarly regulated way. So even in threat of war the crypto revolution is uniting. How do we appease the Federal Reserve. What if we make a house loan on staked crypto. What if we crowd fund a government. They really wont have that and we don't have the power to stop them. We have the power to make change though. I can not wait to see what is about to emerge.

Projection BTC-USDTPure speculation about BTC-USDT.
I have noticed that each of the first two "consolidation blocks" took 14 days. So this leads me to wonder: will the current consolidation block also last 14 days?
If so, we can expect price to move out of that consolidation block on the 19th, either to the upside or downside.
Not a prediction, just an idea. I know these patterns don't necessarily repeat, however I thought the similarity between the first and the second block was striking enough to highlight it as an idea.
If you like the idea, give me a like :)
Enjoy your evening!

DATAPRP Morning Star Formation or Continue DowntrendPossibility to form morning star, or forming same pattern as first circle or worst continue downtrend.
Entry 0.460, TP1 0.490, TP2 0.530 and cutloss 0.430. If break downtrend line, possiblity of uptrend movement. Trade at you own risk. Comment if you have different idea. Thank you for your time.


C3ai 15 minute chart and patter discoveries.It has a huge pull downward but such long-term potential. This stock's pattern often presents as manipulated. let's see what 2022 brings.

ICP recovery to USDT 22.00 and above, short gain opportunityBased on TEMA 4-hourly chart, this is the beginning of the recovery trajectory and not a likely upwards trend. Profit target of USDT 19.90 is highly likely and USDT 22.00 and above very much possible within the next 96 hours or so. Stop loss IMO at USDT 18.39 or less.
