TATA STEEL at Resistance ZoneThis is Daily Chart of TATA STEEL.
Tata steel having good Law of Polarity at 163-168 range.
If this level is sustain , then We may see lower prices in the stock again.
Tata steel is a good support zone at 125-130 range.
Two EMAs are also supporting the stock, with the first EMA positioned at ₹140 and the second at ₹129.
THANK YOU !!
Patterntrading

ZYDUS LIFESCIENCES AT BEST SUPPORT !!This is the 4 hour Chart of ZYDUSLIFE.
Zydus Lifesciences at good support zone near ₹920–₹930 range.
Zyduslife is moving in a Higher High and Higher Low (HH-HL) formation.
Stock has formed a broadening pattern within the channel.
If this level is sustain, we may see higher prices in ZYDUSLIFE.
THANK YOU !!

06.06.25 Morning ForecastPairs on Watch -
FX:EURUSD
FX:AUDUSD
FX:USDJPY
FX:AUDCAD
A short overview of the instruments I am looking at for today, multi-timeframe analysis down to what I will be looking at for an entry. Enjoy!

BIOCON LIMITED KEY ZONE !!This is the Daily chart of BIOCON LIMITED.
Biocon is currently trading near its pattern resistance zone around the 340 range.
BIOCON has a strong support zone near the 300 range.
Thank You !!

05.06.25 Morning ForecastPairs on Watch -
FX:AUDUSD
OANDA:XPTUSD
A short overview of the instruments I am looking at for today, multi-timeframe analysis down to what I will be looking at for an entry. Enjoy!

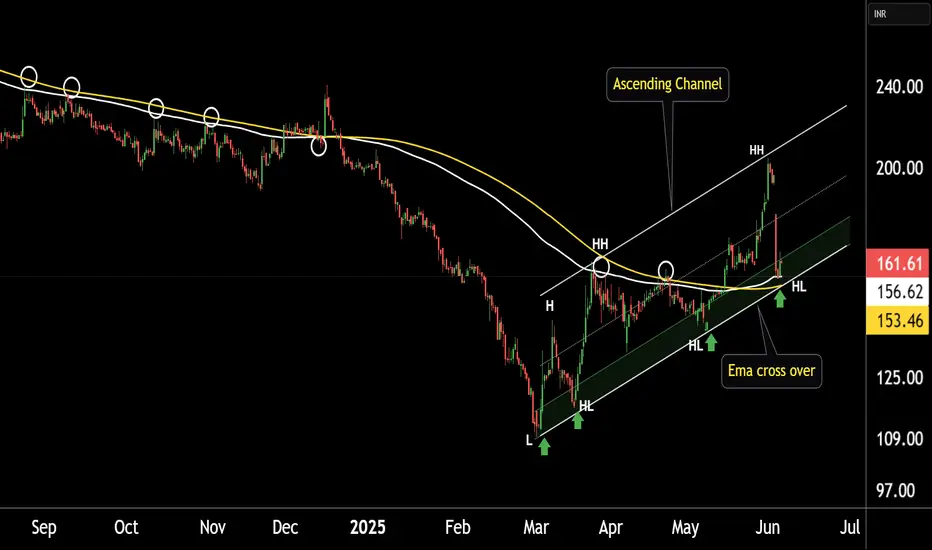
SPARC This is the 4 hour chart of SPARC.
SPARC is currently trading near the support boundary of an ascending channel at 150-155 range.
SPARC has given a positive EMA crossover at price 152-156 range
If this level sustain, we may see higher price in the SPARC.
Thank You !!
Nasdaq - The final bullrun breakout!Nasdaq - TVC:NDQ - might break above all structure:
(click chart above to see the in depth analysis👆🏻)
It is quite incredible how volatile stocks have been lately, especially considering that fact that the Nasdaq is about to create new all time highs again. Consequently, we are about to witness a significant structure breakout, which would ultimately lead to another rally of about +30%.
Levels to watch: $21.000
Keep your long term vision!
Philip (BasicTrading)

ABFRL at Best Support !!This is the Weekly Chart Of ABFRL .
ABFRL having good Law of Polarity at 70 range.
ABFRL having EMA support at 72 range
If this level is sustain , we may see higher price in ABFRL ||
Based on time-wise analysis, our initial expected return is 40–42%, which the stock consistently forms beyond the Law of Polarity (LOP).
Thank You !!

04.06.25 Morning ForecastPairs on Watch -
FX:EURUSD
FX:USDJPY
FX:GBPCHF
OANDA:XPTUSD
A short overview of the instruments I am looking at for today, multi-timeframe analysis down to what I will be looking at for an entry. Enjoy!

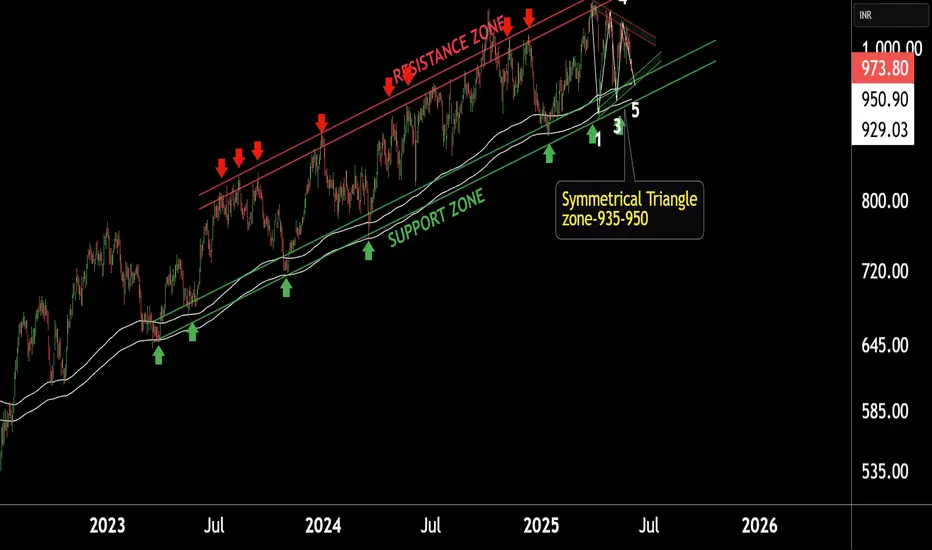
JSW Steel is near its Support LevelThis is Daily chart of JSWSTEEL.
The stock is trading within an Ascending Channel.
It is currently near the lower support zone of the channel, which lies in the ₹920–₹945 range.
Simultaneously, a Symmetrical Triangle pattern is forming with a consolidation range between ₹930–₹950.
The stock is currently taking dynamic support from two EMAs: the first EMA is providing support near ₹245, while the second EMA is acting as a deeper support around ₹230. Both EMAs are helping maintain the stock’s bullish structure."
If this level is sustain , we may see higher prices in the stock.
03.06.25 AUDUSD Trade Recap (Breakeven Manual Close)A long position taken on AUDUSD for a breakeven manual close, full explanation as to why I made this decision in the recap and my current thoughts on this pairs next move

03.06.25 Morning ForecastPairs on Watch -
FX:EURUSD
FX:GBPAUD
FX:AUDUSD
FX:AUDCAD
A short overview of the instruments I am looking at for today, multi-timeframe analysis down to what I will be looking at for an entry. Enjoy!

02.06.25 Morning ForecastPairs on Watch -
FX:AUDUSD
FX:USDJPY
FX:EURGBP
A short overview of the instruments I am looking at for today, multi-timeframe analysis down to what I will be looking at for an entry. Enjoy!

GiftNifty at Best Support !!This is the 4 hour chart of GiftNifty
And GiftNifty having good Law of Polarity at 24500 range
If this level is sustain, then we may see higher prices in GiftNifty
Thank You !!

SWDY Double Bottom AnalysisSWDY stock has rebounded back from the resistance line of 81.97, to reach the support line at 81.163. It shows that the double bottom wasn't a true sign to encourage a bullish reversal pattern.

30.05.25 Morning ForecastPairs on Watch -
FX:EURUSD
A short overview of the instruments I am looking at for today, multi-timeframe analysis down to what I will be looking at for an entry. Enjoy!

Nvidia - The bullish consolidation flag!Nvidia - NASDAQ:NVDA - is still quite bullish:
(click chart above to see the in depth analysis👆🏻)
After Nvidia retested a major horizontal support just last month, we witnessed an extremely strong bullish reversal candle which resulted in a strong +50% rally. Considering the bullish flag consolidation, a breakout is much more likely, but not in the immediate future.
Levels to watch: $150
Keep your long term vision!
Philip (BasicTrading)

29.05.25 Morning ForecastPairs on Watch -
FX:AUDCAD
FX:EURUSD
TVC:USOIL
FX:GBPJPY
A short overview of the instruments I am looking at for today, multi-timeframe analysis down to what I will be looking at for an entry. Enjoy!

28.05.25 Morning ForecastPairs on Watch -
OANDA:AU200AUD
FX:GBPAUD
A short overview of the instruments I am looking at for today, multi-timeframe analysis down to what I will be looking at for an entry. Enjoy!

Ethereum - The bottom is finally in!Ethereum - CRYPTO:ETHUSD - is starting the rally:
(click chart above to see the in depth analysis👆🏻)
Finally, after dropping an expected -65% over the past couple of months, Ethereum is retesting and already rejecting a significant horizontal structure. Together with the strong confluence of support, Ethereum is now creating a long term bottom, initiating the next bullish cycle.
Levels to watch: $2.000, $4.000
Keep your long term vision!
Philip (BasicTrading)

27.05.25 Morning ForecastPairs on Watch -
FOREXCOM:COFFEE
FX:GBPAUD
A short overview of the instruments I am looking at for today, multi-timeframe analysis down to what I will be looking at for an entry. Enjoy!

26.05.25 Morning ForecastPairs on Watch -
FOREXCOM:COFFEE
FX:GBPAUD
FX:EURAUD
A short overview of the instruments I am looking at for today, multi-timeframe analysis down to what I will be looking at for an entry. Enjoy!

23.05.25 Morning ForecastPairs on Watch -
FX:CADJPY
FX:AUDCAD
A short overview of the instruments I am looking at for today, multi-timeframe analysis down to what I will be looking at for an entry. Enjoy!
