PayPal (PYPL) AnalysisPayPal has reclaimed a nice trendline
On this chart two points can be compared that are very similar
The first point ends up with bullish continuation, hence we can make the assumption that the second formation, due to it's similarity will act the same
Key comparable areas in corresponding colours.
Paypal

Be ready for long PaypalI am waiting on a 30-40% price bounce:
✅ We are in the price support zone: 174-200$
✅ oversold
✅ "OK" last Earnings & Revenue report
✅ Huge volume on this dump - reallocation of an asset.
- Buy as close as you can to the 175$ support line. The Second Buy zone will be near 200MA 150$ for today.

Opportunity arisesI've bought call option on this one today. I'll probably buy more as we dip closer to the support point at $180. Strike price $400.

PYPL ANALYSISI believe that price is currently ranging between support and resistance. News could push it in the upward direction but i would want to see it come down to touch the support line as outlined by the red drawing.

PayPalThursday, 25 November 2021
12:17 PM (WIB)
PayPal could develop into new strong bullish structures with 100% ROI for One year and it might start at $150.
Best regards,
RyodaBrainless
"Live to Ride and Ride to Live"
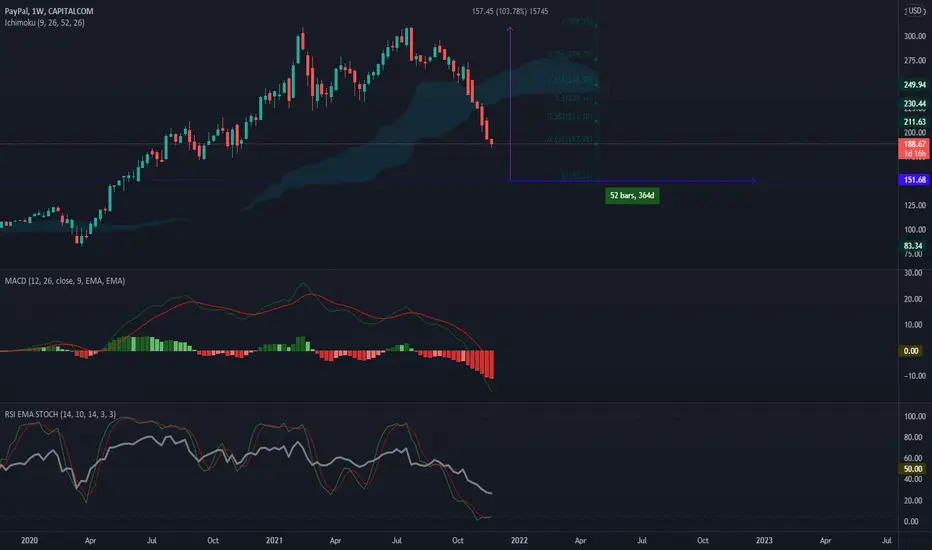
Some ideas on the most significant drop in PYPL history.PYPL is on my trading watchlist because, as a growth stock, it has been in a corrective situation for a reasonable amount of time, 284 days to be exact, from February 16, 2021. When we have this type of consolidation, it is easy to look at the past and ask a simple question. How many times did a similar situation like the current one has happened?
As you can see, there are 3 situations, including this one, that we can compare and understand to look for a good spot to develop setups with a goods ods as evolving as expected + High risk to reward ratio.
Let's check all of them.
AUG2015 - APR2017
JUL2019 - MAY2020
FEB2021 - YTD
I don't have a final idea of what I want to trade here. However, I'm certain I will not develop any bullish setup below the current descending trendline. Once the price gets close to it, I will develop the specific filter I'm waiting for. Based on past behavior, if I see a breakout of the descending trendline + a clear filter (not defined yet), I think it is a good opportunity to look for setups with a target on the previous high and beyond. That would mean R/R ratios above 5 or 6 (if we can catch that), and at the same time, we can absorb multiple stop loss, and even if we get it right on the 4th attempt; we still are able to make profits.
Feel free to add any ideas or thoughts about this in the comments! Thanks for reading.

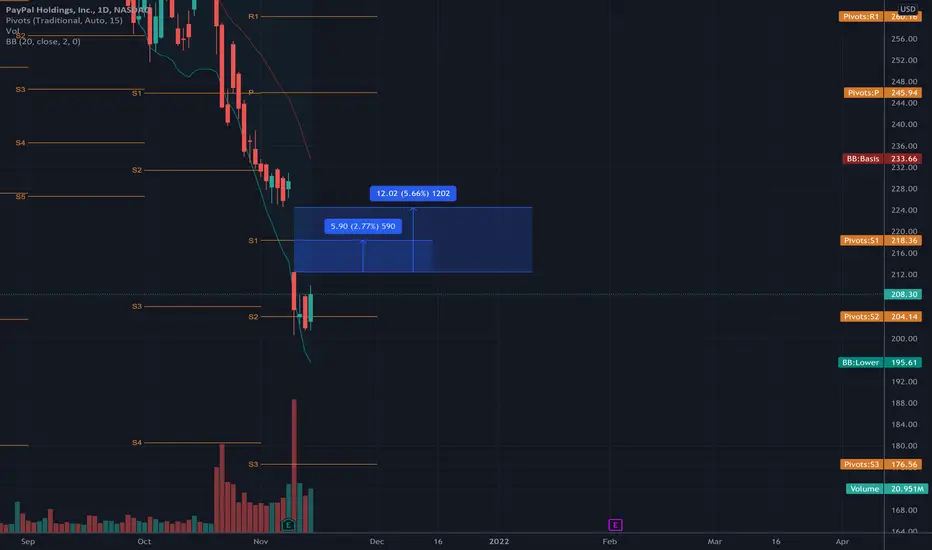
$PYPL | WEEKLY WATCHLIST 11/22Very ugly move for PayPal last week. I have since taken profits on the initial bounce we got from $201 to $215. I hold no options for the time being. Weakness from last week opens up the possibility to see $169-170 get tested before a major low is potentially put in. Be patient with this one and careful catching a falling knife with weakness present.

Paying for PaypalPayPal is approaching the 382 support after selling off within the broadening wedge pictured.
You can see how price has wedge into the top and sold off somewhat twice on chart's past.
As we near the 382, I expect bulls to favor the price and short sellers to want profits.
This is short term analysis given the wedge may need to fill the bottom to the 618.
If support breaks the 618 below is target for bears.
I want a 236 retest but will let chart control my opinion.
Not trade advice.

$PYPL - Has never been oversold this much since IPOLong term investor should Dollar Cost Average.
200Day moving average is imminent.

PYPLSeems that Paypal will go all the way to 225 to fill the gap. Above there can make a move towards 243.
If it fails to breakout buy puts at the 225 resistance lvl.
Goodluck!

$PYPL Fib Extension Looking at PYPL, it has broken and held above my 61.8% fib line (214.23). Next level to test would be 217.91 and then 221.60. There is also bullish divergence on the OBV on the 4 hour chart. I am long PYPL from here but will watch to see if it hits resistance at any of my further fib lines.

$PYPL | TRADE IDEAI hope this one excites you as much as me. Called the bounce for 15 points to the upside already... $185 to go.

$PYPL | WEEKLY WATCHLIST 11/15After successfully holding the CRITICAL support level last week, we saw strength come in on Friday. I believe this is just the beginning of something much much larger. I am already positioned long and looking for higher towards the $220+ region this week as long as the lows hold.

11/15-11/19 watchlist #1 $PYPL +$210
Price targets: $220, $224
Technical Analysis: Gap fill
News Catalyst: N/A (Trading based upon TA)
Paypal up!!!Hello Guys, Paypal goes up again because the Chart hitted a strong support zone. I think Paypal will gain up to 10% in the next few weeks ;D
what you guys think?
#paypal

PayPal strongly bullish after huge dropAs we know, PayPal's Q3 quarterly have shown a steady growth of the company, which is also trying to open up to collaborations with a giant like Amazon. However, this had an anomalous effect on the markets, where PayPal lost more than 10% in the following days.
At this point, using a Fibonacci retracement with a minimum set in May 2020 (ie when the main lockdowns are over and a "new era" has begun for everyone, including the markets), we note how the decline of these days has reached the famous "61.8%", one of the most recurring and well-known retracement points in the trading world.
Let's add how a company like PayPal has hardly already reached its waning phase, and indeed still has to reach its maximums (introduction to payments with crypto).
I leave the conclusions to you, I only tell you that in my opinion this is the right time to buy PayPal on sale

PayPal - Ignore the noise - Strong buyRSI indicator showing that PYPL is oversold. We see a rapid reversal.
1D RSI @ 19.
PayPal profit beats estimates, U.S. Venmo users can pay on Amazon from next year
The San Jose, California-based digital payments company's net income rose to $1.09 billion, or 92 cents per share, in the three months ended Sept. 30, from $1.02 billion, or 86 cents per share, a year earlier.
On an adjusted basis, PayPal earned $1.11 per share, above analysts' average estimate of $1.07, according to IBES data from Refinitiv.
Net revenue in the third quarter rose over 13% to $6.18 billion.

Bought PYPLBought PYPL
Overextended
Entropy decreasing with significant positive correlation
Might have to HODL for a bit but w/e

49% upsideNice, stock, nice results, the future of the metaverse payments system, if you are looking for a quality name this is the name Paypal, 40% in a few months

PYPL cheaper relatively to average price than it has ever been#pypl is a strong buy. 30% down from average yearly price, currently sitting below the average price paid this entire DECADE. IT is 25% down from the 200 EMA, in the entire history of paypal it has never been this low relative to the 200 average. This is an easy buy. Current fair price is $260. Fear mongering for cheaper tute shares. Don't listen to donkey brain bears who started trading this year. I am in heavy at 15% of my portfolio personally. Not financial advice.

Next level ease payment solutions maybe coming from PYPLWe can't know what is news or facts coming from a public traded company. But we can do analyze and predict the stock price movement by reading what the market is tryna communicate us through charts. I love to trade expanding flat corrective structure. Because it leads a continuation of a current trend. Cheers!

PYPL idea #1Price at year's Lows. This wedge could trigger daily chart reversal.
May want to cut size into earnings.

$PYPL | REQUESTEDPayPal looks to be finishing up a regular flat for the corrective wave 4. They report earnings on 11/8 AH.
Things to note:
- Sitting on diagonal support
- Completing corrective wave 4
- Daily RSI showing a lower low (Seller Exhaust)
- Daily chart showing higher low/double bottom forming
- Possible hidden bullish divergence forming (Signals Continuation)
