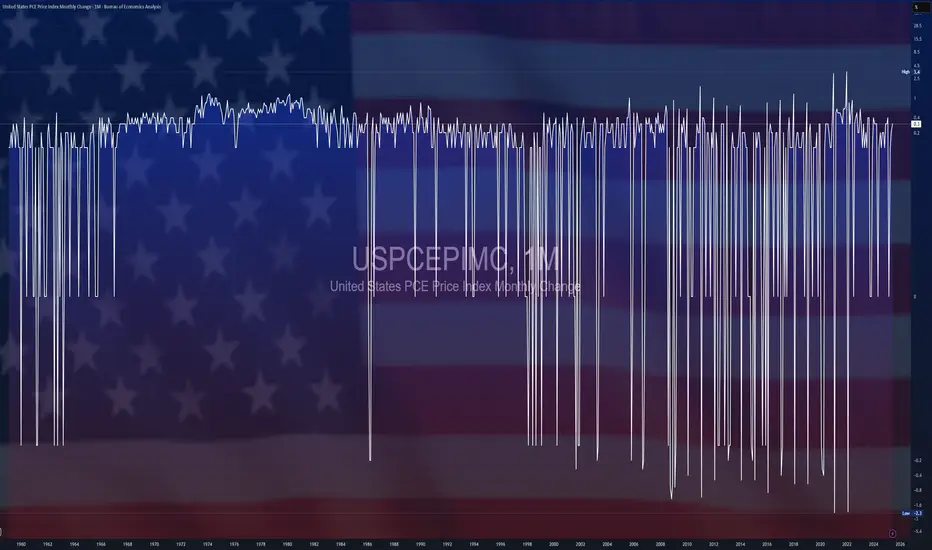
$USPCEPIMC -U.S PCE Prices Rise (June/2025)ECONOMICS:USPCEPIMC
June/2025
source: U.S. Bureau of Economic Analysis
- The US PCE price index rose by 0.3% mom in June, the largest increase in four months, and in line with expectations, led by prices for goods.
The core PCE index also went up 0.3%, aligning with forecasts.
However, both the headline and core annual inflation rates topped forecasts, reaching 2.6% and 2.8%, respectively.
Meanwhile, both personal income and spending edged up 0.3%.
PCE
BoJ keep interest rate unchanged, yen weakeningFollowing the July meeting, the BoJ maintained its interest rate at 0.5%, citing prevailing uncertainties from trade tariffs. Concurrently, the BoJ revised its inflation forecast upward to 2.7% YoY from 2.2%. The central bank's language on economic uncertainty has become less pessimistic, downgrading trade policy risks from "extremely high" to "high uncertainties remain," which signals a growing, albeit cautious, confidence in the economic outlook.
In the US, the June PCE surged to 2.6% YoY, surpassing the 2.5% prev. cons. The increase was attributed to tariff impacts, with Goods prices rising 0.4% MoM, the fastest pace since January, while Services prices held steady at 0.2% MoM.
The higher-than-expected US PCE data and the BoJ's decision to hold interest rates have continued to drive further appreciation of the USDJPY.
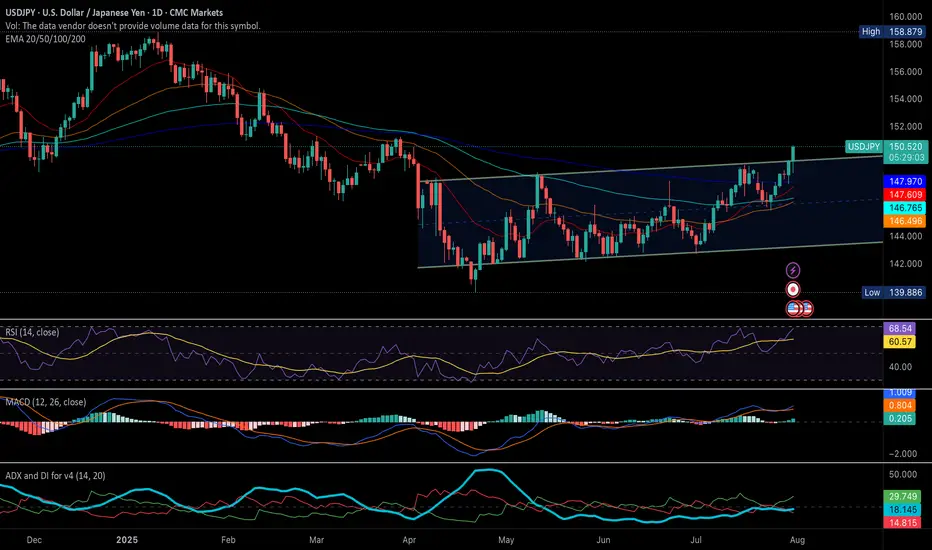
USD/JPY Technical Analysis
The USD/JPY pair is trading above its EMAs extensions, signaling a continuation of the bullish momentum. The price has successfully breached the ascending resistance trendline. However, the RSI is in overbought territory, suggesting that the current rally may be extended, and a potential pullback could be imminent.
The pair could continue to test the resistance level at 151.367. Should it fail to break this level, a rebound could see the USD/JPY pair test the support at 149.65.
By Van Ha Trinh - Financial Market Strategist at Exness
German CPI flatlines, eurozone CPI nextThe euro is up for an eighth consecutive day and has gained 2.4% during that time. In the North American session, EUR/USD is trading at 1.1738, up 0.36% on the day.
German inflation data on Monday pointed to a weakening German economy. The CPI report indicated that the deflationary process slowly continues. The inflation rate for June came in at 0% m/m, down from 0.1% in May and below the consensus of 0.2%. Annually, inflation dropped to 2.0% from 2.1% and below the consensus of 2.1%. The eurozone releases its CPI report on Tuesday.
Inflation has been dropping in small increments and has now fallen to the European Central Bank's inflation target of 2%. The ECB cut the deposit rate to 2.0% earlier in June and meets next in July. Although eurozone inflation is largely contained, there are concerns about the impact that US tariffs and counter-tariffs by US trading partners could have on the inflation picture. The ECB is likely to maintain rates in July but could lower rates in September if disinflation continues.
The US continues to show signs that the economy is slowing down. Last week, GDP was revised downwards to -0.5% in the first quarter. This was followed by US consumer spending for May (PCE) which posted a 0.1% decline, following a 0.2% gain in April and shy of the consensus of 0.1%. This was the first contraction since January. If economic data continues to head lower, pressure will increase on the Federal Reserve to lower interest rates, which isn't expected before the September meeting.
EUR/USD is testing resistance at 1.1755. Above, there is resistance at 1.1791
1.1718 and 1.1682 are the next support levels

Yen rises sharply, Tokyo Core CPI nextThe Japanese yen has edged higher on Friday. In the North American session, USD/JPY is trading at 144.57, up 0.16% on the day.
Tokyo Core CPI surprised on the downside in June, falling to 3.1% y/y. This was down sharply from the 3.6% gain in May and below the market estimate of 3.3%. This was the the first slowdown in Tokyo core inflation since February. The decline was largely driven by a renewal of fuel subsidies and a reduction in water charges.
Despite the drop, core inflation remains well above the Bank of Japan's 2% target, maintaining expectations for another rate hike in the second half of the year. BoJ Governor Ueda has signaled that the Bank will raise rates if it is confident that wage growth is sustained, which is critical to maintaining inflation at the 2% target. However, this week's BOJ Summary of Opinions showed that some members are more dovish, given global trade tensions and the bumpy US-Japan trade talks. Japan has said it will not agree to US tariffs of 25% on Japanese cars, and six rounds of talks in the past two months have failed to produce a deal.
The Core PCE Price Index, the Fed's preferred inflation indicator, accelerated in May and was higher than expected. The index rose 2.7% y/y up from an upwardly revised 2.6% in May and above the consensus of 2.6%. Monthly, the index rose 0.2%, up from 0.1% which was also the consensus. This was a three-month high and will boost the case for the Fed to leave interest rates unchanged at the July meeting.
USD/JPY faces resistance at 144.49 and 144.64
144.31 and 144.16 are the next support levels

PCEs & attacks on PowellWe are carefully monitoring the PCEs today, to see, "wins" this small battle in the rate-lowering war. Let's dig in.
Let us know what you think in the comments below.
Thank you.
77.3% of retail investor accounts lose money when trading CFDs with this provider. You should consider whether you understand how CFDs work and whether you can afford to take the high risk of losing your money. Past performance is not necessarily indicative of future results. The value of investments may fall as well as rise and the investor may not get back the amount initially invested. This content is not intended for nor applicable to residents of the UK. Cryptocurrency CFDs and spread bets are restricted in the UK for all retail clients.

Can PCE data rescue the dollar? JPY, EUR, GBP setup in playThe latest U.S. PCE report is set for release at 8:30am EDT, with both headline and core inflation expected at 0.1% month-on-month.
As the Fed’s preferred inflation measure, today’s figures could influence interest rate expectations. A stronger print may reduce the case for a July rate cut, while a softer result could add pressure on the U.S. dollar.
The dollar has already weakened this week amid speculation over central bank independence (trump is reportedly considering nominating Fed chair Jerome Powell’s successor earlier than normal in order to undermine the current chair).
Pairs to watch include, EUR/USD, GBP/USD, USD/JPY with symmetrical triangle formations suggesting breakout potential in either direction for all once the data hits.

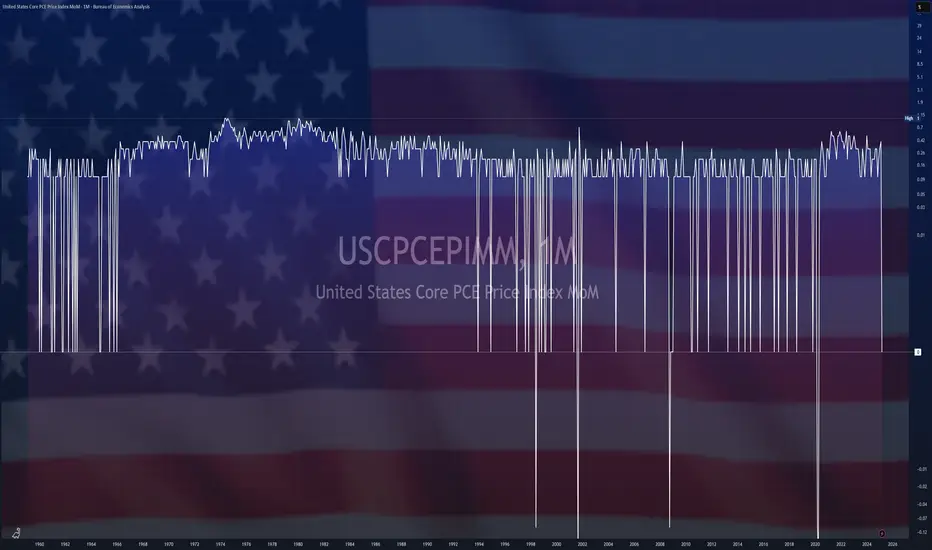
$USPCEPIMC -U.S Core PCE (April/2025)ECONOMICS:USPCEPIMC
April/2025
source: U.S. Bureau of Economic Analysis
-The core PCE price index in the US, which excludes volatile and energy prices and is Federal Reserve's chosen gauge of underlying inflation in the US economy,
went up 0.1% from the previous month in April of 2025.
The result was in line with market expectations.
From the previous year, the index rose by 2.5% to slow from the 2.7% jump from March, the softest increase since March of 2021.

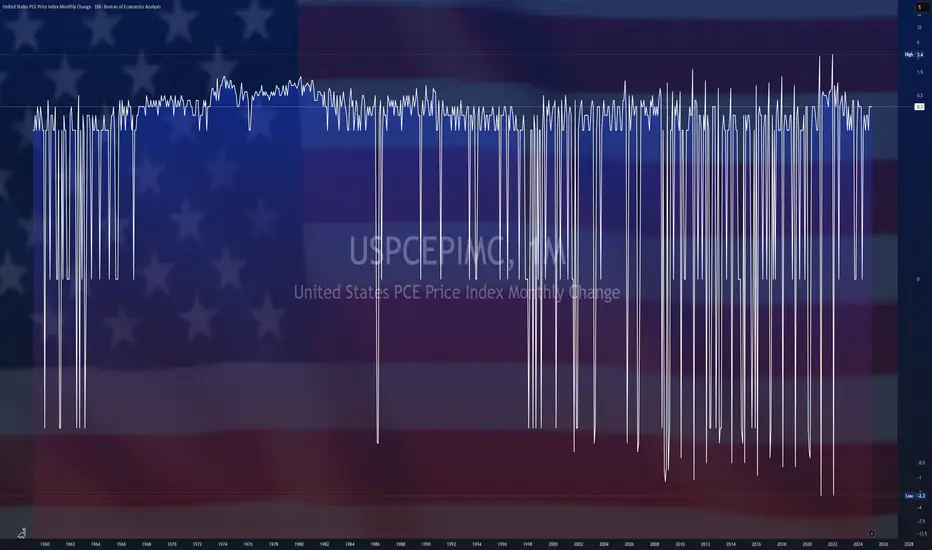
$USPCEPIMC -U.S PCE Inflation Slows as Expected (March/2025)ECONOMICS:USPCEPIMC -U.S PCE Inflation Slows as Expected (March/2025)
ECONOMICS:USPCEPIMC
March/2025
source: U.S. Bureau of Economic Analysis
-The personal consumption expenditure price index in the US was unchanged in March from February 2025, the least in ten months, and following a 0.4% rise in each of the previous two months, in line with expectations.
Prices for goods fell 0.5%, after a 0.2% increase in February and prices for services went up 0.2%, easing from a 0.5% rise.
Meanwhile, the core PCE index, which excludes volatile food and energy prices, was also unchanged, compared with forecasts for a 0.1% increase.
Separately, food prices rose 0.5% (vs a flat reading) while prices for energy goods and services dropped 2.7% (vs 0.1%).
Finally, the annual PCE rate decreased to 2.3%, the lowest in five months, and the annual core PCE inflation also eased to 2.6%.
$USPCEPIMC -U.S Core PCE Inflation Rises More than ExpectedECONOMICS:USPCEPIMC
(February/2025)
source: U.S. Bureau of Economic Analysis
- The US PCE price index rose by 0.3% month-over-month in February, maintaining the same pace as the previous two months.
The core PCE index increased by 0.4%, the most since January 2024, surpassing the forecast of 0.3% and up from 0.3% in January.
On a year-over-year basis, headline PCE inflation remained steady at 2.5%, while core PCE inflation edged up to 2.8%, above the expected 2.7%.
GOLD knocking on heaven's door againAnd once again we are at the spot, where MARKETSCOM:GOLD is trying to go for another all-time high. Will we see another strong push, or is it time for the commodity to slow down and retrace? Let's dig in!
TVC:GOLD
Let us know what you think in the comments below.
Thank you.
74.2% of retail investor accounts lose money when trading CFDs with this provider. You should consider whether you understand how CFDs work and whether you can afford to take the high risk of losing your money. Past performance is not necessarily indicative of future results. The value of investments may fall as well as rise and the investor may not get back the amount initially invested. This content is not intended for nor applicable to residents of the UK. Cryptocurrency CFDs and spread bets are restricted in the UK for all retail clients.

$USPCEPIMC -U.S Price Index (January/2025)ECONOMICS:USPCEPIMC 0.3%
(January/2025)
source: U.S. Bureau of Economic Analysis
- The US Personal Consumption Expenditures (PCE) price index increased by 0.3% month-over-month in January 2025, the same pace as in December, and in line with expectations.
Prices for goods increased 0.5%, following a 0.1% rise in December and prices for services rose at a slower 0.2%, after a 0.4% gain in the previous month.
Meanwhile, the core PCE index, which excludes volatile food and energy prices, rose 0.3%, slightly above the 0.2% gain recorded in the previous month, and also matching forecasts.
Food prices went up 0.3%, higher than 0.2% in December while cost of energy eased (1.3% vs 2.4%). On a year-over-year basis, headline PCE inflation eased to 2.5% from 2.6%, marking its first slowdown in four months. Similarly, core PCE inflation declined to 2.6%, its lowest level in seven months, from an upwardly revised 2.9%.

EURUSD 28 Feb 2025 W9 -Intraday Analysis- US PCE Day! EOM FlowsThis is my Intraday analysis on FOREXCOM:EURUSD for 28 Feb 2025 W9 based on Smart Money Concept (SMC) which includes the following:
Market Sentiment
4H Chart Analysis
15m Chart Analysis
Market Sentiment
Heavy economic news:
EU : German Prelim CPI m/m
US : the most awaited report Core PCE Price Index m/m - Personal Spending m/m - Chicago PMI
The market sentiment detailed as following:
Trump's Tariff Announcements:
President Trump's announcements regarding new and increased tariffs significantly impacted market sentiment. Uncertainty surrounding trade relations with various countries, including the European Union, Mexico, and Canada, created volatility.
These tariff announcements created fears of trade wars, which negatively impacted investor confidence.
Economic Data:
Reports of declining new home sales in the U.S. and concerns about overall economic health contributed to market unease.
Also, the release of various economic data points, and the anticipation of the PCE inflation data release, influenced market movement.
NVIDIA's Performance and AI Competition:
While NVIDIA beat earnings estimates, concerns about increased competition from Chinese AI companies, particularly DeepSeek, led to a significant drop in its stock price, impacting the broader tech sector.
Geopolitical Uncertainty:
Geopolitical factors, such as the removal of Chevron's oil license in Venezuela, contributed to fluctuations in commodity prices, particularly oil.
Bank of Japan governor Ueda's statements regarding the uncertainty of US policies also added to uncertainty.
Additional Factors:
Geopolitical Resolution: A sudden de-escalation in a prior crisis (e.g., eased tensions in a conflict zone) might have reduced safe-haven demand for gold, though this was secondary to dollar strength.
Technical Factors: End-of-month rebalancing or options expirations could have amplified downward moves.
The interplay of a hawkish Fed, a resilient dollar, and risk aversion triggered broad-based declines. The overarching theme was a recalibration of investor expectations around tighter monetary policy and its implications for global growth and asset valuations.
4H Chart Analysis
1️⃣
🔹Swing Bullish (Reached Swing Extreme Demand)
🔹INT Bearish (Adjusted my INT structure to align with the previous Bullish move)
🔹Complex Swing INT Structure
2️⃣
🔹As the Swing is Bullish, expectations were set to continue Bullish targeting the Weak Swing High and create a Bullish BOS after the Deep Pullback to the Swing Demand.
🔹During the Swing Bullish Continuation after the Deep Pullback, INT Structure kept holding Bullish to fulfill the Bullish continuation phase.
🔹With price reaching the Swing Extreme Premium zone and the expectation of breaking the Weak Swing High, price failed 2 times and with the 3rd attempt it created a Bearish iBOS. This indicated that the Swing INT structure is Complex and the Daily/Weekly TFs are still in play.
3️⃣
🔹After the Bearish iBOS, we expect PB, there is no clear POI for price to initiate PB except the Liq. at 1.03730 and 1.03173 before mitigating the last clear 4H Demand.
🔹It’s not a must to reach these Liq. points as we already in a Daily partially mitigated Demand Zone and maybe some orders reside there. But Will need LTFs to show clear Bullish OF to confirm the 4H Bearish INT structure is staring the PB.
🔹Expectations is set to Bearish continuation till we have a clear Bullish OF. Also, keep in mind that Daily and Weekly are still Bearish and we may target the 4H Strong Swing Low to fulfill the Daily and Weekly move.
15m Chart Analysis
1️⃣
🔹Swing Bearish
🔹INT Bearish
🔹Swing Pullback
2️⃣
🔹Swing structure turned Bearish with confirmed BOS. And after BOS we expect PB phase to start.
🔹We didn’t mitigate any HP POI/Liq. to initiate the Swing PB phase.
🔹Will need a clear INT Structure shift to Bullish with momentum in order to play the PB phase otherwise price will continue Bearish till the sweep of Liq. on the 4H TF at 1.03730 and 1.03173 before tapping the clear 4H Demand.
3️⃣
🔹Expectations is set to continue Bearish with cautious from the Swing PB phase that can start at any time.
🔹Also keep in mind the End of Month Flows and PCE report today.

EURUSD 24-28 Feb 2025 W9 - Weekly Analysis - US GDP / PCE Week!This is my Weekly analysis on EURUSD for 24-28 Feb 2025 W9 based on Smart Money Concept (SMC) which includes the following:
Market Sentiment
Weekly Chart Analysis
Daily Chart Analysis
4H Chart Analysis
Economic Events for the Week
Market Sentiment
Inflation Data Dominates
Hotter-than-expected U.S. CPI/PPI initially fueled inflation fears, but signs of moderation in underlying PPI components raised hopes for softer PCE data next week.
Investors see a growing chance of Fed rate cuts in late 2025, limiting USD strength.
Tariff Noise vs. Market Calm
Trump’s tariff threats (e.g., reciprocal steel/aluminum duties) were largely dismissed as negotiation tactics, easing fears of an immediate trade war.
Markets expect delays in implementation, reducing near-term volatility.
Geopolitical Progress Supports Risk Sentiment
Reports of progress in Ukraine-Russia peace talks (e.g., territory swaps) reduced safe-haven demand for the USD, indirectly boosting the Euro.
Stabilizing energy prices and supply chains further supported the Eurozone outlook.
Central Bank Divergence
The Fed remains cautious, emphasizing data dependency, while the ECB signals potential rate cuts later in 2025.
Short-term EUR resilience stems from reduced trade-war risks and improving Eurozone economic data.
Focus on Upcoming Catalysts
This week PCE inflation report (Fed’s preferred gauge) will test disinflation optimism.
Weak U.S. retail sales/industrial production amplified concerns about slowing growth, weighing on the USD.
Key Takeaways
Bullish Drivers:
Progress in geopolitical tensions.
Softening inflation expectations ahead of PCE data.
Tariffs seen as negotiation tools, not immediate threats.
Bearish Risks:
A hot PCE report reviving Fed hawkishness.
Sudden tariff escalations or breakdowns in peace talks.
Overall Sentiment:
Cautiously bullish for EUR/USD this week, with upside hinging on sustained risk appetite and confirmation of disinflation trends.
Weekly Chart Analysis
1️⃣
🔹Swing Bearish
🔹Internal Bearish (Pullback Phase)
🔹In Swing Discount
🔹Swing Continuation Phase (Pro Swing + Pro Internal)
2️⃣
🔹INT structure continuing bearish with iBOS following the Bearish Swing. (End of 2023 till end of 2024 was a pullback phase after the first bearish iBOS)
3️⃣
🔹After the bearish iBOS we expect a pullback, price tapped into Monthly Demand and the liquidity below Nov 2022 which is above the weekly demand formed with the initiation of the bearish iBOS pullback phase.
🔹Price made a bullish CHoCH which indicated that the liquidity was enough as per previous weeks analysis to initiate a pullback phase for the bearish iBOS.
🔹Price pulled back after the Bullish CHoCH to the Weekly Demand formed and showed reaction after volatile week.
🔹With the previous week solid Bullish close, the Demand did hold and there is a high probability that price could continue Bullish to facilitate the INT structure pullback phase.
🔹If price to continue Bullish, price will be targeting the liquidity above Dec 2024, INT Structure EQ (50%) at 1.06933 to target the Weekly Supply in premium before continuing down to target the Weak INT Low.
🔹Expectations is for price to continue Bullish if it managed to break 1.05333 27 Jan High to facilitate the INT structure pullback.
Daily Chart Analysis
1️⃣
🔹Swing Bearish
🔹INT Bearish
🔹Swing Continuation Phase (Pro Swing + Pro Internal)
2️⃣
🔹Following the Bearish Swing BOS, INT Structure continuing bearish tapping the weekly demand zone.
3️⃣
🔹After the failure to close below the Weak INT Low, price continued bullish sweeping the liquidity above Dec 30 and mitigating a Daily supply zone within the INT Structure Premium Zone.
🔹With the mitigation of the Daily supply, price created a Bearish CHoCH signaling the end of the Pullback Phase of the INT structure and the start of the Bearish move targeting the Weak INT Low.
🔹Price failed for the 2nd time to close below the Weak INT Low after mitigating the Daily Demand formed from the failure to close below the Weak INT Low which triggered aggressive Bullish reaction and mitigating the Daily Supply Zone formed from the recent Bearish CHoCH.
🔹After Supply mitigation, price continued Bearish following the Bearish INT Structure continuation phase.
🔹Previous week I mentioned “if the Daily formed a Bullish CHoCH (Currently above the recent mitigated Supply) this will shift my outlook to the Weekly Scenario of a deep pullback of the Weekly INT Structure to at least the Structure EQ (50%). MTF required to shift Bullish to confirm”. And with that happened I’d shifted to Bullish expectation and there is expectations of a deep pullback within the Daily Bearish INT structure.
🔹The expected targets for the current bullish move is 1st to sweep the liquidity above the equal highs (17 Dec & 27 Jan) 2nd Break of the Strong INT High to facilitate the Daily Bearish Swing pullback and the Weekly Bearish INT pullback.
🔹Currently Supply is failing and Demand is holding confirms the short-term Bullish scenario and setting my expectations for continuing Bullish. Price had pulled back to the recent Daily Demand and continued Bullish.
4H Chart Analysis
1️⃣
🔹Swing Bullish (Reached Swing Extreme Demand)
🔹INT Bearish (Reached Extreme Supply)
🔹INT-INT Bullish (Reached EQ (50%)
🔹Swing Continuation
2️⃣
🔹With the deep pullback to the Bullish Swing extreme discount and mitigating the 4H/Daily demand zones, price turned Bullish forming a Bullish CHoCH.
🔹The current Bullish move from Swing extreme discount to current price level having 2 scenarios (Previously I’d the following 2 scenarios where now I favors the 2nd scenario due to the impulsive nature of the move):
Scenario 1: Pullback for Bearish INT Structure and with the recent Bearish CHoCK and Minor Demand zones are failing, I expect Bearish continuation to target the Weak INT Low which aligns with the Daily/Weekly Bearish Structure/Move. (Counter Swing – Pro Internal)
Scenario 2: Bullish Swing continuation to target the Weak Swing High. Which requires to have Demand holding and Supply failing. The first sign required to confirm this scenario will be the current Demand which price is currently at to hold and we form a Bullish CHoCH. (Pro Swing – Counter Internal)
🔹As expected yesterday, price managed to continue Bullish after reaching the INT-INT structure EQ (50%) in a solid impulsive move aligns with the Swing continuation move.
3️⃣
🔹Still expectation is set to continue Bullish targeting the Weak Swing High as long LTFs holds Bullish structures. Also, In my mind I’m not neglecting the current Bearish 4H INT structure and we already reached that structure extreme where we are getting the current corrective Bearish OF.
Economic Events for the Week

Hot Inflation & What to Watch Next - 14/02/2514th of February 2025
•XRP and BNB leading, as Bitcoin trades flat in the last seven days.
•Headline inflation metrics in the US land above expectations.
•Impactful data point to watch heading into the end of February.
---
A big week of headlines and events, particularly out of the US, have netted very little change in Bitcoin’s price.
Bitcoin is down 0.1% at the time of writing in the last seven-days, while altcoins such as XRP and BNB are showing double-digit gains.
Bitcoin has struggled to make new year-to-date highs in the current state of global conditions. In contrast, global indices in the UK (FTSE100) and China (CSI300) have continued to make new year-to-date highs
Mixed Messages & Above Expected Results
Fed Chair Jerome Powell mentioned earlier this week at a senate banking enquiry that the current state of monetary policy does not require easing conditions, as the economy remains strong and the 2% target for inflation is key.
However, he has referenced that unexpected moves in the labour market or a significant cooling of inflation could change the committee’s mind.
“If the labor market were to weaken unexpectedly or inflation were to fall more quickly than anticipated, we can ease policy accordingly.”
On this point, headline metrics for inflation land above expectations this week.
On Tuesday, Consumer Price Index (CPI) landed above expectations at 3.0%, rising 0.1% from the previous month.
Overnight the Producers Price Index (PPI) landed above expectations at 3.5% year-on-year. This figure remains unchanged from the previous month and represents the inflation burden on producers in the US.
Key data to come
On the last day of February the US Personal Consumption Expenditures (PCE) data will provide further clarity towards the state of monetary policy heading into next month.
PCE is the leading indicator used by the policy committee to measure inflation.
Fear and greed currently reads 40 – neutral.
Bitcoin Analysis
The price of Bitcoin is currently trading within the January high and low range, and on the Bollinger band we are entering a period where the upper and bottom channel is compressing.
Bullish Scenario
In the coming days, price may see a sharp move higher as the Bollinger Bands tighten. If bulls regain control and reclaim the monthly open, they could push toward last month’s high.
Bearish Scenario
We could also with this compression in the Bollinger Bands, see volatility moving price to the downside. This may result in prices heading towards the January low.
DISCLAIMER: The information is for general information purposes only. It is not intended as legal, financial or investment advice and should not be construed or relied on as such. Before making any commitment of a legal or financial nature you should seek advice from a qualified and registered legal practitioner or financial or investment adviser. No material contained within this website should be construed or relied upon as providing recommendations in relation to any legal or financial product.

XAUUSD - Gold hits new ATH!Gold is trading above EMA200 and EMA50 on the 1-hour timeframe and is in its ascending channel. A correction towards the demand zone will provide us with the next buying opportunity with a good risk-reward ratio.
Donald Trump has announced his intention to impose a 25% tariff on imports from Canada and Mexico due to the fentanyl issue, emphasizing that these tariffs will take effect starting Saturday. He also stated that China will eventually have to pay tariffs as well, and that the U.S. is already implementing trade restrictions against Beijing.
Trump further asserted that the era of passively watching BRICS nations attempt to distance themselves from the U.S. dollar is over. He declared that these countries must commit to neither creating a new BRICS currency nor supporting any alternative to the powerful U.S. dollar. Otherwise, they will face 100% tariffs and lose access to the thriving American economy. He insisted that BRICS has no chance of replacing the U.S. dollar in global trade, and any country attempting to do so will face severe economic consequences.
(Translation continues…)
Continuation of the English Translation:
Trump’s repeated tariff threats have raised concerns among American consumers and introduced economic risks for the United States. Even the mere discussion of such tariffs can have significant economic effects by influencing consumer behavior. Evidence suggests that many Americans are seriously worried about the potential consequences of these policies.
According to a survey conducted by economists from the University of Texas, the University of California, and the University of Chicago, Americans expect substantial tariffs to be imposed on all major trade partners—50% on Chinese imports and 35% on imports from Canada and Europe. Contrary to Trump’s claims, most citizens believe these tariffs will directly impact them by driving up prices. When asked about a hypothetical 20% tariff, half of the respondents stated that the majority of the costs would be passed directly to consumers.
Political differences are also evident in the perception of these tariffs. Democrats and Republicans disagree on the extent to which consumers will bear the costs. Democrats estimate that 68% of the tariff burden will fall on consumers, whereas Republicans believe it will be around 41%. Regardless of political stance, the financial strain from these tariffs is expected to be significant, particularly for consumers already weary of inflation.
Both the public and economists recognize that tariffs on imports can also raise prices for domestically produced goods. The economic impact of tariffs was clearly demonstrated during Trump’s first term. A study found that the tariffs imposed in 2018 on washing machines from South Korea and China led to a nearly equivalent price increase for washing machines in the U.S.—and even drove up the price of dryers as well.
Even if these new tariffs are not implemented, their mere threat can lead to price hikes. Many consumers, anticipating higher costs, are choosing to make purchases in advance. In a survey, 43% of respondents stated that they would buy products before the tariffs take effect to avoid potential price increases.Another survey in January found that 20% of people believed that now was the right time to buy durable goods because prices were likely to rise.
Businesses are responding in a similar fashion. Many companies are stockpiling inventory ahead of potential tariff hikes or shifting their supply chains to countries that would not be affected. This behavior has contributed to a surge in exports from China to the U.S., with December marking the second-highest export level on record—at least partly driven by efforts to preempt new tariffs.
These strategies, however, come with additional costs, much of which will likely be passed on to consumers. The COVID-19 pandemic provided a clear example of how supply chain disruptions can lead to widespread cost increases. For instance, higher import costs for auto parts eventually resulted in more expensive vehicle repairs and insurance premiums.
Stimulating inflation under current economic conditions—even temporarily—would be costly. The Federal Reserve has paused further interest rate cuts, waiting for clearer signs of sustained inflation reduction. Rising prices for key goods, particularly automobiles, halted progress in lowering inflation in the fourth quarter of last year. Additional inflationary pressures caused by tariff expectations could delay the Fed’s next rate cut and keep interest rates elevated for an extended period. The uncertainty surrounding future tariffs reinforces the Fed’s cautious stance.
Inflation is not the only concern stemming from tariff threats. A third of survey respondents indicated that the likelihood of widespread tariffs would lead them to cut spending and increase savings. The greater the uncertainty surrounding trade policy, the stronger the incentive for precautionary savings.
American consumers have been the driving force behind the nation’s economic recovery. However, the recent wave of tariff threats has created deep concerns, potentially putting the U.S. economy—widely regarded as one of the strongest in the world—at risk.

$USCPCEPIMM -U.S PCE (October/2024)ECONOMICS:USCPCEPIMM
October/2024
source: U.S. Bureau of Economic Analysis
-The US core PCE price index, the Federal Reserve’s preferred gauge to measure underlying inflation, rose by 0.3% from the previous month in October 2024, the same pace as in September and matching market forecasts.
Service prices rose by 0.4%, while goods prices decreased 0.1%. Year-on-year, core PCE prices rose by 2.8% in October, the most in six months, also in line with market estimates.

-United States PCE (October/2024)$USCPCEPEPIMM 0.3%
(October/2024)
source: U.S. Bureau of Economic Analysis
-The US core PCE price index, the Federal Reserve’s preferred gauge to measure underlying inflation, rose by 0.3% from the previous month in September of 2024, the highest gain in five months, following an upwardly revised 0.2% increase in August, matching market forecasts. Service prices rose by 0.3%, while goods prices decreased 0.1%.
Year-on-Year, core PCE prices rose 2.7%, the same as in August, but above forecasts of 2.6%. source: U.S. Bureau of Economic Analysis

RSI Flags Gold Risks Before GDP, PCE Data? Gold is set to face two major US economic data points this week, following last week’s surprise 50-basis-point interest rate cut from the Federal Reserve: U.S. GDP figures on Thursday and Core Personal Consumption Expenditures (PCE) on Friday
Danielle DiMartino Booth of Quill Intelligence argues the Fed’s larger-than-expected cut signals concerns over potential negative GDP revisions, casting doubt on the chances of a “soft landing” for the U.S. economy.
Jerome Powell is also going to be speaking on Thursday at the 2024 U.S. Treasury Market Conference. But his remarks may take a backseat to the data.
The 4-hour Relative Strength Index (RSI) has climbed above 70, signaling overbought conditions and suggesting caution for gold buyers. If the metal turns corrective, the price could test $2,613.

Will the dollar bounce back from its current decline?
The US July PCE was in line with market consensus. Headline PCE prices rose 0.2% from a month ago and 2.5% from a year ago, which aligns with market expectations. Core PCE, the Fed's price benchmark, rose only 0.16%, slower than the previous month's 0.18%. This is the lowest level this year and has catalyzed the market sentiment of the Fed’s rate cut.
It is worth noting that despite a 0.3% increase in personal income, surpassing the previous month's 0.2%, the savings rate remains alarmingly low. This is because personal consumption expenditures are growing at a faster rate than personal income.
The current savings rate has dropped to 2.9%, marking only the second instance in the past 16 years, since the global financial crisis, the savings rate has fallen to the 2% range.
This implies that consumption in the United States could decline quickly, serving as a cautionary signal that if employment falters, there may be insufficient buffers to sustain consumption.
DXY sustained its uptrend after breaking out of the descending channel and advanced to 101.60. The price consolidates around the 101.50-101.70 range, waiting for an additional price trigger.
If the price breaches the resistance at 101.80 while holding above the EMA, the price may gain upward momentum toward 102.60. Conversely, if DXY fails to stay above both EMAs and retreats to the support at 100.50, the price could fall further to the 100.00 threshold.

GBP/USD to Track 100-MA Slope? GBP/USD to Track 100-MA Slope?
On Wednesday, GBP/USD traders will focus on the UK's July Manufacturing and Services PMI, expected to show slight increases.
Although, more significant events will come from the U.S., including the annualized Q2 2024 GDP and the PCE Price Index.
The Fed's preferred inflation gauge likely cooled in June, suggesting its efforts to curb prices are working, potentially paving the way for rate cuts in September.
Markets expect the Fed to maintain the federal funds rate next week but anticipate a cut in September, according to the CME Group's FedWatch tool.
GBP/USD extends the decline from the monthly high (1.3045), pulling the Relative Strength Index (RSI) back from overbought territory. It found support after briefly easing below 1.29 and may track the positive slope in the 100-period SMA.

Market tests BoJ with yen at 1986 low The Japanese yen tumbled beyond 160 per USD, marking its weakest level since 1986. This is a critical threshold that previously prompted intervention by Japanese authorities. In May, Japan depleted a record ¥9.8 trillion to bolster the yen.
Masato Kanda, Tokyo's top currency diplomat, attempted to mitigate the surge above 160.00 with strong verbal interventions, yet he mentioned no specific target level. This ambiguity was perceived by some market participants as a green light to drive the pair to 160.82.
The lack of immediate intervention from the Bank of Japan post-160 breakout raises questions: Does this signal an open path to the next psychological levels?
In June alone, the yen has slipped roughly 1.5% against the dollar, extending its year-to-date decline to about 13%. Should there be a retracement from the previous 160 intervention level, buying interest is expected to resurface around the 158.00 support, aligning with the 38.2% Fibonacci retracement level.
Fundamentally, traders are eyeing tomorrow's US Jobless Claims data, followed by Tokyo CPI and US PCE releases on Friday, which could be critical in shaping the next moves in the yen.

$WMT 10D, $56 incoming, Tower Top BreakdownTower Top Breakdown in the works. Seems like whatever or whenever it happens, it will be close to next Friday. Remain Bearish unless new highs are established. Seemingly easy Trade here. MACD in same positioning as well as RSI. Seems like WMT doesn't get much volume in general. Not necessarily a bad thing. Options could pay well here.

Top USD trades to watch ahead of Core PCE Data release The Federal Reserve’s preferred inflation gauge, US Core PCE (Personal Consumption Expenditure) Price Index MoM, is released at the end of the coming week. This means some USD trades could present themselves.
But first, a quick recap on why the Core PCE Price Index matters and why it is the Fed’s preferred gauge:
Unlike the more familiar Consumer Price Index (CPI), which uses a fixed basket of goods and services, the Core PCE offers a snapshot of consumer spending with a flexible and broader basket of goods and services that adapts to changes in consumer behavior. Importantly, it excludes volatile food and energy prices though. It is thus argued that the Core PCE provides a clearer view of underlying inflation trends.
Some trading opportunities might exist in the EUR/USD and USD/CAD. The Euro Area’s Inflation Rate (Flash) data is due a few hours before US PCE, while Canada’s GDP Growth data is released at the exact same time as US PCE.
