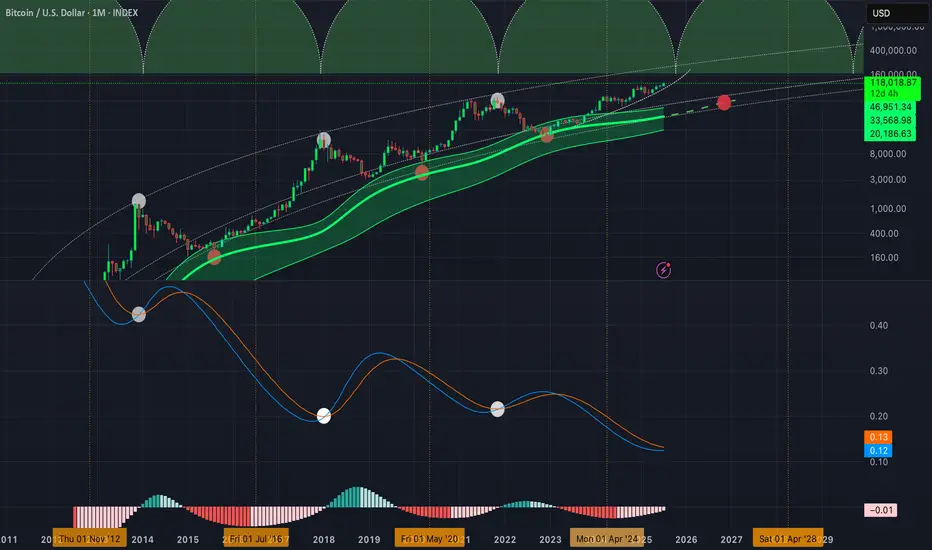
Gaussian will tell the exit signal!Please do not fomo at the current prices , instead be prepared to sell some once Gaussian LMACD signal line and lmacd line come together before crossing to the upside. Might be happening soon in the coming months Unfortunately this signals lags a little bit so you won't be catching the actual peak but we will be in a really good spot to get out before coming back down to the Gaussian Core in late 2026 around 40-50k.
Peak
TMGH's New PeakTMG Holding trend is reaching a new peak zone at the resistance line 56.884. Historically, it is expected to rebound to the support line at 56.324, then the support line 55.2 and finally 55.165. In conclusion, it increased by 0.09%.

Bitcoin's 2024 Halving to 2025 Peak: Will BTC Reach $294K?📌Historical Observations
- 2012 Halving → 2013 Top:
Duration: ~1 year.
Price increase: ~8,600% (from ~$12 to ~$1,150).
- 2016 Halving → 2017 Top:
Duration: ~1.5 years.
Price increase: ~2,900% (from ~$650 to ~$19,500).
- 2020 Halving → 2021 Top:
Duration: ~1.5 years.
Price increase: ~900% (from ~$8,600 to ~$69,000).
- 2024 Halving → Projected 2025 Top:
Halving price: ~$64,000.
📌Identified Patterns
- Time from Halving to Peak: Peaks occur around 1.33 to 1.5 years after the halving.
- Diminishing Returns: Growth rates decrease with each cycle:
2012 to 2016: ~66% reduction in returns.
2016 to 2020: ~69% reduction in returns.
Expected reduction for 2024 cycle: ~60-70%.
📌Projection for the 2024 Cycle
Duration to Peak:
Add 1.33 to 1.5 years to the halving date (April 2024).
Projected top: June to October 2025.
Price Growth:
Assuming diminishing returns, we estimate 300% to 360% price growth from the halving price.
Next Top Price=Halving Price×(1+Growth Rate)
300% growth: $64,000 × 4 = $256,000.
360% growth: $64,000 × 4.6 = $294,400.
📌Final Projection
Next Bitcoin Peak Price: Estimated between $256,000 and $294,400.
Timing: Likely between June and October 2025.
Here’s to a successful and prosperous trading year ahead! 🎉
You’ve got this! Let’s make 2025 your best trading year yet.
~ Rich

High precision version - BTC log trend DEC/JAN PEAKThis is an updated version of my first logarithmic price trend.
This trend is in line with Bitcoin since it first started to trade.
With highly precise curves that better match the cycles, I now expect to see a
peak in BTC price of $90,400 set to hit somewhere between 14th of November and New Year.
I think the trend will be followed even on the downturn,
forming the 'Mother-of-all Head and shoulders patterns'.

Bitcoin Log Trend Curve - Feb 2025 peakJust wanted to draw a curve matchin the logarithmic trend of BTC price.
By this estimate we see a peak in Feb 2025 of about 95,000. But the price would only go down or sideways from here. I drew these lines in October of 23, but never published it - and so far it's following the trend. Just a fun thing I wanted to try, idk if it means anything.

SPY Fibonacci Price Theory And BreakOut BarsThis instructional video teaches you the basics of Fibonacci Price Theory in conjunction with Breakout Bars and how price is the ultimate indicator.
Throughout this video, I try to provide instruction on key elements related to the Fibonacci Price Theory (Unique & Standout Highs/Lows). Additionally, I've also included Breakout Bars and Fibonacci Price Retracement concepts.
What I really hope you learn from this video is to see price as the true ultimate indicator for your trading decisions. Using technical analysis techniques is fine, but use price as the key element when trying to confirm or reject your trading ideas.
I hope this helps you understand that price, action, and reaction through trends, peaks, and troughs are the most important components of the chart. Everything else is peripheral.

A Potential Correction on Bitcoin Incoming?Introduction
In the ever-evolving landscape of cryptocurrency trading, the ability to interpret market indicators is invaluable. The latest data from Bitcoin trading charts presents an interesting narrative: Bitcoin, the flagship cryptocurrency, might be showing signs of an impending shift in its market trajectory. The chart shown, which tracks Bitcoin against the US dollar, is overlayed with the Volume Exhaustion indicator that highlights peaks in trading volume. These peaks are more than just blips on the radar; they could signal critical junctures in Bitcoin's market cycle, possibly indicating the end of its current rally. In this article, we delve into the analysis of these indicators and explore the implications for Bitcoin's short-term future. Could we be on the cusp of a correction, or is the market simply catching its breath before climbing to new heights? Let’s explore what the chart suggests about the potential paths ahead for Bitcoin.
Potential End of the Bitcoin Rally
From the chart, we see volume peaks highlighted, which often coincide with significant price movements. High trading volumes can signal the climax of a price trend, especially when they occur at the peak of a rally. The reason is that high volumes reflect high levels of activity, which, at the end of a rally, might mean that most buyers who were willing to buy have already entered the market, leaving less demand to push the price higher.
Correction or Consolidation
After such peaks in volume and price, markets typically enter a correction or consolidation phase. A correction is characterized by a drop in price, where the market 'corrects' some of the gains made during the rally. This might happen due to various reasons, such as traders taking profits or a change in market sentiment. On the other hand, consolidation is a period where the price stabilizes and moves sideways. This could suggest that the market is in a state of indecision, with the forces of supply and demand nearly balanced.
Looking Ahead
Investors and traders might interpret the current situation as a signal to exercise caution. It could be a time to consider taking profits or hedging positions to manage risk. However, it's also essential to consider other market factors and news that might impact the price of Bitcoin.
Conclusion
The indicators on the chart suggest that we might be near the end of the current Bitcoin rally. While this could lead to a price correction or a consolidation phase , it's important for investors to conduct a thorough analysis, considering both technical indicators and market fundamentals before making investment decisions. As always, past performance is not indicative of future results, and it's crucial to approach trading with a solid strategy and risk management practices.

ORDI:USDT WHERE'S THE TOP?This post is based on the little information available at the time of its posting, so it's to be taken as speculative. There's not enough previous chart information to make a decent call, but based on the one method I do have that might suggest the best exit level, $110.00 appears to be it.
This is only an exercise in prediction, not trading advice.
I'll update this post if and when it reaches that level or in the event that it runs out of steam before getting there.
PS: THIS IS NOT A BUY SIGNAL!

GBPAUD I Returning to the peak and possible rejectionWelcome back! Let me know your thoughts in the comments!
** GBPAUD Analysis - Listen to video!
We recommend that you keep this pair on your watchlist and enter when the entry criteria of your strategy is met.
Please support this idea with a LIKE and COMMENT if you find it useful and Click "Follow" on our profile if you'd like these trade ideas delivered straight to your email in the future.
Thanks for your continued support!

EUR/AUD Possible Peak HighIt's looking like a selling opportunity at my levels above. I doubt its a peak that will hold for weeks but there's definitely some potential for downward movement afterwards. Calling tops and bottoms can be dangerous but if there is a time to do it, I believe that we are getting closer to that time. I believe that there are poor blokes underneath us who've been buying at what they they thought was the end and they are getting hit pretty badly now. Let's look for a push up possibly a squeeze and a yank back down. It's looking likely to come back down and will likely be revisited later to take us sellers out who got it right the first time. I'm confident in this setup because so far all of my methods are confirming a push down. If I'm wrong, this is where I want to be wrong at. It looks like a high probability set up based on how I'm analyzing it. If it looks too scary to get in as it pushes up, its understandable. It's much more dangerous for buyers in the coming days than sellers. The market can sell off at the time of this posting and that's okay. I'm only getting in at my levels and above. My setup is my booth and I wait for prices to come to me. FX:EURAUD

2021 a “Double Peak”-BullRun?! Last cycle , (if market manipulation is wasn’t a “thing”!)
Wonder where that vertical line on the right would have gone…
Hmm, perhaps we’ll see that somewhere soon!!
Anyone wants to buy a Bitcoin? Get ‘em while their hot!

Crypto total marketcap in late 2024 early 2025 at $33 TrillionA few points to consider a $33 trillion dollar crypto total market in late 2024 early 2025. As you can see from this 3 day chart that we have one low in 2015 at $2.1 Billion and the high of $792 Billion in 2018. The number of days from this low to the next high is approximately 1,066 days. If our next low comes in early 2023 and we use the 1,066 days for the next peak date will place the total crypto mktcap value at $33 trillion in late 2024 and or early 2025. The low in 2018 was $91 Billion and the high in 2021 was $3 trillion. By using calculating the percentage increase of the 2015 low to the 2018 high we get a 36k% increase and if we can duplicate this same increase for the next peak at 36k% will put the total crypto marketcap at $33 trillion dollars. I used a fractal from the low in 2015 to high in 2018 to give us a visual for the 2024-25 peak. I am also using the beambands to show the possible direction of this peak if we are oversold at $33 trillion.

Bitcoin price of $330,000 by end of 2025 scenario 2Using the BLX chart on the 2 days to show Bitcoin as a scenario 2 possibility for Bitcoin reaching this $330k value by April instead of the end of year 2025. there are certain parameters used to make this assertion. On the first bear market of 2014 from the bottom to the next higher low was about 220 days and then the bull started for the next cycle. The next was in the 2018 Bear where we had the first low at $3200 and then the next higher low at $3900 which represents about 454 days before the next bull cycle kicked in where Bitcoin hit a high of $69k in 2021. If we take this double increase difference and add it to this next cycle we will see a possible 800 days from the first low to the next higher low and we get our possible April date for the Bitcoin peak in 2025. I am using a fractal plus the Beambands as an indicator for this possible target price which coincides at top of beamband in 2025.

S&P500 short analysis!!30 min time frame.
used Fibonacci to draw (ABC) correction waves.
this days, US markets are been a lot volatile.
LET ME KEEP MY OPINION OF WHY MARKETS ARE VOLATILE:
SINCE MANY OF THEM THINK THAT US INFLATION HAS REACHED ITS PEAK, AND ON THE FLIP SIDE MANY OTHERS THINK IT YET MORE NEEDS TO TRAVEL UP. this basically is causing a lot of volume in the markets. bulls and bears are acting to there strategy.
ONE TIP: during volatile markets, be on cash, or invest in low risk assets.
be careful, keep having an eye.
trade with your own risk.

Head & Shoulders top on USO/SPX?The Covid Crash was like a reset on all assets and ever since, AMEX:USO has been outperforming the SP:SPX .
The ratio peaked on mid-June and it looks like is actullay forming a head & shoulders top.
This is bullish for stocks as I think the indexes already bottomed (in mid-June). But remeber, is not confirmed until the breakout on the neckline happens.

Something is going to break, DXY or SPX500 Ultimate editionDXY is going to top, the parabola on the DXY is comparable with meme stocks, unbelievable, they really did something wrong with the dollar, good luck for the American middle class, Dollars of tomorrow will be like the euros of today, a hot potato...
my playbook for the end of the year:
Short DXY
long SPX500

Something is going to break, DXY or SPX500 take your pick IIUpdate of the trend lines after the FMOC;
From here I would say it's safe to go long in stocks for the rest of the year, FOMC has reached peak hawkishness, inflation has peaked, the dollar is out of gas, almost not even moved after the FOMC, triple divergence in the monthly RSI ;
Right now I would take the contrarian attitude, I would short the Dollar and go long in the SPX500 .

Dollar is out of gas, has not moved even after the FOMCDXY officially peaked after J Powell meeting, IMHO, technically there are divergences at the month RSI, that is a inevitably reversion sign, is like a marathon runner drinking martinis, it will fall but when? I think the time has come

Peak to Trough, Anatomy of a Market CorrectionThere are a lot of discussions about whether or not the 2022 corrections bottom is in.
This idea attempts to compare the 2022 bear market correction with 2008.
Peak to Trough, the 2008 GFC lasted 17 months.
The 2020 and 2022 corrections were both nearly identical in price, but recovery in 2020 was assisted with QE while 2022 face increased tightening.
The problem with comparing the 2 corrections is that 2008 was a crisis, and 2022 as of yet, is not.
The Great Financial Crisis (GFC) was plagued with bad Sub-Prime mortgages in Mortgage Backed Securities (MBS) and Collateralized Debt Obligations(CDO) that turned record profits into crushing losses for lenders.
In 2008, Bear Sterns was bought by JPMorgan for $2/share and the Lehman Brothers filed for bankruptcy of 620 Billion in Debt, 7% the size of the Fed Debt.
Zoom out and you see the 2022 Trough found support at the 10Yr Regression Trend from 2009-2019.
Is the bottom in?
Difficult to tell, hard the future is to see.
I'll update the chart when a turning point occurs or continue to reach for all time highs.

DXY $119 target for short term Could we see the DXY target this curve metric all the way to $119? I am using a fractal as a visual for this possibility. This target has great resistance back in 2001 and 2002 as the DXY peaked several times. Interesting to see if we will respect this curved arch all the way through. This arch is parabolic till October 2022 if it respects the metrics.

The Fresh Print of Wall StreetNow, this is a story all about how
My rates got flipped-turned upside down
And I'd like to take a minute Just sit right there
I'll tell you how I became the fresh print of a town called Wall Street
In West Chicago born and raised
On the bond market was where I spent most of my days
Chillin' out, maxin', relaxin', all cool
And all buying' some spreads outside of a broker
When a couple of guys who were up to no good
Started shorting bonds around my neighborhood
I got in one little inversion and my investors got scared
They said, "You're movin' with your crypto and equities in Wall Street"
...
June CPI is upon us.
The question on everyones mind Is has Inflation peaked?
Based on June sell offs in Bonds, Crypto, Equities, Oil and other Commodities it's a pretty good sign that inflation will beat expectations tomorrow and come in lower.
Tomorrow also brings a window of weakness when VANNA and CHARM flows take a hiatus.
Setting up short term squeezes on tech names like AAPL
Regardless of direction, I think tomorrow will have some wild swings.

RVGI analysis on BTC Monthly ChartAll the ideas are on the chart. You need to know that you should ignore if RVGI crosses in series, it only makes sense if it crosses after not crossing for a long time.
I can see that I ignore a couple of things like we didn't spend all 365 days on bear market after last downside cross of RVGI, actually no explanation for that I just think from 64k to 69k in 7 months is not exactly bull market we just spend a couple of months correction and accumulation then tried to put another ride but the time was not right.

Next Cycle Top for BitcoinI want you guys to tell me when Bitcoin could possibly reach its next cycle top. I have three suns illustrating where this may happen. Out of these three which one do you think it will be?
