Bullish Reversal Breakout in PEiPEi/USDT with Target Zone Hello guys!
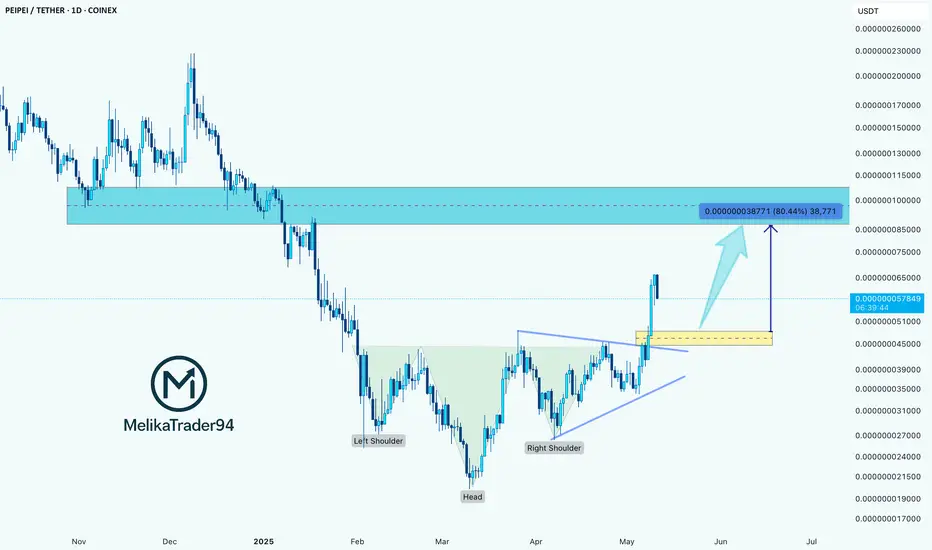
The PEiPEi/USDT daily chart presents a textbook inverse head and shoulders pattern, a classic bullish reversal formation. The structure is clearly labeled on the chart:
Left Shoulder: Formed in late January.
Head: Deep retracement bottoming in early March.
Right Shoulder: Completed in April with higher lows.
Neckline: Shown with a breakout accompanied by strong bullish momentum.
Following the breakout above the neckline, price action surged, breaking above a consolidation wedge and validating the pattern. The breakout is supported by volume and momentum, indicating strong bullish conviction.
Key Zones:
Breakout Level (Yellow Box): Around 0.000000045 – 0.000000050 USDT, acting as immediate support on a retest.
Target Zone (Blue Box): Marked around 0.000000085 – 0.000000100 USDT, representing a projected 80% upside move from the breakout point. This target aligns with a previous major supply/resistance zone from late 2024.
Peipeicoin
Peipei in accumulation phase - Moon BoysPeipei in accumulation phase, soon take off, first target point - I don't know and you don't even. Sell when you take 1200% profit.

PEIPEI breakout imminent - Chinese PeipeiPeipei can be seen breaking out from its bearish mode.
A 2000% on the way

peipei → this coin has potential to hold but wait...hello guys,
let's dive into MEXC:PEIPEIUSDT analysis:
technical point:
1- it is in a descending channel!
2- it is forming a head and shoulders pattern!
3- there is a reachable area in front!
the key areas to watch:
1- waiting for a broken channel!
2- waiting for a broken neckline!
targets for the long position:
1- 0.0000017 area as the target of the head and shoulders pattern!
2- 0.0000024 area as the previous engulfing and a reachable area!
