EURUSD FORMED BEARISH PENNANT. THE PRICE IS READY TO DROP.EURUSD FORMED BEARISH PENNANT. THE PRICE IS READY TO DROP.
EURUSD has been trading sideways within the last day, showing lower highs and higher lows. Eventually, the price has formed the pennant chart pattern.
What is a pennant?
A pennant chart pattern is a short-term continuation pattern in technical analysis, resembling a small symmetrical triangle, formed after a strong price movement (flagpole). It consists of converging trendlines, indicating a brief consolidation before the trend resumes. Bullish pennants form after an uptrend, bearish pennants after a downtrend.
The price is expected to decline towards 1.14500 support level
Penant

EURUSD REACHED THE TARGET.EURUSD REACHED THE TARGET.
EURUSD has reached the 1.14500 level and even broke it down. Currently the price consolidates slightly below this level. If the price forms a false breakout of 1.14500 level, this will mean the end of short-term decline in the pair. Stay cautious.

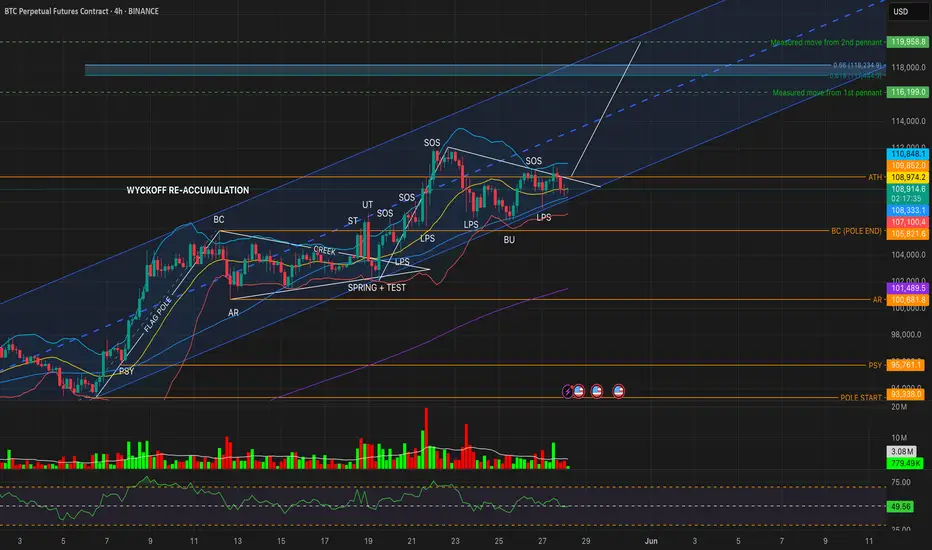
BTC 4H – Final Shakeout Before Markup?Bitcoin continues to coil below ATH resistance, now forming a second symmetrical pennant after the first flagpole breakout. Price is wedged between the ascending trendline support and persistent ATH rejection (~109.8K) — and the next move could define the entire Phase D → Phase E transition.
🧠 Wyckoff Reaccumulation Context:
✅ Spring + Test confirmed ~May 19
✅ Multiple LPS retests held around 107–108K
✅ Two clear SOS rallies tested above the creek
📌 Currently in late Phase D, facing third rejection from ATH
⚠️ Compression Observations:
RSI (14): 49.88 → neutral to bearish momentum
Volume: No conviction from either side
Lower BB + BU lows (~107K): A logical Spring zone for a potential wick-down fakeout
Price remains within channel and trendline support
🔄 Key Scenarios:
🟡 Bullish (Spring + Markup)
Wick below trendline to 107K zone
RSI bounce + green volume spike
Break + close above 110K → Confirms Phase E Markup
🎯 Targets:
Measured Move 1: 116,199
Measured Move 2 (Pennant): 119,958
Fib Cluster: 117,444 – 118,234
🔴 Bearish Breakdown
Close below 107K LPS with volume
RSI drops < 45
Structural failure → risks reversion to AR (~100.6K) and possibly BC
🧭 Conclusion:
Bitcoin is in the decision apex of a second pennant. If we see a wick-down + bounce (Spring-like behavior), it could be the last reload before a markup wave.
But without volume and momentum, this remains a fragile structure — stay patient, let the chart confirm.
#Bitcoin #BTCUSDT #Wyckoff #Pennant #CryptoTA #BTC4H #VolumeAnalysis #RSI
Bitcoin Retesting ATH with Measured Move Target at 116KBTCUSDT (1D): Bitcoin has broken out from a tightly formed bull flag / pennant within a rising channel. The breakout is confirmed by a daily close above 105,863, reclaiming mid-channel structure and pushing toward the ATH zone near 110K.
Measured move target from the pattern sits at 116,199, which aligns closely with the upper boundary of the trend channel and 0.618 fib extension confluence zone suggesting that any breakout above ATH could run into profit-taking near that region.
Key Levels:
Pennant base: 93,327
Pennant top: 105,863
Breakout trigger: 103,663
TP1: ATH / Upper BB zone ~110,000
TP2: Measured move target / Channel top ~116,199
SL: Below 101,853 or 55 SMA (conservative exit if structure fails)
📈 Volume supports the move
📊 RSI strong at 72.57 but not yet overheated
📌 As long as price holds above 105K, structure remains bullish

BTC USD bullish pennant inside a rising broadening wedgeBullish pennant forming for continuation inside a big rising broadening wedge
If successful this pennant could take bitcoin to 102k as first stop before a second consolidation.
Right now trading the pennant, not the broadening pattern, which is still forming but could reach a target around 111k

Maruti Suzuki: Symmetric Triangle Pattern and Key Levels 🔄 Symmetric Triangle pattern indicating possible breakout on either side
📈 Key resistance at 13,170 and 13,551
📉 Strong support levels at 11,884 and 11,200
Awaiting clear direction for potential trading opportunity
📊 Follow for analysis!

TANAA - Swing Trade OpportunityTANEJA AEROSPACE looks good for a swing trade.
Coming out of 9 days old consolidation - Bullish Penant - Trend continuation, will be confirmed with today's close of Morning star Reversal. Entry can be in the range of 346-356.
Target 1 - 380
Target 2 - 425
Target 3 - 480

Learn to identify some useful Chart patterns, Merry Christmas🎄 Unlocking the Secrets of Chart Patterns: Navigating Market Trends 📈
Season's Greetings to all our readers! As we celebrate the spirit of the holidays, let's delve into the fascinating world of financial markets. In our journey to understand and navigate the complexities of trading and investing, we've touched upon essential chart patterns that can serve as invaluable guides for market enthusiasts.
In the midst of the festive cheer, let's revisit some of these powerful indicators: the Double Bottom, Flag and Pole, Bullish Pennant, Rising Wedge, Falling Wedge, Triple Top, and Inverted Head and Shoulders. Understanding these patterns can be akin to unwrapping gifts of insight into potential market movements.
So, grab a cup of cocoa, settle into your favorite chair, and join us as we explore the significance of these chart patterns and share practical tips on incorporating stop-loss strategies to enhance your trading toolkit.
Wishing you a Merry Christmas filled with joy, warmth, and prosperous insights in the financial markets! 🎅🎁🚀
Double Bottom:
Description: Imagine a smiley face turned upside down. A double bottom is a chart pattern that looks like two rounded troughs (bottoms) next to each other.
Interpretation: Indicates a possible reversal of a downtrend. The price has tried to go down twice but failed, suggesting a potential upward movement.
Stop-Loss Tip: One can place a stop-loss slightly below the lowest point of the double bottom. If the price falls below this level, it may invalidate the pattern.
Flag and Pole:
Description: Think of a flag on a flagpole. The "pole" is a strong, quick price movement, and the "flag" is a rectangular-shaped consolidation pattern.
Interpretation: The flag and pole pattern often signals a continuation of the previous trend. The flag represents a brief pause before the price resumes its original direction.
Stop-Loss Tip: One should set a stop-loss just below the lower end of the flag. If the price drops below this level, it might suggest a reversal of the trend.
Bullish Pennant:
Description: Similar to the flag and pole but with a small symmetrical triangle (pennant) instead of a rectangle.
Interpretation: Indicates a temporary consolidation after a strong upward movement. It suggests that the bullish trend might continue after the brief pause.
Stop-Loss Tip: Place a stop-loss under the lower trendline of the pennant. A break below this line could signal a potential trend reversal.
Rising Wedge:
Description: Picture a triangle with its top side steeper than the bottom side. The price makes higher highs and higher lows but in a narrowing range, with indicator making Lower Highs (Bearish Divergences).
Interpretation: This pattern can indicate a potential reversal to the downside. It suggests that the buying interest is weakening, and the price may soon decline.
Stop-Loss Tip: Place a stop-loss just above the last price swing high of the wedge. If the price drops below this line, it may suggest a potential reversal.
Falling Wedge:
Description: Similar to the rising wedge but inverted. The top side is less steep than the bottom side.
Interpretation: Represents a potential reversal to the upside. It suggests that selling pressure is weakening, and the price may be ready to move higher.
Stop-Loss Tip: Place a stop-loss just below the last price swing low of the wedge. If the price drops below this line, it may suggest a potential reversal.
Triple Top:
Description: Visualize a horizontal line touching the tops of three consecutive peaks.
Interpretation : Indicates a possible reversal of an uptrend. The price has failed to break above a certain level three times, suggesting a potential downturn.
Stop-Loss Tip: One should set a stop-loss slightly above the highest point of the triple top. If the price rises above this level, it may negate the pattern.
Inverted Head and Shoulders:
Description: Picture three troughs, where the middle one (head) is lower than the two on either side (shoulders).
Interpretation: This pattern suggests a potential reversal from a downtrend to an uptrend. It signifies a shift in momentum from bearish to bullish.
Stop-Loss Tip: One should place a stop-loss just below the neckline (the line connecting the highs of the pattern). If the price falls below this line, it might indicate a failed reversal.
I am not Sebi registered analyst. My studies are for educational purpose only.
Please Consult your financial advisor before trading or investing. I am not responsible for any kinds of your profits and your losses.
Most investors treat trading as a hobby because they have a full-time job doing something else.
However, If you treat trading like a business, it will pay you like a business.
If you treat like a hobby, hobbies don't pay, they cost you...!
Hope this post is helpful to community
Thanks
RK💕
Disclaimer and Risk Warning.
The analysis and discussion provided on in.tradingview.com is intended for educational purposes only and should not be relied upon for trading decisions. RK_Charts is not an investment adviser and the information provided here should not be taken as professional investment advice. Before buying or selling any investments, securities, or precious metals, it is recommended that you conduct your own due diligence. RK_Charts does not share in your profits and will not take responsibility for any losses you may incur. So Please Consult your financial advisor before trading or investing.

GBPCHFGBPCHF currently trading converging triangle and making support around 1.11500 region with in triangle . Will it break through triangle for bullish trend ?

KAVAUSDTKAVAUSDT is currently at a strong resistance area, resistance from previous support and falling trendline will push the price to downside?

More downside for SPX500Given a bearish pennant is forming on the hourly / 2 hourly and triangles commonly form as a wave 4 I expect more downside incoming for OANDA:SPX500USD SP:SPX

FTM/USDT. BitVero Crypto Academy.
Disclamer:
We are not financial advisors. The content that we share on this website are for educational purposes and are our own personal opinions.

LONG bias on XAUUSDjust a bias on the gold, the chart pattern is a simple one, this move broke the high of the penant marked out, I'd probably love to see a move to 1952's then see what happens there, invalidation is a HTF close below 1916.

ADA Trading in a Channel,Possible Pennant, Maybe Signature Move ADA currently in the channel trading, look for a move. Looks like at 254PM EST we have a pennant forming for a possible signature move. We shall see

BTC PENANT Breakout trade setup$50,086 target upside breakout, $40,318 target downside breakout. We are losing negative momo on the daily, something to keep in mind.

GBPJPY AnalysisThe market seem to be forming a triangle penant on the H4. And a penant signifies a trend continuation. It's left to the market to do as she pleases.
On the daily
On the weekly

BTC @ BULLISH /ENTER MISSED TARGETS NOWPHEMEX:BTCUSD BINANCE:BTCUSD
BTC Is still bullish for who missed the entries have a chance to enter long as BTC retesting some key level supports. After retesting BTC will sure goes to 🌙. Nearly 72k.
Resistance at 61300,60500
Supports retesting are selected for entering position
Entries 1st 59000
2nd 58000
3rd 57500 ( Lower Major Support )
Leverage X2 / X5 Max
Stop lose @5%
Always put trailing or stop losea above entries.
I'm only sharing my perspective on how BTC should go.
Above mentioned entries are mine not advised to follow.
Always DOYR before entering trades.
This is not a financial advice.

Short Term vison of ADA, What do you think ?Consolidation going on with sustained increase of lows and top being clearly mark at 1.50


NVDA Inverse Head and shoulders break out of penant consolidati NVDA has been consolidating for a while. There's rumors of NIO and NVDA working together on EV. This inverse head and shoulders combined with this news could give NVDA the strength it needs to break out of consolidation.
Above 540 has room to 550
Above 550 is Blue Skies!


BTC Symmetrical TriangleBitcoin BITMEX:XBTUSD is in a symmetrical triangle, trying to decide if it should break ATH or it should go down to fill in the BTC Futures gap. Either way I am waiting for a trendline break and close for a confirmation for a trade.

Major Move Incoming...Looks like Bitcoin will be seeing a major move in the next 2 to 3 day. I'm 70% Bullish, 30% Bearish. Trend is Bullish so I'm currently looking at long plays.. Don't get complacent, the trend is your friend until the end. So make sure to have an exit plan.. Best of luck everyone..
