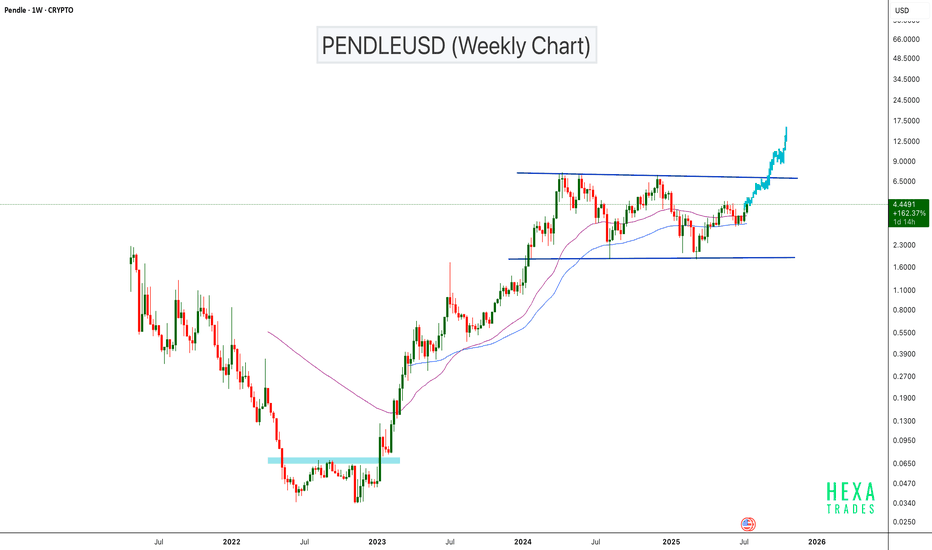
PENDLEUSD Bullish Continuation Setup!BINANCE:PENDLEUSDT has surged approximately 20,000% from its bottom, showing exceptional long-term strength. The price is now approaching a major horizontal resistance zone on the weekly chart. If the price breaks the parallel channel resistance, we can expect a bullish continuation with a psychological target of $15.
Cheers
Hexa
CRYPTOCAP:PENDLE CRYPTO:PENDLEUSD
Pendleusdtperp
PENDLEUSDT 📈 PENDLEUSDT 4H Analysis:
Price rebounded from the 2.444 demand zone after a short-term breakdown and is now stabilizing above the 200 EMA, with the bullish trendline still intact. Key resistance lies at 3.219, and breaking it could open the path to 3.602. However, a drop below 2.626 and the trendline may trigger a deeper correction.
#PENDLE/USDT#PENDLE
The price is moving within a descending channel on the 1-hour frame and is expected to continue upward.
We have a trend to stabilize above the 100 moving average once again.
We have a downtrend on the RSI indicator, which supports the upward move with a breakout.
We have a support area at the lower boundary of the channel at 2.63.
Entry price: 2.85
First target: 3.07
Second target: 3.20
Third target: 3.40
PendleUSDT Long IdeaIf Pendle comes to fill the 50% of the 4hr wick which is where the 1hr 50ema sits, I'll attempt a long for 7.12RR towards the nearest available 1D 50% of an unfilled wick, which is at 7.265.
Please, share your opinion on this bias in the comments section. If you take it, let me know.
PENDLEUSDT Bearish Wedge PatternPENDLEUSDT Technical analysis update
PENDLE has formed a Raising wedge pattern on the daily chart, and the price has recently broken below the wedge's support line in day chart. This breakdown suggests potential bearish momentum in the coming days, with a possible decline toward lower support levels.
PENLDEUSDT Bullish Head and Shoulders Pattern.PENDLEUSDT Technical analysis update
PENDLE's price is breaking the inverse head and shoulders neckline on the daily chart, with the 100 and 200 EMAs acting as support for the right shoulder. We can expect a potential bullish move in PENDLE
Buy zone : Below $5.00
Stop loss : $4.40
Take Profit 1: $5.48
Take Profit 2: $6.15
Take Profit 3: $8.00
Regards
Hexa
PENDLE target 74h time frame
-
Entry: $3.7
TP: $7
SL: $3.03
RR: 4.93
-
(1) Completed first wave; Doing second wave; Ready for third wave (Refer to following link)
(2) Big bottom head and shoulders pattern is creating
(3) Got support twice at fib projection 0.618, but be careful the possibility to reach 0.5
(4) Target for fib projection is $7
(5) Stop loss once going below $3.03
-
Previous Analysis-PENDLE reached target
PENDLE target 4.66(short-term)4h time frame
-
Entry: $2.7
TP: $4.66
SL: $2.15
RR: 3.56
-
(1) Potential bullish flag on 4h
(2) Got support around Fib 0.382, high possibility reach 1.618 if stop falling here
(3) Fib 1.618 is also overlapped with structural resistance at $4.66
(4) Stop loss once going below $2.1
PENDLE target 8.9712h time frame
-
TP: $8.97
SL: $4.49
RR: 8.76
-
(1) Convergence pattern is be building. *two potential support lines
(2) 0.382 fibonacci projection at $3.8
(3) Target matches fibonacci projection_0.382 & fibonacci extension_2.618
(4) Stop loss while triangle bottom got breaking down
PENDLEUSDT Next Target $2.00PENDLEUSDT Technical Analaysis Update
PENDLEUSDT has formed a cup and handle pattern on the daily chart. Now that the price has broken through the cup and handle resistance (neckline), we can expect a 50% move from the current level.
Buy zone : Below $1.23
Stop loss : $1.10
Always Keep StopLoss
Regards
Hexa


