After exiting from pennant, BNB can continue grow to 240 levelHello traders, I want share with you my opinion about Binance Coin. Observing the chart, we can see that the price some time ago declined to the buyer zone, breaking the support level, and even later declined to lower this zone, but soon it rebounded back, making a fake breakout of the 245 level. Also, BNB started to trades in a range, where it later rose to the top part, but then rolled a little down. After this, the price made an upward impulse to the current support level, thereby exiting from the range and entering the pennant. In the pennant, BNB broke the 308 level, which coincided with the support area, and a few moments later reached the resistance line of the pennant. After this movement, Binance Coin bounced from this line and in a short time declined to support the area, but recently price rebounded up from this area and even soon broke the resistance line, thereby exiting from the pennant. So, now I think that Binance Coin will fall to the support area first, and then it can continue to move up. For this case, I set my target at the 240 level. Please share this idea with your friends and click Boost 🚀
Pennant


ADA may perform upward movementIf it gives a buying opportunity, I will buy at $0.6. With a tight stop-loss, it could be a profitable opportunity in the short term.

Bullish Pennant Flag on EURUSD 1 Hour TimeframeAs you can see, price has breakout from the flag and it provides an opportunity for Buying Setup.

ORDI Over?If you find this information inspiring/helpful, please consider a boost and follow! Any questions or comments, please leave a comment! Also, check out the links in my signature to get to know me better!
#ORDI update.
Took profit on my $8 entry near the 5 of 3 projections.
Entered more on 52.61.
TP on that here as well.
#Elliottwave and TDU giving some corrective vibes here, circled.
65.491 breaks, looking for min a ZZ.
75.349 kills ideal.
🥂

BTC Decision Time Bitcoin is currently compressed between the upper Point of Control (red line) and the 21 Daily Moving Average
Its CRYPTOCAP:BTC decision time folks....
POC Definition: The PoC represents the price level at which most trading activity has occurred, indicating the highest liquidity and traded volume. It is often depicted as a horizontal line on a volume profile and can be used to identify the overall market trend and potential reversals.

🚧ICXUSDT is Bullish now🚧 & many Traders don't see it 👀!!!Hi every one
➡️ICX has done a Impressive Movement recently but the odds of another bullish Movement is Pretty high because the pattern which ICX is in, Is a Bullish Pennant Pattern! Since The break out has not happened, there is no confirmation of a Bullish Movement But If It happens, we Can Expect a Bullish Movement as much as the Measured Price movement (Pennant pole) to happen!
🟡Summery:
-ICX has been Bullish Recently!
-The odds of another Bullish Movement is High!
-Bullish Pennant is Visible on The chart!
-No break out yet!
🤑Stay awesome my friends.
_ _ _ _ _ _ _ _ _ _ _ _ _ _ _ _ _ _ _ _ _ _ _ _ _ _ _ _ _ _ _ _ _
✅Thank you, and for more ideas, hit ❤️Like❤️ and 🌟Follow🌟!
⚠️Things can change...
The markets are always changing and even with all these signals, the market changes tend to be strong and fast!!

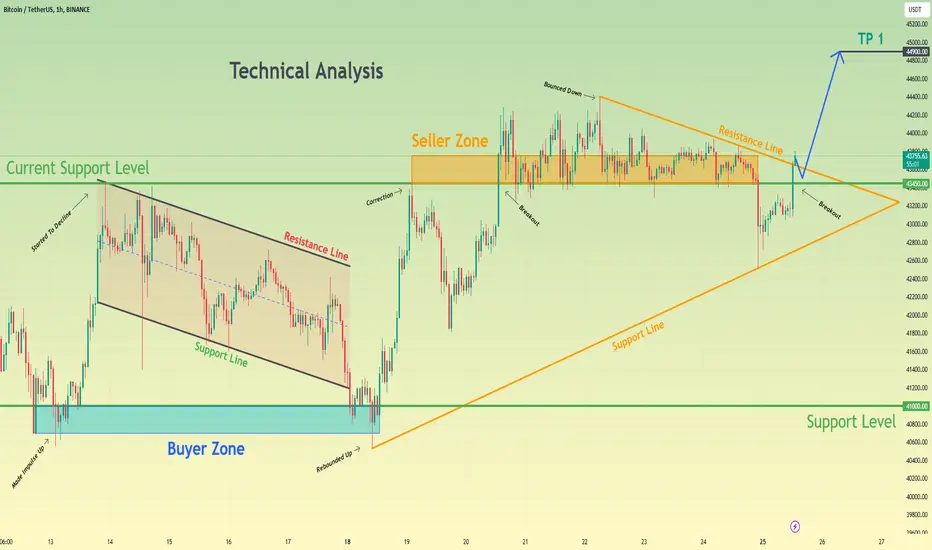
After exiting from pennant, Bitcoin can continue grow to 44900Hello traders, I want share with you my opinion about Bitcoin. By observing the chart, we can see that the price declined to the 41000 support level, which coincided with the buyer zone, it at once rebounded and made impulse up to the 43450 resistance level. Then BTC started to decline in a downward channel, where it in a short time declined back to the buyer zone. After this movement, the price reached the support line of the pennant and made a strong upward impulse until to resistance level again. When BTC reached the resistance level, it at once bounced below, correcting and after this, the price continued to rise to the resistance line of pennant. Also, the price broke the 43450 resistance level, which coincided with the seller zone, but when it reached the resistance line of the pennant, Bitcoin bounced and soon fell lower than this level. Price declined to support line and a not long time ago bounced up to resistance level and broke it again. At the moment, Bitcoin trades close to the resistance line of the pennant and I think that the price can, after exiting from this pattern, make a correction below and then continue to rise. Therefore I set my target at the 44900 level. Please share this idea with your friends and click Boost 🚀
LINK-Beautiful Rising ABC Flag, Stair Stepping Up Out Of A Wedge#LINK
- Beautiful Rising ABC Flag
- Stair Stepping Up Out Of A Wedge
- Multiple Precision Touches On POI's
- Observe Reactions From POI's
- Volume In All The Right Places
= Number Go Up

ADA triangle eh!?If you find this information inspiring/helpful, please consider a boost and follow! Any questions or comments, please leave a comment! Also, check out the links in my signature to get to know me better!
Playing out quite nicely since the start. 🧵
Hitting many markers for a running triangle.
IF it prints, want to see the volume come in.
Pretty does NOT equate definitive.
Cheers

LUNA retest from resistance BINANCE:LUNAUSDT
In my last article, I have discussed about a LUNA breakout.
LUNA has corrected from local range resistance, and are retesting the pennant upper boundary.
I expect an upward movement from the support, and will hold the previous order.
If LUNA manages to break the local range resistance, an upward movement to 1.28 is expected. Good luck!

BTC Double Bullish PatternGood day everyone,
Here you can see two patterns we broken out from a descending triangle with a target of around 46k and we are also consolidating in a ascending triangle similar to what we was doing around 34k-38k. My TA is this we will drop to test the 100MA around the 38k mark before it take out 49K for the ascending triangle.
I, very bullish on bitcoin I expect a 20-25 % move when the ETF is approved and then a 50-60% dump after.

Bullish Pennant Pattern is Formed on Gold ChartBullish Pennant Pattern is formed on Gold Chart. Gold will soon exceed $2140 and silver $25.5. However, Silver is likely to break the 1-year Triangle Pattern. If 25.7 is broken, I expect that the price will reach 28 in short term.
Gold is expected to reach $3000 and silver to $45 in long term.

will Bitcoin increase?Hi every one
➡️BTC has done a Impressive Movement recently but the odds of another bullish Movement is Pretty high because the pattern which BTC is in, Is a Bullish Pennant Pattern! Since The break out has not happened, there is no confirmation of a Bullish Movement But If It happens, we Can Expect a Bullish Movement as much as the Measured Price movement (Pennant pole) to happen!
🟡Summery:
-BTC has been Bullish Recently!
-The odds of another Bullish Movement is High!
-Bullish Pennant is Visible on The chart!
-No break out yet!
🤑Stay awesome my friends.
_ _ _ _ _ _ _ _ _ _ _ _ _ _ _ _ _ _ _ _ _ _ _ _ _ _ _ _ _ _ _ _ _
✅Thank you, and for more ideas, hit ❤️Like❤️ and 🌟Follow🌟!
⚠️Things can change...
The markets are always changing and even with all these signals, the market changes tend to be strong and fast!!

NEO Another leg up?NEO has been maintaining a working uptrend for a period of a month and a half. The triangle breakout also looks quite likely. Maybe a new rally could happen if the market allows it. If the market moves down, see you in hell...

Heranba - Big breakout - Bullish pennantHeranba after consolidating for few months is looking for a good breakout and forming a bullish pennant.
Target of 460 i.e 20+% returns within a month

$DIMO good for nearly 100% upside?DIMO has had multiple tests of the $.135 level and is now consolidating in a bull pennant below resistance. Should price break the resistance right above the bull pennant, it should propel price up into the $.23 range (or maybe higher).

FDX "FedEx" EarningsI see FDX forming a Bullish Pennant after surpassing a 52-week high and going into earnings. We have also seen record highs in online sales which signify an exceptional increase in Shipping/Transportation. I see this benefitting both FDX and UPS for their upcoming earnings reports and forward guidance. Let's see how this plays out!

Gold can rebound down from seller zone to 2005 levelHello traders, I want share with you my opinion about Gold. Observing the chart, we can see that the price some days ago traded in a range, where it tried to rise more, but failed and soon rolled down to the 1975 support level, which coincided with the buyer zone. In a short time price broke this level, thereby exiting from the range too and falling to the support line of the pennant. Next, the price rebounded from the support line and made a strong upward impulse to the resistance level, which coincided with the seller zone, breaking the 1975 level again. After this, XAU a little corrected below and then bounced up to the resistance line of the pennant, thereby breaking the 2045 level. But soon, Gold around down and in a short time declined lower resistance level to support line of the pennant, and also later it exited from the pennant too. Then price declined to the support level and a not long time ago rebounded up to the resistance level, where it trades very close to this time. For my mind, Gold can rise to the seller zone and then rebound down. So, for this case, I set my target at the 2005 level. Please share this idea with your friends and click Boost 🚀

ADA more bull to come?ADA pennant breakout, and re-test support $0.55 with Hammer alike candle.
MACD momentum still favor to the bull
we are seeing more bull. as long as price above $0.55

Ascending Triangle or Bearish Pennant for Ethereum....It appears as though Ethereum has broken the horizontal resistance of an Ascending Triangle or Bearish Pennant....
ideally we want to see the old resistance turn into new support, I do not expect that to happen.
A re-test of the upward sloping support of the pattern is like to occur.

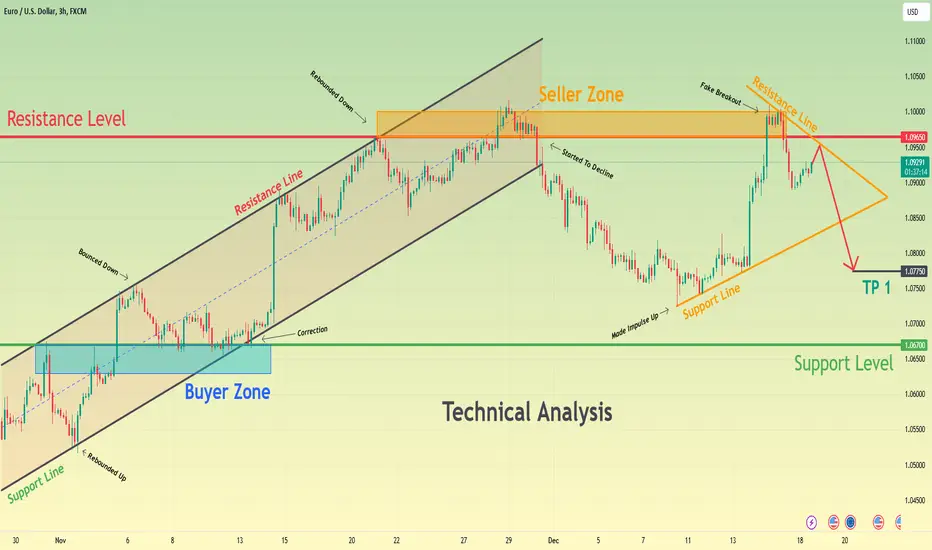
Euro can fall to support line and try to exit from pennantHello traders, I want share with you my opinion about Euro. Looking at the chart, we can see how the price some days ago started to rise in an upward channel, where it first reached the support line and then rebounded up to the 1.0670 support level, which coincided with the buyer zone. Later Euro broke this level and reached the resistance line of the channel, but in a short time price corrected to the 1.0670 level. Next, the price rebounded from this level and rose to the resistance level, which coincided with the seller zone, but at once it bounced down and some time rising below it. A few moments ago Euro entered to seller zone, breaking the 1.0965 level, but soon price around down and made a downward impulse, thereby breaking the resistance level again and exiting from the upward channel. After this, the price entered to pennant, where it tried to break the resistance level again, but a not long time ago Euro fell back and now it trades near the resistance line of the upward pennant. So, in my mind, the Euro can reach the resistance line and then rebound down the lower support line, thereby exiting from the pennant. Also, I think the price can continue to fall, therefore I set up my target at the 1.0775 level. Please share this idea with your friends and click Boost 🚀
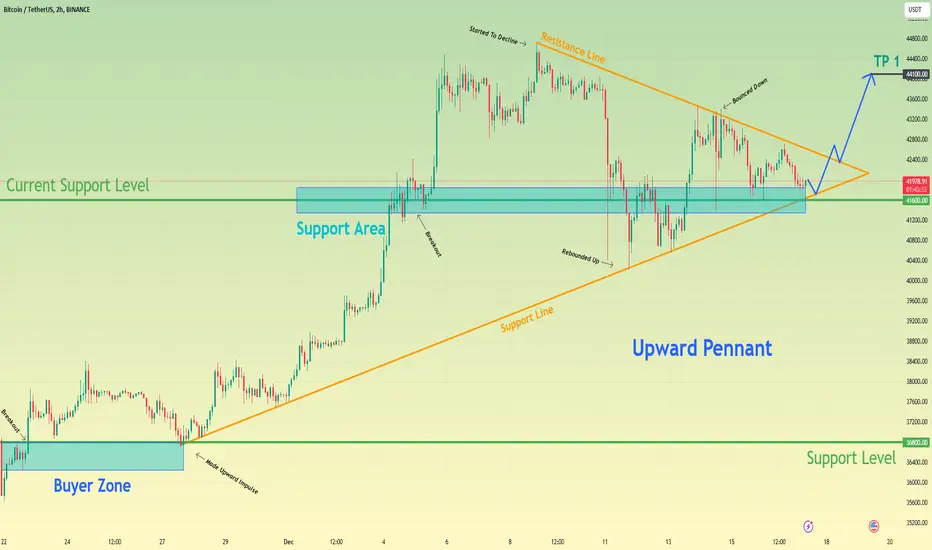
Bitcoin can correct to support line and then make upward impulseHello traders, I want share with you my opinion about Bitcoin. Observing the chart, we can see that the price some time ago reached the 36800 support level, which coincided with the buyer zone and in a short time broke it. Then BTC rose a little more, but soon it made a correction back, after which it entered to upward pennant. In pennant, the price at once rebounded from the support line and made a strong impulse up to the current support level, which is located in the support area. Later BTC broke this level too and continued to move up to the resistance line of the pennant. After it reached this line, the price around down and in a short time declined to the support line, breaking the 41600 level, but a not long time ago it backed up. As well recently, Bitcoin reached the resistance line of a pennant, after which it rebounded to the support area. And now BTC continues to trades near this area and in my mind Bitcoin can correct to support line of pennant and then make an upward impulse, thereby exiting from this pattern. For this case, I set up my target at the 44100 level. Please share this idea with your friends and click Boost 🚀