XAUUSD Bearish Pennant Breakdown | Retest in Play – 3090 TargetGold (XAUUSD) has been in a corrective phase after reaching the resistance zone around 3370–3420 USD, where the price was previously rejected with strong selling pressure. Over the past sessions, price action has developed into a Bearish Pennant pattern, typically seen as a continuation pattern in a downtrend.
Following a sharp drop from the highs, the price consolidated between converging trendlines, creating lower highs and higher lows. This structure resembles a pennant or triangle formation, which traders often interpret as a pause before the next leg down.
🔍 Key Technical Features:
1. Resistance Zone (3370–3420 USD):
Strong institutional selling observed here.
Multiple rejections confirm this zone as a significant supply area.
This area also serves as a risk management reference point for stop-loss placement.
2. Support Zone (3210–3230 USD):
The price bounced multiple times from this level, making it a key demand area.
A clean break below this zone would confirm bearish continuation.
3. Trendline Resistance:
A descending trendline has been respected consistently since May 8.
Price recently retested this trendline after a minor pullback, aligning with the bearish pennant structure.
4. Bearish Pennant Pattern:
Forms after a strong downward impulse.
The consolidation is narrowing within converging trendlines.
A breakdown with high volume typically leads to a continuation of the prior trend.
5. Breakout & Retest:
Price has already broken below the pennant's lower boundary.
The current move is a retest of the broken trendline—a classic setup for entering a short position upon rejection.
🎯 Bearish Target Projection:
The measured move from the pole of the pennant suggests a target around 3090 USD.
This level is derived by taking the height of the initial drop before the pennant and projecting it downward from the breakout point.
🛑 Stop Loss Strategy:
A conservative stop loss can be placed just above the 3370 USD resistance zone.
Alternatively, a tighter stop could be placed slightly above the trendline (~3240–3250) for aggressive entries, though this increases the risk of a false breakout.
✅ Trading Plan Summary:
Aspect Level / Detail
Entry Zone After retest & rejection (near 3230–3240 USD)
Target 3090 USD
Stop Loss Above 3370 USD
Risk-Reward Approx. 1:3 or higher
Pattern Type Bearish Pennant
🧠 Final Thoughts:
This is a textbook bearish continuation setup with strong confluences:
Trendline resistance
Bearish pennant formation
Breakdown with retest
Clear resistance and support zones for managing risk
If momentum sustains to the downside after the retest, we could see a swift drop toward 3090 USD, offering a favorable shorting opportunity for swing and intraday traders alike.
Always confirm with volume and candlestick confirmation before execution. Stay updated with fundamental drivers such as CPI, PPI, or FOMC comments, which can inject volatility.
Pennant

GMDC , 1WPattern is Looking very Great and is Ready to Breakout ,
if it broke the upper trendline with Good Volume then we can consider it is the best breakout
Follow for more Swing Ideas Like this

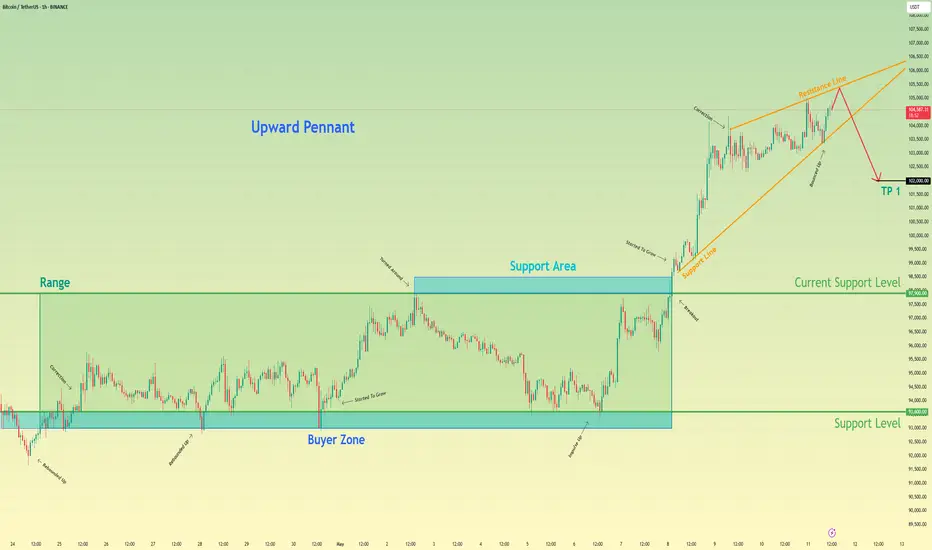
Bitcoin may drop to 102K points, exiting from pennantHello traders, I want share with you my opinion about Bitcoin. After breaking out of a multi-day range and launching a strong impulse from the buyer zone, the price has formed a clear upward pennant pattern. This technical formation often signals a potential slowdown in the bullish momentum, especially when it follows an aggressive move to the upside. The current price action shows that BTC has approached the resistance line of the pennant, but failed to generate further breakout strength. Each new impulse within the structure has weakened, and the market is starting to compress inside narrowing boundaries. The support area has been holding the structure temporarily, but the inability to push through the top of the pennant suggests growing exhaustion among buyers. This setup indicates that BTC may soon break downward from the pennant. So, I expect that it will make a correction that could drive the price down to the 102000 points, thereby exiting from pennant pattern. Please share this idea with your friends and click Boost 🚀
Gold will continue to grow and exit from pennantHello traders, I want share with you my opinion about Gold. After looking at this chart, we can see how the price of Gold has been developing inside an upward pennant, formed after a powerful impulse from the buyer zone. This earlier move created a strong bullish foundation, supported by consistent reactions from the support area, which has since become a key defensive level. After the breakout from the upper boundary of the previous ascending channel, the price entered a phase of consolidation. However, rather than fading, the price action has remained tightly squeezed between the support line and the resistance trendline, creating the structure of a classic pennant. This pattern usually signals continuation, especially when supported by strong preceding momentum, which is exactly what we’re seeing here. Currently, the price is hovering around the support line of the pennant and has already shown signs of bouncing back up. If this rebound continues, the next logical move is a breakout through the resistance line of the pennant, with the 3450 level as a target. It aligns perfectly with the upper boundary and represents a strong technical TP1. Please share this idea with your friends and click Boost 🚀

ADA Sleeping Beast !Hello Traders 🐺
As you might have guessed from the title, this ADA pattern could easily deliver an 80%+ pump.
I kept everything simple and clear on the chart — and minimized the text here — so let’s keep it short and straight to the point:
After the FOMO triggered by the U.S. crypto reserve news, we saw a huge bullish harami candle 📈.
But right after that, price dumped due to the tariff war tensions, and now ADA is trading below a very important daily resistance around $0.7667.
In my opinion, this is the key level to watch right now 👀.
If the price breaks above $0.7667 with confirmation, we could see a massive rally up to the next major resistance zone between $1.17–$1.30! 🚀🔥
So make sure to act accordingly, and as always remember:
🐺 Discipline is rarely enjoyable, but almost always profitable. 🐺
🐺 KIU_COIN 🐺

Euro will exit from pennant and grow to resistance levelHello traders, I want share with you my opinion about Euro. Looking at this chart, we can see how the price, after a strong upward impulse, the price entered into a consolidation phase, forming a classic upward pennant pattern. Throughout this structure, the price repeatedly respected both the support line and resistance line, tightening inside the pennant while still holding above the support level at 1.1300. This zone, between 1.1280 and 1.1300, marked as the buyer zone, has acted as a strong floor multiple times. Every touch to this area sparked bullish reactions, and most recently, we can see the rice once again starting to grow after dipping into this zone. On the upper side, the resistance level at 1.1430 coincides with the breakout target of the pennant, and also lies just below the seller zone, making it a logical TP 1 area for bulls. The current price action suggests that after a minor pull-back, the price may test the lower pennant edge and then rebound, potentially initiating an impulsive breakout toward 1.1430. Given this structure and the strong base forming around 1.1300, I expect Euro will grow upward toward my TP 1 at the 1.1430 level, thereby exiting from the pennant. Please share this idea with your friends and click Boost 🚀

XTZ Secondary Trend. Channel. Wedge. Capitulation Zone. 07 05 20Logarithm. Time frame 1 week (less is not necessary).
The secondary trend has formed a horizontal channel for several years, with repeating wedge-shaped formations, the third time we entered under the support of this channel not by squeezes to collect long stop-loss, but by full candles and the structure of a descending wedge. It looks more vertical. The corrective movement to this semi-vertical wedge, quite possibly, will similarly have an aggressive character. The wedge is almost in the final phase of its formation. I showed percentages for clarity to the key reversal zones, for orientation for your money management and setting the first medium-term, and possibly local targets.
The main trend of this previously hyped cryptocurrency since 2017
XTZ/USD Main Trend. Descending Channel 01 2023

EURNZDPrices broke out of H4 support zone, made a retest and gave an engulfing candle. On the H1 it formed a bearish pennant and also broke out. Alot of bearish movements going on. Looking at 1.88000 as 1st target. Lets see what price does next.

ETH Comeback ? Get the Champagne Ready ...Hello Traders 🐺
Hope you're all doing well.
Let me be honest with you — when I first looked at this chart, I thought:
“This could be the reversal we've been waiting for over the past two years!” 🔥
So please, take this setup seriously. If you manage it wisely, it could offer a highly profitable opportunity 👀📈
⚙️ What’s happening?
On the chart, we clearly see a bullish divergence on the RSI — and that’s always the first signal worth paying attention to.
These divergences usually indicate that bearish pressure is fading, and it's time for the bulls to take over 🐂
But that's not all…
This potential reversal is forming right above one of the most significant historical support zones on the ETH/BTC chart — a massive confluence.
And as you know:
"The higher the time frame, the more meaningful the level."
chart :
🎯 Price Targets:
On the 4H chart, after a clean bear trap, ETH/BTC started to bounce back and is now testing the neckline resistance at 0.01930.
If we see a breakout here, the next price targets are:
Previous local high at 0.02028
And a short-term target around the red resistance box near 0.02137
This setup could mark the beginning of a new Altseason — or at least a strong ETH-led rally.
So act accordingly, manage risk, and as always:
🐺 Discipline is rarely enjoyable, but almost always profitable. 🐺
🐺 KIU_COIN 🐺

Sklz bull pendant!?5.60 by weds could be Monday if proper momentum
Let's go paradise and skillz holdinglong been here since 2020 and I. Not FKN leaving sklz to moon weekly chart Goals 156usd per share
Where my longs at! Not financial advice

Bitcoin may rebound from seller zone and start to declineHello traders, I want share with you my opinion about Bitcoin. In the past, the price had been consolidating within a broad range, repeatedly rejecting support and resistance zones. The buyer zone between 79100 - 80300 provided a strong base, and from there, BTC began to grow, forming a bullish structure that led into an upward wedge. This growth accelerated once the price broke through the support area and continued upward until it approached the resistance level at 95500, which also overlaps with the seller zone. As the price moved inside the wedge, the bullish impulses weakened. Buyers lost strength near the resistance line of the wedge, and recent price action suggests that sellers are stepping in at the top. We’ve now seen multiple failed attempts to break higher, and the price is consolidating under resistance, forming pressure to the downside. This entire consolidation near the wedge resistance, especially inside a confirmed seller zone, indicates a likely reversal. The current structure shows signs of exhaustion, and if the support line of the wedge breaks, that would trigger a significant correction. Given this context, I expect BTC can make a bearish move toward TP1 at 91500 points. Please share this idea with your friends and click Boost 🚀

XAUUSD Technical Analysis: Bullish and Bearish ScenariosGold (XAUUSD) has exhibited a strong bullish impulse, breaking out of established channel structures. Following a sharp ascent, the price action has entered a consolidation phase near recent highs. This analysis explores potential scenarios based on technical patterns, key levels, and underlying market psychology.
Chart Analysis and Market Psychology
The chart displays a distinct uptrend characterized by ascending channels. Recently, XAUUSD experienced a significant upward thrust, breaking decisively above the shorter-term orange channel. This move reached the projected target derived from this channel's height, near the 3405 level.
Following this peak, price action has formed a tighter consolidation range. This pattern, occurring after a sharp rally and on potentially decreasing volume (as is common in such formations), resembles a bullish continuation pattern, such as a pennant or flag. From a market psychology perspective, this suggests a temporary equilibrium:
Buying Pressure: Bulls who drove the initial breakout may be pausing, absorbing profits taken by earlier entrants, or accumulating new positions in anticipation of further upside. The sharp nature of the preceding rally indicates strong underlying demand and potentially FOMO (Fear Of Missing Out) among participants.
Selling Pressure: Sellers are attempting to cap the rally, potentially taking profits or initiating short positions. However, the observation that dips below 3259 were quickly bought suggests that selling pressure has been relatively weak compared to the buying interest defending this level. This rejection indicates that market participants still perceive value at or above this zone, viewing it as a potential support level following the breakout.
The key level currently in focus appears to be around 3259. The price interaction with this level could be crucial in determining the next directional move.
Bullish Scenario
Conditions: For a bullish continuation, the price would ideally need to hold above the 3259 support level. A decisive breakout above the upper boundary of the current consolidation pattern would serve as confirmation.
Psychology: This outcome would suggest that the consolidation phase was indeed accumulative, with buyers absorbing selling pressure and preparing for the next leg higher. It would reinforce the "impatient bulls" and "weak bears" narrative.
Potential Targets:
A retest of the recent highs near 3405.
The target derived from the breakout of the medium-term turquoise channel, located near 3640.
Given the aggressive nature of the preceding rally, an overshoot towards the higher projection at 3839 might become a possibility if bullish momentum remains exceptionally strong after breaking 3640.
Bearish Scenario
Conditions: A failure to hold the 3259 level, coupled with a break below the lower boundary of the consolidation pattern, could signal a potential reversal or a deeper pullback. This might involve price re-entering the previously broken orange channel.
Psychology: This scenario would suggest that the buying pressure was insufficient to sustain the breakout, potentially indicating a "bull trap" or simply a more significant profit-taking wave overwhelming demand at current levels.
Potential Support Zones:
The upper trendline of the orange channel (acting as support after being resistance).
The primary uptrend line (lower boundary) of the orange channel.
The channel line (upper boundary) of the broader turquoise channel, which could coincide with the orange channel's lower boundary, potentially forming a confluence of support.
Concluding Remarks
XAUUSD is at a potential juncture following a strong bullish breakout. The current consolidation pattern holds the key to the next immediate move. Holding above 3259 and breaking the consolidation high could pave the way for further upside towards targets at 3640 and potentially 3839. Conversely, a failure to maintain support at 3259 might trigger a pullback towards the support levels defined by the underlying channel structures. Traders often watch volume closely during the resolution of such patterns for confirmation.
Disclaimer: This report is for informational and educational purposes only and does not constitute financial advice or a recommendation to buy or sell any asset. Trading involves risk, and decisions should be based on your own research and risk tolerance.

ZK Secondary trend.-82% Wedge. Reversal zones. 01 05 2025Logarithm. Time frame 3 days. Decrease from listing about -82%. For cryptocurrencies of such liquidity and capitalization, this is not the maximum decrease (-90-96%). But sometimes from such values as now (-82-85%), taking into account the news hype during the listing "whales $ 458 million", a reversal and strong pumping can occur under the market as a whole. For example, like another hype project of "hanging noodles" - Flare (distributed to XRP holders). Decrease by -82% and then pumping slightly above the listing price under the next alt season of the cycle + 560%.
This does not necessarily mean that this will happen, this is an example of what happens from such values of decline with such liquidity and hype. In some ways, not only in the structure of the TA formation, but in the hype and disappointment of "investors", the projects are identical.
Main trend , and the previously shown zone, in which the price is now.
ZkSync Main trend. L2 for ETH. $458 million funds 21 02 2025
Main trend now in the moment (full trading history).
There is no need to guess the minimums and maximums. It is important to know these zones and have an acceptable average price, from the position of the trend and its potential. It is regulated by the distributed entry volume (in advance) at potential reversal zones.

Price Takes a Breath Before the Next RunBINANCE:HBARUSDT has been moving in a smooth uptrend, followed by a brief consolidation — forming a classic bullish pennant pattern. This indicates a temporary pause before a potential continuation toward the main target zone at 0.21182 – 0.21855.
A breakout above 0.19195 confirms the validity of the pennant pattern, especially after the price successfully held above the demand zone at 0.18907 – 0.18633. The next key level to watch is the prior high of the pennant (highlighted with a red arrow).
For a solid bullish continuation, ensure the breakout is clean — no fakeouts or re-entries back into the pennant. If a false breakout occurs, it's wise to either trim your position or set a break-even stop to protect your capital.
Note: Manage risk with proper stop loss just below the demand zone.

Euro may drop to 1.1200 points, exiting from pennant patternHello traders, I want share with you my opinion about Euro. Earlier, the price was growing steadily inside an upward pennant, following a strong breakout from the buyer zone. This impulse pushed the market higher toward the current support level at 1.1300, where the price found a temporary stabilization. Afterward, EUR moved into a range phase, trading sideways between local highs and lows. Despite several attempts to break higher, the market repeatedly showed weakness near the upper boundary, resulting in multiple turnarounds. Each bounce up was followed by lower highs, forming the descending resistance line of the pennant, while buyers defended the support area. Currently, the market is squeezed between the resistance and support lines, forming a classic compression pattern. Price action reveals increasing pressure on the support, and recent rebounds are becoming weaker, a clear sign of buyers losing momentum. In my view, the overall market situation has shifted from a strong bullish impulse toward a potential downside correction. So, given the breakdown structure forming and the price testing the lower side of the pennant multiple times, I expect a bearish breakout soon. My current TP1 is the 1.1200 points level. Please share this idea with your friends and click Boost 🚀

XRP Potential Falling Wedge / Bull PennantBINANCE:XRPUSDT is consolidating within a structure that could be interpreted as either a Falling Wedge or a Pennant — both typically bullish in the current context.
Dual Scenario Setup
• Falling Wedge – A classic bullish continuation structure. Breakout target: ~$4.00.*
• Bull Pennant – A high-conviction continuation pattern. Breakout target: ~$5.30.*
* Both targets are measured from the presumed breakout point and are only valid if price breaks out in the near term.
Key Technical Levels
• Resistance: ~$2.40 – The descending trendline capping price since January.
• Support: ~$1.60 – Confluence of support support trendline + 0.618 Fib retracement of the rally + 1-Year EMA.
• Supply Zone: ~$3.40
• A break below ~$1.60 would invalidate both patterns and shift bias to bearish.
Volume Note: Gradual decline during consolidation supports both wedge and pennant interpretations. A spike in volume post-breakout would confirm strength.
Until a confirmed breakout above ~$2.40 resistance, this remains in a No-Trade Zone for me — but one worth watching closely.

BTC BULLPOSTPure bullposting - could go either way but if we break the bull pennant then 1.618 fib is MOON

Bullish Pennant in ARDR: A Pause Before Another RallyAfter an aggressive surge marked by a big green candle, BINANCE:ARDRUSDT is now moving sideways. This sideways action represents a "voting phase" between buyers and sellers — a battle to decide who will take control next.
Looking at the current price structure, this consolidation is setting up a potential continuation move toward the next target zone at 0.15199 – 0.15900.
Technically, the sideways movement is forming a bullish pennant pattern — a classic sign where price briefly pauses after a strong rally, gathering momentum before continuing its upward trend.
One thing to watch: after breaking the previous high (marked by the red arrow), price should not fall back into the pennant structure. A re-entry would weaken the bullish setup.
As long as price holds above the key support at 0.12273, the bullish scenario remains intact.
What's your view on this setup?

Two Bullish Scenarios to Watch on ETHUSDTThis week, BINANCE:ETHUSDT has shown a significant upward movement, and there's a good chance it could continue its bullish momentum.
There are two bullish scenarios developing on BINANCE:ETHUSDT :
1. After a pullback, we could see an impulsive move that breaks the previous high (marked with the red arrow) and pushes the price towards the first target at 1,911 – 1,957.
2. The price could move sideways for a while, forming a bullish pennant pattern. In this case, a correction towards 1,756 – 1,731 might occur before the price resumes its move to the first target at 1,911 – 1,957.
Both scenarios remain valid as long as the price holds above 1,722.
If the second scenario plays out, the pullback to 1,756 – 1,731 can be considered a good buy zone (for those who are not in position yet).
Remember: wait for a confirmation candle before entering and place your stop-loss just below the confirmation candle.

EUR/USD – Symmetrical Triangle Breakout Imminent
EUR/USD is currently consolidating within a symmetrical triangle, indicating potential for a strong breakout. Price action has tightened, and a decisive move is expected soon.
• Bullish Scenario: A breakout above the triangle resistance could trigger a move toward the key resistance zone at 1.15183.
• Bearish Scenario: A breakdown below the triangle support may lead to a decline toward the green demand zone between 1.12500–1.13000.
Key Levels:
• Resistance: 1.15183
• Support: 1.12500–1.13000 (Demand Zone)
• Deeper Support: 1.11321
Upcoming economic events (EUR and USD news) may increase volatility — wait for confirmation before entering trades. Watch for volume spikes and strong candlestick patterns to confirm the breakout direction.
Trade Idea:
• Buy on bullish breakout retest
• Sell on bearish breakdown retest
Disclaimer: This is not financial advice. Always manage risk accordingly.

1INCH USDT Bull Pennant, BULLISHBINANCE:1INCHUSDT
1INCH USDT Bull Pennant, BULLISH
TARGETS are fib levels as shown in the chart

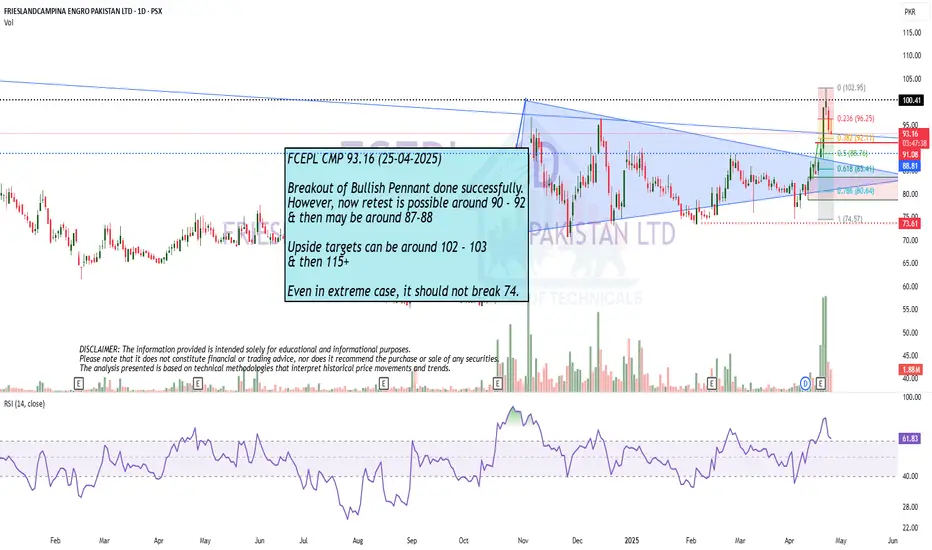
Breakout of Bullish Pennant done successfully.
Breakout of Bullish Pennant done successfully.
However, now retest is possible around 90 - 92
& then may be around 87-88
Upside targets can be around 102 - 103
& then 115+
Even in extreme case, it should not break 74.
Total 3, do flags point to the target area?Welcome back dearest reader,
Today i have a very interesting analysis for you, quite some valuable time was put into this.
What i've noticed is the following:
-From april 2021 untill july 2021 total 3 has been trading in a bullish wedge flag, when we continue the lines on the full candle bodies the apex pointed to the top of that flag durationwise
-August 2022 till october 2023, extend the trendlines, apex march 2024, look up. Oh.
-March 2024, october 2024 --> apex december 2024, look up. Oh.
Now:
-January 2025, april/may 2025, apex june 2025, look up. Oh.
-I used the fractal from july 2021 as i think we're in this period
-Upward sloping channel from october 2022 untill now could provide insights as to what the target price might be, HH and HL
Target: 1.5T
Also check out my BTC.D idea, these would coincide perfectly
~Rustle
Is it certain this will happen? No-one has a glass ball, all we have are patterns based on past performance, this is no guarantee. But it does look good.
