HBAR Falling Wedge / Bull Pennant + RSI breakout (1D)BINANCE:HBARUSDT has spent months correcting after a strong rally and is now compressing within a falling wedge — which could also be interpreted as a bull pennant.
Two Potential Scenarios
• Falling Wedge – A classic reversal setup with bullish RSI divergence and declining volume. Measured target: ~$0.335.*
• Bull Pennant – A continuation pattern formed after the late-2024 impulse. Measured target: ~$0.525.*
Early Bullish Signs
• Declining volume as the pattern developed could signal waning seller strength.
• RSI breaking out of a multi-month downtrend, and retesting the resistance as support, can be a leading signal of a subsequent price breakout.
Key Levels
• $0.050 – Multi-year demand zone.
• $0.120 – Current support + HVN* + previous S/R + 0.786 Fib.
• $0.180 – Resistance + HVN + previous S/R + 0.618 Fib.
• $0.280 – HVN + prior swing high + likely resistance.
• $0.320–$0.460 – Monthly supply zone (in place since March 2021).
• $0.335 – Falling wedge measured target (depending on breakout timing)**.
• $0.360–$0.400 – Daily sell-side order block, expect resistance.
• $0.525 – Bull pennant target (depending on breakout timing)**.
* Wedge and pennant targets are measured from the breakout point, so the actual target will vary the longer we spend within the pattern.
** HVN: High Volume Node — zones of concentrated past trading activity, reinforcing S/R relevance.
⚠️ Until a clean breakout occurs, CRYPTOCAP:HBAR remains in a compression phase and a No-Trade Zone.
Pennant

Bullish Pennant Confirms Breakout: Momentum Builds Toward 1.19The pair has formed a textbook bullish pennant on the 4-hour timeframe following a sharp impulsive move upward. Price action consolidated within a narrowing triangle, signaling accumulation before the next leg higher.
The breakout above the pennant’s resistance suggests continuation of the uptrend, with projected Fibonacci targets at:
1.1781 (1.272 extension)
1.1940 (1.414 extension)
Volume behavior confirms the pattern: declining during the consolidation phase and increasing at the breakout, supporting a strong bullish bias.
Fundamental backdrop:
-The US Dollar faces pressure as markets increasingly price in a potential Fed rate cut in the second half of 2025.
-The ECB maintains a more hawkish stance, reinforcing euro strength relative to USD.
-Eurozone economic data shows signs of inflation stabilization, while US CPI readings remain mixed.
-Capital rotation favors major currencies with resilient monetary policies and macroeconomic stability.
As long as EUR/USD holds above 1.1476, the bullish scenario remains intact. A move toward 1.1781 and 1.1940 appears likely. A breakdown below 1.1237 would invalidate the pennant and shift momentum toward support retests.

Bitcoin may exit from pennant and fall to support levelHello traders, I want share with you my opinion about Bitcoin. Over the past weeks, the price traded inside a broad horizontal range, repeatedly testing the boundaries of the seller zone and the buyer zone. After several failed breakouts, the price sharply dropped from the upper range and entered a phase of lower highs, forming a downward pennant structure. Inside this pennant, the market continued consolidating under pressure from the resistance area. Each attempt to break above the resistance line was met with rejection, confirming strong selling interest near the current resistance level at 88500. At the moment, BTC is testing the upper boundary of the pennant again. This area aligns closely with the resistance level and the long-term descending trendline. Given this confluence and historical rejection zones, I expect BTC to face resistance and reverse, initiating a decline back toward the 79000 support level, thereby exiting from the pennant, which is my current TP1. The compressed price structure, repeated rejections, and clean pattern formation support this bearish outlook in the short term. Please share this idea with your friends and click Boost 🚀

Bullish Pennant on EUR/USD @ D1A bullish pennant has formed on the daily chart of EUR/USD. It can be used for an upside breakout setup. The pennant and its pole are shown with the yellow lines. My potential stop-loss level is marked with the red line (1.12662), it is placed at the low of the pennant area. My potential take-profit level is marked with the green line (1.17921), it is placed at the pole's length above the stop-loss. I will wait for a significant close above the pennant's border to consider trading this breakout.

Bitcoin Bull Pennant / Falling Wedge BreakoutBINANCE:BTCUSDT recently broke out of a Bull Pennant / Falling Wedge, and seems to be retesting the resistance as support.
This follows two leading RSI signals:
• RSI downtrend breakout
• RSI bull divergence
Breakout Targets
• $115K — Falling Wedge measured move
• $130K — Pennant projection
Key Levels to Watch
• $72K — Main support + invalidation (former resistance + 0.618 Fib from 49K–109K)
• $91.5K — Prior support, now a key resistance to reclaim
• $109.5K — All-Time High

GOLD ( XAU/USD) likely to move up from here Take this with a grain of salt. I am no expert, and this is not financial advice.
Technical Analysis (TA):
As we look at the hourly (1hr) timeframe, we can see a strong upward movement followed by a temporary consolidation creating a bullish pennant pattern suggesting a trend continuation. A conservative target puts us at around $3,350 per troy ounce of gold, but we could go as high as $3,494.63 to be exact.
Fundamentals Analysis (FA):
Macroeconomic Uncertainty: I can go into great detail about what is happening, but I would be writing an essay the size of 10 pages, and I don't want to do that now, so here is a quick and simple overview:
Tarrif War between the United States of America and China (as well as other countries) could lead to economic slow downs as well as poor revenue's for companies.
Start-ups are dead. As of today, there has been an alarming rate of start-ups which has been failing and unable to secure funding, and yes I am aware start ups fail all the time and funding dries up, just at the current rate it is scary how many are actively failing where a year back they were alive and well with bright futures and investment potential, investors are running to safe havens such as GOLD to keep their funds safe.
Central banks are expected to pause or even cut rates, which is typically bullish for gold, as lower rates reduce the opportunity cost of holding non-yielding assets.
Geopolitical Tensions: War War War :(

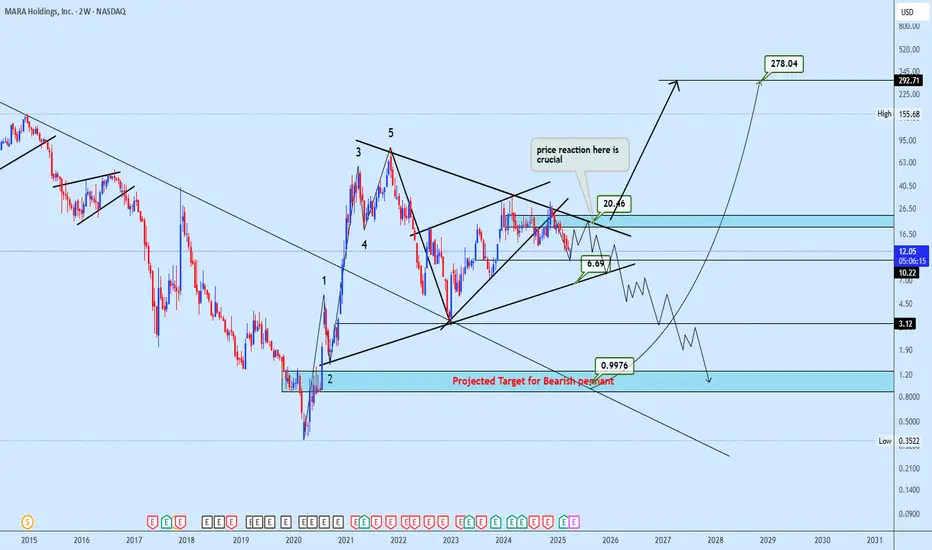
MARA's Defining Moment: Breakdown or Breakout?MARA Holdings has completed a textbook 5-wave macro impulse, followed by a complex correction, now compressing within a bearish pennant just beneath the key 20.46 resistance.
This level marks a crucial pivot, failure to reclaim it may trigger a steep drop toward the 0.9976 zone, while a breakout above could unlock exponential upside toward 155.68 and 281.27.
The coming price reaction will be decisive in shaping the next macro narrative.
XAUUSD Alert: Critical Zones in Play — Trade Smart, Trade Safe!📊 XAUUSD Market Insight 🌍
Gold is heating up once again, currently testing a tight range between 3160 and 3174. A breakout in either direction could set the tone for the next big move.
🔻 If price breaks below, we may see a slide toward 3150 and 3130—potential areas to watch for bearish momentum.
🔺 However, a strong push above 3174 could spark bullish energy, aiming for short-term targets at 3200 and 3227.
💡 Trade Smart
The market is full of opportunity, but don’t forget: risk management is key. Use proper position sizing, set clear stop-losses, and never overexpose your capital. Stay sharp, trade safe, and let the market come to you. 🧠💼

TRX iHVF 12HTRX setting up for a iHVF to 0.1810. 8.5 RRR. Exit pump considering macro environment. Stop loss at assumed second impulse low (high). Target from first impulse draw brought to second impulse low (high), potential for over/under performance.

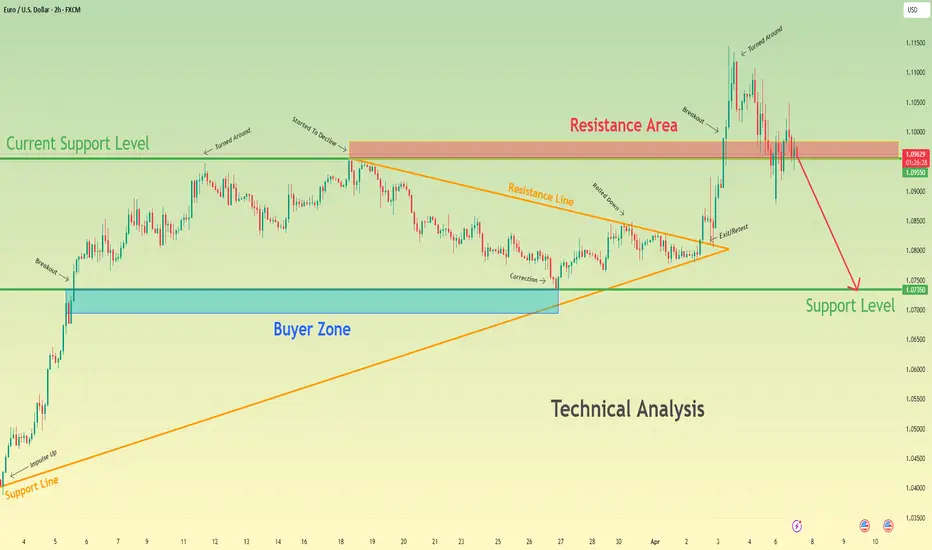
Euro will break current support level and drop to 1.0735 levelHello traders, I want share with you my opinion about Euro. Recently, the price completed a pennant pattern, which resulted in a breakout to the upside. This breakout, however, didn’t gain much ground - the movement quickly lost momentum inside the resistance area between 1.0955 - 1.0985 points, where Euro sharply turned around. The reversal from this zone wasn’t unexpected, considering this level had already acted as resistance earlier. What followed was a clean break below the current support level at 1.0955 points, which shifted the market structure back to bearish. Now the price is trading lower, and the bearish impulse looks set to continue. My expectation is a further decline toward the support level at 1.0735, which also aligns with the buyer zone between 1.0695 - 1.0735 points. This level may act as the next potential area of interest where buyers could attempt a defence. The invalidation of local support, weakness after the breakout, and strong supply reaction from resistance all point to a high probability of continuation down toward TP 1 - 1.0735 level. Please share this idea with your friends and click Boost 🚀
1day chart fallingwedge/bullish pennant on bitcoinI just posted a weekly version of this same pennant in the previous idea which I will link below, i wanted to also post the version of it on the 1day timeframe as well because the top trendline of the wedge on the 1day time frame has a different trajectory which lengthens the wedge considerably. With this longer wedge we can see that if it is the more valid for the 2 versions, that we probably wouldn’t be expecting a breakout until June at the earliest. Not quite sure yet which version of this wedge is ore valid so I’m posting both versions for now to keep and eye on them. For the weekly charts pattern to be the more valid of the 2, we will likely need to see the weekly 50ma continue to maintain support. *not financial advice*

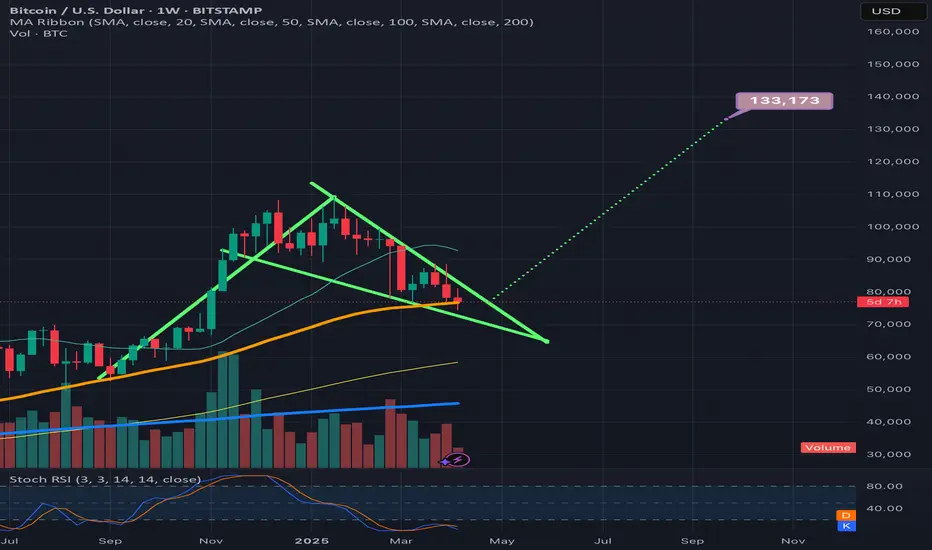
BTCUSD. Weekly bull pennantThe daily failing wedge’s top trendline is not as sharp of a trajectory as the the weekly timeframe’s and due to this, the daily time frames wege is noticeably longer, so I thinkI am going to post a follow p idea to this one that shows the longer version of the wedge, not sure which one is more valid yet at this current time. If the weekly 50ma(in orange) can hold support then we should break up from this wedge right around where I have placed the dotted measured move lne, in which case the breakout target would be around 133k, if the longer version of the wedge on the daily time frame is the more valid of the two then we will likely have to correct longer before we see a breakout. Will post the longer version n the very next idea post. *not financial advice*
XRP just found bounce support on the bttm trendline of the wedgeLooking like a very valid pattern on the weekly hart. My guess is it will break upward somewhere around where I have arbitrarily placed the dottedmeasuredmove line, in which case the breakout target would be somewhere around $4.80 always a chance we retest the bottom trendline and even send a wick below. It before confirming a break upward though. *not financial advice*

TOTAL Bearish PennantThe Parameter known as TOTAL has a currently working bearish pennant formation.
Market is bearish and every green candle on Total means another Short opportuinty.
If Total breaks 2.58T (which is a montly pivot value), we can expect more dumps. 2.36 would be the main target.
When Total reachs 2.36, look for a long wick. If the daily candle close isn't happening, it's a Long opportuinty.

XAU/USD Bullish Pennant Breakout - Trade Setup Toward Target📊 Overview:
This 4-hour chart of Gold Spot (XAU/USD) presents a clean bullish pennant breakout followed by a corrective pullback to key support, offering a high-probability trading setup for bullish continuation traders.
Gold recently surged above the psychological $3,000 level, but after testing the previous resistance zone / ATH, it retraced back into a critical confluence of support. From a technical perspective, the structure remains bullish, supported by strong trendline dynamics, clean price action, and a well-defined pennant formation.
🔍 Step-by-Step Breakdown:
1. Bullish Pennant Formation
A bullish pennant is a continuation pattern that typically occurs after a strong upside rally (the "flagpole"). In this chart:
The flagpole began around March 13, with gold moving vertically from ~$2,630 to ~$2,950.
This was followed by consolidation between March 19–27, forming a symmetrical triangle pattern with converging trendlines (the pennant body).
Volume (if added) would typically decrease during this consolidation phase.
On March 27–28, price broke above the pennant, confirming the bullish bias.
📌 This breakout signals that buyers are ready to resume control after taking a breather.
2. Rally & Retest Phase
Following the breakout:
Price surged to challenge the resistance zone and all-time high (ATH) area, marked between $3,150 – $3,160.
A natural pullback occurred due to profit-taking and overbought conditions.
This retracement brought price back into the support zone at ~$3,000, intersecting perfectly with:
The rising trendline from the pennant breakout
A horizontal demand zone (former resistance turned support)
A key psychological level ($3,000)
💡 This zone acted as a confluence area, attracting buyers and creating a strong bounce — visible as a bullish engulfing candle.
3. Support & Resistance Analysis
✅ Support Level:
$2,990 – $3,010
Marked by previous highs before the breakout
Validated by the trendline and price reaction
🚫 Resistance / ATH Level:
$3,150 – $3,160
Historic resistance zone that capped the recent rally
Price must break this level for further continuation toward the target
4. Trendline Dynamics
The dotted trendline acts as a rising support structure.
Trendlines in bullish continuations are crucial as they confirm upward momentum.
As seen on the chart, price respected the trendline during the recent dip and bounced with strong momentum — a bullish signal.
5. Trade Setup & Risk Management
A trade based on this structure should follow strict risk-to-reward discipline.
🛒 Entry Zone:
Ideal re-entry lies between $3,030 – $3,040, after confirming the bounce from support.
❌ Stop Loss:
Below $2,976, which is under the support zone and trendline. If price breaches this level, the pattern is invalidated.
🎯 Target:
Measured move (height of the flagpole) projected from breakout zone gives us a target of around $3,221.
The chart also marks this clearly as the "Target" zone.
📈 Risk-to-Reward Ratio: Approximately 1:3, which is attractive for swing trades.
6. Market Psychology & Trader Sentiment
The bullish pennant represents temporary indecision, but ultimately market confidence remains strong.
The pullback to support reflects healthy profit-taking, not bearish reversal.
The bounce from support shows buy-the-dip mentality, a sign that bulls remain in control.
7. Macro & Fundamental Backdrop
While the chart is technical, it's wise to factor in macro catalysts:
🏦 Federal Reserve policy: If the Fed holds or cuts rates, gold typically rallies due to lower opportunity cost.
📉 Inflation Data: Rising inflation or expectations can push gold higher as a hedge.
🌍 Geopolitical tensions: Conflicts or economic instability drive safe-haven flows into gold.
Staying updated on these events can help validate or hedge your technical outlook.
✅ Conclusion:
This chart presents a technically sound bullish continuation setup backed by:
A breakout from a bullish pennant
A retest and bounce from a confluence support zone
A clearly defined risk (stop loss) and reward (target)
Traders looking for medium-term opportunities in XAU/USD can consider this as a high-probability setup with logical structure and strong momentum potential.
🔔 TradingView Tag Suggestions:
#XAUUSD #Gold #TechnicalAnalysis #BullishPennant #PriceAction #SwingTrade #Forex #TradingSetup #Commodities #GoldBreakout

NFP BIG BULL SETUP BREAKOUT ALERT!🔥 Market Update for Traders! 🔥
Right now, the market is showing BEARISH momentum, and it's looking like we're heading for a dip. We could see the market fall and sweep the area around 3052 👀. Once that happens, expect a *huge* bounce back as the market could be getting ready to **shoot to the moon 🚀🌕!
🛑 KEY BUY LEVEL: 3130 - This is where you want to be ready to go long! 📈
🎯 First Target: Once we hit 3130, eyes on the ATH (All-Time High) for the retest! 🙌 And from there, we're eyeing a target at 3200 🚀🔥.
💥 NFP News Incoming! 💥
After Trump's speech, gold could *fall* around 1000 pips ⬇️, but **NFP could trigger a huge pump 📊💥. Stay sharp and trade with caution.
💡 Risk Management is KEY! Always follow your plan, set stop losses, and protect your capital. Don't let emotions drive your decisions! 📉🔑
Trade smart, stay sharp, and let's get those gains! 💸💥
#BearishMomentum #BullishReversal #RiskManagement #GoldPrice #NFPAlert

Euro will rise a little more and then make correction to 1.0950Hello traders, I want share with you my opinion about Euro. Earlier, the price started to grow from the lower region near 1.0730, where it bounced off the buyer zone between 1.0690–1.0730 points and entered a strong upward movement. This impulse helped Euro break through previous resistances and approach the upper boundary of the support area, which lies between 1.0950–1.0990 points. After reaching a local high, the price formed a pennant pattern, consolidating within narrowing trend lines while respecting both the support and resistance structure. During this phase, the pair remained stable, building pressure before making the next move. Recently, EUR made a strong breakout to the upside, exiting the pennant and continuing its bullish rally. The price surged rapidly and now trades above the current support level at 1.0950, reaching fresh highs in this local trend. I expect the price to reverse soon from the current overbought region and begin a decline toward the support area, which now acts as a potential pullback zone. My target for this corrective movement is the 1.0950 level, which aligns perfectly with the current support level and the upper boundary of the support zone. Please share this idea with your friends and click Boost 🚀

Gold (XAU/USD) Bullish Breakout: Next Target $3,181?"Key Observations:
Current Price: Gold is trading at $3,127.450 at the time of the chart.
Trend: The chart exhibits a strong uptrend, with higher highs and higher lows.
Support Levels: Several support levels are marked in the $3,010 - $2,999 range, extending down to around $2,906.
Resistance and Target:
The immediate price range is highlighted, suggesting possible consolidation.
A breakout above this range could lead to a target around $3,181.
Chart Annotations:
A retracement (red structure) indicates a short-term correction before continuation.
A breakout structure (black lines) suggests a previous significant upward movement.
The range and possible continuation are marked, indicating that the price may consolidate before attempting to reach the target.
Trading Perspective:
If price holds above the range, we may see bullish continuation towards $3,181.
A break below support levels could signal a deeper pullback towards $3,010 or lower.
This chart suggests a bullish outlook, with potential for more upside if momentum continues. Traders might look for confirmations before entering long positions.

Gold Spot (XAU/USD) Analysis: Bullish Pennant Breakout to Target1. Overview of the Chart
This 4-hour chart of Gold Spot (XAU/USD) presents a bullish pennant pattern, which is a strong continuation formation, indicating that the price is likely to continue its upward trajectory. The price action has followed a clear trend structure, and we can identify key support and resistance levels, breakout points, and potential profit targets.
This analysis provides a comprehensive breakdown of the chart setup, including:
The technical pattern formation
Key support and resistance zones
Trade setup with an ideal entry, stop loss, and profit target
Risk management considerations
Market conditions and external factors to monitor
2. Breakdown of the Chart Pattern: Bullish Pennant Formation
Understanding the Bullish Pennant Pattern
A bullish pennant is a continuation pattern that occurs after a strong upward movement (known as the "flagpole"). The market then consolidates within a small triangular shape, forming the pennant. This consolidation is seen as a temporary pause before the next bullish move.
Key Characteristics of the Pennant in this Chart
Flagpole Formation:
The steep rally before the pennant formed represents a strong bullish impulse, driven by increased buying pressure.
This rapid price increase set the foundation for the pennant pattern.
Consolidation (Pennant Formation):
Price action moved within converging trendlines, forming a symmetrical triangular pattern.
The market temporarily paused, as some traders took profits while others awaited further momentum.
This type of consolidation is common before the price resumes its trend.
Breakout from the Pennant:
The bullish breakout above the upper trendline of the pennant confirms the continuation of the uptrend.
A strong breakout suggests renewed buying interest, likely pushing prices toward the next resistance level.
3. Key Technical Levels on the Chart
A. Resistance Level (Potential Selling Zone)
A critical resistance zone is marked between $3,100 - $3,125, where selling pressure could emerge.
If the price faces rejection in this zone, a temporary retracement could occur before another push higher.
A breakout above this resistance level would further strengthen the bullish case, possibly pushing gold toward the $3,175 - $3,200 range.
B. Support Level (Demand Zone)
The support zone is around $3,025 - $3,017, which is the last significant swing low.
This level represents a strong buying area where traders may look for re-entry on a pullback.
A break below this support could invalidate the bullish setup, signaling a shift in market sentiment.
C. Trendline Support (Dynamic Support)
The dashed black trendline represents an uptrend support.
If price retraces toward this level and holds, it may offer another buying opportunity before resuming its uptrend.
A break below this trendline would be a warning signal, suggesting a weakening of bullish momentum.
4. Trade Setup and Execution Strategy
A. Entry Strategy
The ideal entry point was upon the confirmed breakout above the pennant, around $3,075 - $3,085.
Aggressive traders may have entered at the breakout itself.
Conservative traders may wait for a pullback to retest the breakout zone before entering, ensuring confirmation.
B. Stop Loss Placement (Risk Management)
A stop loss is placed below the support zone at $3,017 to minimize downside risk.
This placement protects against false breakouts or unexpected market reversals.
Keeping a tight stop loss allows for a higher risk-to-reward ratio while maintaining a disciplined approach.
C. Profit Target Projection (Expected Price Movement)
The target price is determined using the measured move approach, where the height of the flagpole is added to the breakout point.
The expected profit target is in the range of $3,175 - $3,200, offering a potential upside of 4.29% from the breakout level.
If price maintains its bullish momentum, further gains could be expected beyond the target zone.
5. Risk Management & Considerations
A. Risk-to-Reward Ratio (RRR)
This trade setup provides a favorable risk-to-reward ratio (RRR).
With an entry near $3,085, a stop loss at $3,017, and a target around $3,175, the trade offers a reward-to-risk ratio of approximately 3:1.
This ensures that even if the trade does not succeed, the risk is controlled while allowing significant upside potential.
B. Factors That Could Invalidate the Setup
Failure to sustain the breakout: If price falls back below the pennant, the setup may be invalid.
Break below the support zone ($3,017): This would signal a possible trend reversal.
Weak volume on breakout: A lack of volume could indicate a false breakout, leading to price retracement.
C. Alternative Trade Scenarios
Scenario 1: Retest & Continuation:
If price pulls back to retest the breakout zone ($3,075 - $3,085) and holds, traders can look for another buying opportunity.
Scenario 2: False Breakout & Reversal:
If price falls below the support level ($3,017), traders should exit long positions and re-evaluate market conditions.
6. Market Conditions & External Factors to Monitor
A. Gold’s Correlation with USD & Interest Rates
Stronger USD → Downward Pressure on Gold
Weaker USD → Bullish Gold Trend
Interest rate decisions from the U.S. Federal Reserve play a significant role in gold prices.
B. Economic Events & News Impact
Inflation Reports: Higher inflation often supports gold prices.
Geopolitical Tensions: Political instability can lead to increased demand for gold as a safe-haven asset.
Stock Market Movements: A weaker stock market can drive capital into gold.
7. Conclusion: Bullish Outlook with Cautious Optimism
Key Takeaways:
✔ Bullish pennant breakout confirmed – strong continuation signal.
✔ Price is above key support & trendline – maintaining bullish structure.
✔ Clear trade plan with entry, stop loss, and target levels.
Trading Plan Summary:
Entry Stop Loss Target Risk-Reward Ratio
$3,075 - $3,085 $3,017 $3,175 - $3,200 3:1
📌 Final Recommendation:
Maintain a bullish bias as long as price holds above the support zone ($3,017).
Watch for volume confirmation to ensure the breakout is valid.
Adjust stop loss or secure profits if price reaches key resistance levels ($3,100 - $3,125).
If you need further clarification or alternative trade scenarios, let me know! 🚀

B&M European Stock Quote | Chart & Forecast SummaryKey Indicators On Trade Set Up In General
1. Push Set Up
2. Range Set up
3. Break & Retest Set Up
Notes On Session
# B&M European Stock Quote
- Double Formation
* A+ Set Up)) | Completed Survey
* 012345 Wave Set Up | Channel & Retest Area | Subdivision 1
- Triple Formation
* (Downtrend Argument)) | Short Set Up | Subdivision 2
* (TP1) | Subdivision 3
* Daily Time Frame | Trend Settings Condition
- (Hypothesis On Entry Bias)) | Logarithmic Settings
- Position On A 1.5RR
* Stop Loss At 281 GBP
* Entry At 265 GBP
* Take Profit At 238 GBP
* (Downtrend Argument)) & Pattern Confirmation
* Ongoing Entry & (Neutral Area))
Active Sessions On Relevant Range & Elemented Probabilities;
European-Session(Upwards) - East Coast-Session(Downwards) - Asian-Session(Ranging)
Conclusion | Trade Plan Execution & Risk Management On Demand;
Overall Consensus | Sell

Euro can exit from pennant and rebound up from support areaHello traders, I want share with you my opinion about Euro. The price was previously trading inside an upward channel, where it consistently rebounded from the support line and moved toward the resistance line. After a final bounce from the lower boundary, EUR made a strong breakout and exited the channel, triggering a powerful bullish impulse. This move brought the price directly to the current support level at 1.0745, which overlaps with the support area. After reaching the local high, the price turned around and entered a correction phase, forming an upward pennant pattern. Inside this structure, we can see how EUR respected both the resistance line and the rising support line of the pennant. Recently, the price rebounded from the support line again, showing signs of strength near the support area, and is now consolidating at the edge of the pennant. This setup often signals an upcoming breakout. I expect the price to break above the resistance line of the pennant and continue its bullish move toward TP1, which is set at 1.0950 points. Please share this idea with your friends and click Boost 🚀

Euro can drop to 1.0650 points, breaking support levelHello traders, I want share with you my opinion about Euro. Earlier, the price was moving inside a range, bouncing between the boundaries and forming a buyer zone near the lower support area. After several rebounds, EUR started to grow and eventually broke out from the range, making a strong upward impulse. The growth continued with a breakout through the support level, which later turned into a support area. From there, the price continued its bullish trend, but after touching the resistance line, it turned around and entered a correction phase. Over the last few sessions, Euro has been forming a pennant pattern, trading between the resistance line and the support line. Now the price is consolidating near the apex of the pennant, showing weak momentum. I expect a false breakout to the upside, followed by a sharp decline from the resistance line. In this scenario, the price would likely break through the current support area and move toward the 1.0650 points - this is my TP1. Given the recent price structure, the correction phase, and the weakening bullish pressure, I remain bearish and anticipate further decline. Please share this idea with your friends and click Boost 🚀

EURAUD bullish pennant may be developing! Intraday Update: Despite the weaker Australian CPI overnight the EURAUD slipped below 1.7085 which may allow for a move to the 1.7020 level, which is the 38% retracement. A bullish pennant may be developing.
