Creator of Shiba Inu Launches ShiroThe creator of Shiba Inu is back with Shiro, a new memecoin that's already sparking interest in the crypto community. But is it worth your attention?
Here’s what we know so far:
The project comes from the same team behind Shiba Inu, which adds credibility given their track record.
The official website features thematic episodes exploring recent events in the crypto world, giving the project a unique narrative spin.
There’s speculation that Shiro’s market cap could reach $4-5 billion in the near term, with a potential climb to $10 billion if momentum builds.
Potential or risk?
Shiro has all the hallmarks of a memecoin: the promise of big returns (some are talking about up to 2000% this cycle) but also the inherent risks associated with speculative assets. It could be appealing if you're open to taking a calculated gamble on something new. As always, remember: Do Your Own Research (DYOR) and invest only what you can afford to lose.
The Bottom Line:
For those interested in exploring memecoins, Shiro looks intriguing. You can find it on CoinMarketCap, so check out the official site to learn more and decide if it fits your strategy.
Happy trading and wishing you a great year-end! BINANCE:BTCUSDT COINBASE:ETHUSD BINANCE:SHIBUSDT BINANCE:UNIUSDT
Pepe

Two Bullish Patterns Hint at Major Rally for PEPE !!!In the 4-hour time frame, as you can see, there are two bullish patterns. The first one is a triangle, and the second one is a H&S . If either of these patterns breaks, the price of PEPE can reach around 000026 .
Previous Analysis
Give me some energy !!
✨We spend hours finding potential opportunities and writing useful ideas, we would be happy if you support us.
Best regards CobraVanguard.💚
_ _ _ _ __ _ _ _ _ _ _ _ _ _ _ _ _ _ _ _ _ _ _ _ _ _ _ _ _ _ _ _
✅Thank you, and for more ideas, hit ❤️Like❤️ and 🌟Follow🌟!
⚠️Things can change...
The markets are always changing and even with all these signals, the market changes tend to be strong and fast!!

PEPE Analysis - What Shall we Expect !!!BINANCE:PEPEUSDT
PEPE continues to consolidate within a bullish symmetrical triangle pattern.
The ongoing consolidation maintains a bullish outlook for CRYPTOCAP:PEPE in the near term👀
✨Traders, if you liked this idea or have your opinion on it, write in the comments, We will be glad.
_ _ _ _ __ _ _ _ _ _ _ _ _ _ _ _ _ _ _ _ _ _ _ _ _ _ _ _ _ _ _ _
✅Thank you, and for more ideas, hit ❤️Like❤️ and 🌟Follow🌟!
⚠️Things can change...
The markets are always changing and even with all these signals, the market changes tend to be strong and fast!!

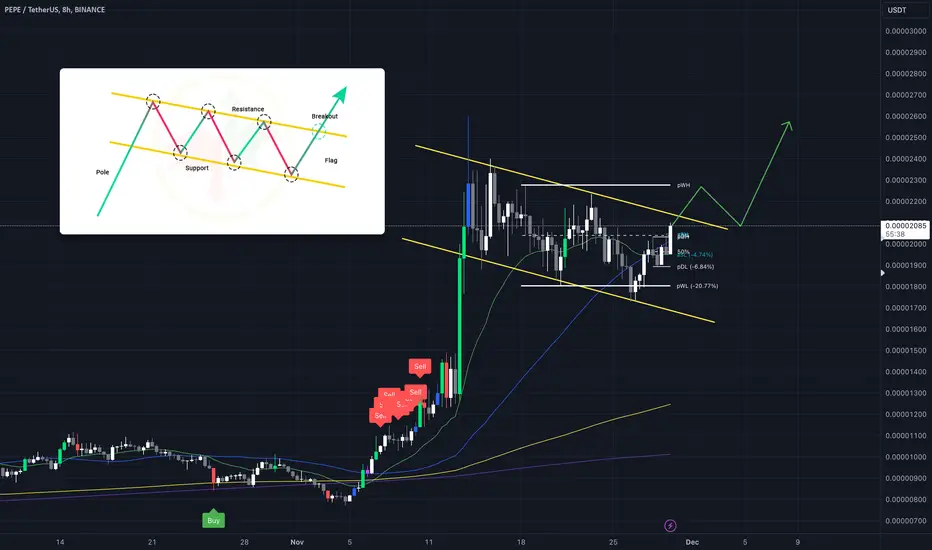
PEPE - Nice Bull FlagPEPEUSDT has formed a nice BULL flag.
If you are not in the trade yet wait for the breakout and retest.
!!! REMINDER !!!
Always pay attention to the signals when you're in a profitable trade. Secure your gains and consider re-entering on the next pullback.
Be Patient - Don't Panic - Trade Emotionless
pepe buy!!!Hello friends, if the red line is fixed above, it can move until the specified targets.
Don't forget capital management.
good luck

Pepe: Long idea, potential 70%+ gainsPEPE presents a compelling long opportunity with the potential for substantial gains of 70% or more. It has recently shown strong recovery signs, indicating the possibility of a bullish continuation.

BTC.D More Down and then BOOM!Bitcoin Dominance is going to play this wedge out, it looks like. Then we can see the real push to 100k++!!

PEPEUSDT Long Tp 93% Sl - 18%PEPE Long Setup
Reason:
Breakout from trend line in HTF as well in LTF.
Took all possible Liquidity from down side.
Fundamentally created good hype, Technically and fundamentally looks super bullish.
All technical indicator suggesting a strong bullish wave up to at least 400% in spot.
Best Regards,
Crypto Panda
BINANCE:PEPEUSDT
BINANCE:1000PEPEUSDT.P
MEXC:PEPEUSDT.P

RIZZMAS... next SHIB!???Five key points explaining why it might be worth considering:
High Token Supply: With 500 billion tokens in circulation, Rizzmas ensures significant market liquidity, making it accessible for trades
Recovery from Historic Lows: While the token has fallen 75% from its all-time high, it has rebounded by 170% from its lowest price, indicating a potential recovery trend
Low Entry Price: With an average price of $0.000046 per token, it offers an affordable entry point, allowing smaller investors to accumulate a significant quantity of tokens
Popularity of Meme Coins: Like Dogecoin and Shiba Inu, Rizzmas is part of the meme coin category. Such coins can exhibit high volatility but often capture significant attention and trading volume during their peaks
Availability Across Platforms: Rizzmas is available on both decentralized exchanges like Raydium and centralized exchanges like Gate.io, providing accessibility for a wide range of traders
For me, it looks like high risk. Use your risk management.
JB.-

PEPE is about to breakout#pepe CRYPTOCAP:PEPE coin has broken the falling channel and retesting. A clear breakout will emerge a new pump session. Not financial advice.

PEPEUSD - Another Move UpPEPEUSD is in the process of its third strong move upwards
I'm not exactly sure of the % increase we will see but its happening.
Moves up are in the white rectangles
Meme coins are very volatile.
Daily chart

PEPE Is Falling, Should You Invest?Lets break down CRYPTO:PEPEUSD on the Daily Chart!
After Robinhood & Coinbase listed CRYPTO:PEPEUSD on their platforms, we see the accumulation of Trading Interest rise which helps push price up, breaking the Highs of May!
Since having created the Higher High @ .000025676, Price has been falling and seems to be creating a familiar Bullish Pattern called a "Falling Wedge", formed by Lower Highs (Falling Resistance) into Lower Lows (Falling Support).
Wedge Patterns are considered Continuation Patterns so given the Uptrend move prior to the formation of the pattern, we can suspect Price to Continue Higher after a Bullish Break of the Falling Resistance!
The Retracement or Pullback to the 50% Fibonacci Level while Price is in the Consolidation State of the Pattern typically suggests the Pullback has ended. The 50% Fibonacci Level or .000016697 sits right in the middle of the Support Zone established by the May Highs.
The Last Low @ .000017309 just missed the May High @ .000017223 and the 50% Fibonacci Level, so with Price still trapped by the Falling Resistance, we could see more Downside for CRYPTO:PEPEUSD before getting the Confirmation of Pattern with the Bullish Break!!
Based off the Extension from the Lower Low @ .000007718 to the Higher High @ 000025676 giving us a .000017958 or 232.68% Increase, we can derive that a .000038 Potential Target with a Valid Bullish Break is possible!
Indicators:
- Price Trading Above 200 EMA
- RSI Above 50
- BBTrend Printing Green Bars
- DSR Aligning with 50% Level

$PNUT Can Make Another 100% EasilySome resistance in light-red needs to clear out, after that, the way is free to test ATH.
What do you think?

$BRETT Can Easily Make 10x Before The End Of The YearChart is quite clear an obvious. $BRETT is in a trending channel that looks like a massive bull flag.
Its consolidating nicely and is going to find a new ATH.
IMO this meme coin will be as big as PEPE or DOGE. It can make an 80x if I am optimistic and a 10x if I am pessimistic.
What do you think?

ETH 1h Brief analyseHi Traders,
There is still unmitigation zone at 1D.
I believe that it seem to be a destination for me where ETH will be heading to.
You see the wave a-b-c at 1h and trend line written at 4h.
Hopefully, this confluence works.
Just remember it can do down further to 0.681 level as good retracement level.
Make sure double check the confirmation then start place the position with stop loss.
3 rules
Buy
Sell
Wait

BITCOIN about to do things!Possible cup and handle breakout coming. Need volume. Neckline is either here or at 97k. We are breaking through the 1hr triangle at this point though. Already have broken the golden area. 103k target if momentum continues. Posting chart just so I can look back at this and see how this plays out.

Building Momentum for a Potential Breakout!The meme coin sensation, PEPE, is showing signs of a powerful technical setup that could lead to significant upside in the near future. With the market sentiment improving and buyers stepping in at critical levels, PEPE is positioned to make a notable move. I will be looking for entries from blue box.
Key Factors to Watch:
🔑 Volume Surge: Keep an eye on a sudden spike in trading volume. This will signal that the bulls are gaining control.
📈 Bullish Price Action: Look for chart patterns like double bottoms, bullish pennants, or even a clean breakout above resistance levels.
🟢 Support Zones Holding: PEPE has shown resilience by bouncing off key support levels, indicating that buyers are defending these areas strongly.
With its strong community backing and improving technicals, PEPE is gearing up for a potential rally. If you're looking for high-risk, high-reward plays, this could be your chance to ride the wave.
👉 Stay tuned for real-time updates and actionable insights as PEPE sets the stage for its next big move!
I don’t clutter my charts with a mess of indicators that look like a toddler went wild with crayons. Clean, simple, and effective—that’s my style. Don’t believe me? Check out my hits below. 🎯
When it comes to trading, I’m all about confidence backed by experience. I’m not claiming to be the best (yet), but my results do most of the talking. Keep an eye on these levels—sometimes the charts quietly suggest what the markets will shout later. Let’s see how this ride unfolds together! 🚀
My Previous Hits
🐶 DOGEUSDT.P | 4 Reward for 1 Risk (or more if you’re bold).
DOGEUSDT.P: Next Move
🎨 RENDERUSDT.P | HTF Sniper Precision
RENDERUSDT.P: Opportunity of the Month
💎 ETHUSDT.P | Buyer Zone So Accurate You’ll Double Check
ETHUSDT.P: Where to Retrace
🟢 BNBUSDT.P | Buyer Zone Mastery (CZ vibes).
BNBUSDT.P: Potential Surge
📊 Bitcoin Dominance | Called it Like a Pro
BTC Dominance: Reaction Zone
Now sit back, relax, and watch the market do its thing. Or don’t, FOMO is real. 😉

PEPE ready to PUMP
PEPE Whale Activity Analysis: Insights from Whale Metrics and CUMULATIVE NET FLOW
Over the last few days, whale activity in PEPE has shown significant changes, as tracked by cumulative net flows and whale count data. Here’s a breakdown of the recent trends and their implications:
Cumulative Net Flow (25th-28th November)
25th November: -10.35 trillion PEPE
Modest outflows suggest minor accumulation or redistribution by whales.
26th November: -10.25 trillion PEPE
Outflows persist but remain within a controlled range.
27th November: -41.3 trillion PEPE
A massive jump in outflows suggests significant accumulation, potentially setting the stage for a bullish move.
Whale Count Changes
Whale count increased by 13 to 14 whales over this period.
This rise in whale count aligns with large-scale accumulation observed in the net flow data.
A growing number of whales often reflects confidence in the asset, as whales prepare for potential price movements.
Implications: Pump or Dump?
Bullish Case (Pump):
Accumulation Dominance:
The increasing negative net flow (cumulative outflows) indicates that whales are actively accumulating PEPE.
The rise in whale count further supports a bullish narrative, as whales typically accumulate before driving prices higher.
Prediction Based on Indicator Logic:
The indicator's Accumulation Signal highlights that this activity is likely to precede a price increase.
Key levels near the last retail liquidation zone could present optimal buying opportunities for retail traders.
Bearish Case (Dump):
No significant distribution signals have been detected, meaning the likelihood of a bearish dump is low for now.
If whale inflows spike and cumulative net flow turns positive, it would signal distribution, potentially leading to a price drop.
Key Observations
Accumulation Activity Surging:
The cumulative net flow dropping to -41.3 trillion on 28th November reflects aggressive accumulation, a strong indicator of bullish intent.
Whale Confidence Increasing:
The rise in whale count to 14 suggests that more significant players are entering the market, likely expecting upward price action.
Retail Liquidations as Entry Zones:
Retail liquidation zones are crucial for identifying levels where whales may push prices before continuing their accumulation or distribution cycles.
Strategy Recommendations
Monitor Accumulation Levels:
Look for buying opportunities near key retail liquidation levels.
Watch for Distribution Signals:
Stay cautious if cumulative net flows shift positive, indicating whales are offloading their holdings.
Conclusion
The significant accumulation activity over the past few days, combined with an increase in whale count, strongly supports a bullish outlook. However, traders should remain vigilant for any sudden shifts in whale behavior or retail liquidation signals to capitalize on market opportunities effectively.
🚀 Prepare for potential upward price momentum, with key support levels near recent retail liquidations!

PEPE - Chart looks cleanPEPE chart looks clean. It has retested and is now looking for a leg up. PEPE/USDT

Pepe Coin (PEPE) Forecast by NEoWaveThe PEPE currency first rose to 0.00000437 and then its price correction began.
The price correction of this currency was in the form of a Reverse Contracting Triangle. Then, a good demand for PEPE was formed and the price of this currency grew by 873% and again we saw the price correction of this currency in the form of Contracting Triangle.
Considering that waves (B) and (D) are similar in terms of time-price and structure and the structure of wave C is not an impulse, it seems that the higher degree pattern is Diametric and wave E of this Diametric has started.
We expect wave (E) to grow at least to 0.00009350 and the correction phase will start again, which can take between 9-21 months. After the formation of wave (F), we will have another upward step.
Good luck
NEoWaveChart
neowavechart.com

PEPE IS GOING TO THE MOON, VERY SOON! TRADE PLAN + TAPrice Action Overview:
Current Price: 0.000018448 USDT (down by 2.54% at the moment of the analysis).
The chart shows significant volatility, with a large spike in price followed by consolidation. This suggests that the asset might be in a retracement phase or forming a new support level.
A sharp upward move was observed, followed by a small downtrend and consolidation, signaling a possible range-bound market at this moment.
Volume Analysis:
Volume has been relatively low compared to the massive spike seen during the upward price movement, indicating decreasing momentum.
The increasing volume during the price rise indicates strong buying interest, while lower volume during the pullback suggests a lack of significant selling pressure.
Indicators:
VMC Cipher B Divergences (Top Indicator):
The VMC Cipher B indicates a mixed picture with bullish and bearish signals. The market appears to be in a neutral stance, with both green and red signals alternating.
The current green signal might suggest a slight upward momentum in the short term, but this needs confirmation with further price movement and volume.
Relative Strength Index (RSI) (Middle Indicator):
RSI is at 36.96, indicating that PEPE is in the neutral to slightly oversold zone. Typically, values below 30 would signal oversold conditions, while values above 70 indicate overbought conditions.
Currently, PEPE is in the lower part of its RSI range, potentially signaling an opportunity for a price rebound if the RSI moves towards 40 or higher.
Money Flow Index (MFI) (Middle Indicator):
The MFI is at 35, which is just below the neutral 50 level. This suggests that there is slightly more selling pressure than buying pressure but not to an extreme level.
A higher MFI would be indicative of more buying interest and a possible upward move.
Stochastic Oscillator (Bottom Indicator):
The Stochastic Oscillator is showing overbought conditions, with values nearing the 80 level. This suggests that PEPE could be nearing a short-term correction or consolidation phase.
Watch for a potential crossover or downward move to indicate a price correction or continuation of a downtrend.
Trend Analysis:
The current trend is uncertain, but recent price action suggests that PEPE might be in a correction phase after a large upward movement.
If the price remains above the support levels indicated on the chart, there could be a reversal or continuation upwards.
Key Levels to Watch:
Support Level: 0.000018000 USDT (around the current price).
Resistance Level: 0.000020000 USDT.
If PEPE fails to hold above the support level, it could test lower levels, potentially around 0.000015000 USDT.
Trading Plan for PEPE/USDT:
Entry Points:
Consider buying at or near the 0.000018000 USDT level if it holds as support. This could provide a low-risk entry with a potential for a reversal or consolidation before any upward breakout.
If PEPE breaks above the 0.000020000 USDT resistance level, look for confirmation of an upward trend and potentially enter a long position.
Stop Loss:
Set a stop loss around 0.000017000 USDT to manage risk in case the support level fails.
For more conservative risk management, consider placing the stop loss just below the next major support at 0.000016500 USDT.
Take Profit:
First Target: 0.000022000 USDT, just above the previous highs, which would indicate a breakout.
Second Target: 0.000024000 USDT, should momentum continue and if buying interest picks up.
Additional Strategy:
Monitor the RSI and Stochastic Oscillator: If the RSI begins to rise above 40 and the Stochastic Oscillator shows signs of reversal from the overbought region, these could be additional signals to add to a position or exit partially.
Volume Watch:
If the volume starts to increase again in line with upward price movement, this could confirm the strength of the trend and provide a safer entry for a long position.
In summary, PEPE is showing a mix of signals at the moment with potential for both upward and downward movements. It's crucial to monitor the support and resistance levels and the indicators to confirm the direction of the trend.


MEMEFI ... next x10-100 upcoming! 5 reasons to buy MEMEFI right now...
Fundamental Analysis:
Innovative Concept: MemeFi combines meme culture with decentralized finance (DeFi) on the Sui blockchain, offering a unique and engaging gaming experience.
Community Focus:
The game emphasizes social interaction and community involvement, which can drive user engagement and retention.
Token Economy:
MemeFi has a rich token economy that rewards players for their participation, making it attractive for both gamers and investors.
Strategic Blockchain Choice:
By choosing the Sui blockchain, MemeFi benefits from lower transaction fees and faster processing times, enhancing user experience.
Future Growth Potential:
The project has a solid roadmap for future development, indicating potential for long-term growth and increased value.
Buy by spot and keep your risk management.
JB.-
