PEPEUSDT: Bearish Outlook After Internal Trendline BreakHello guys.
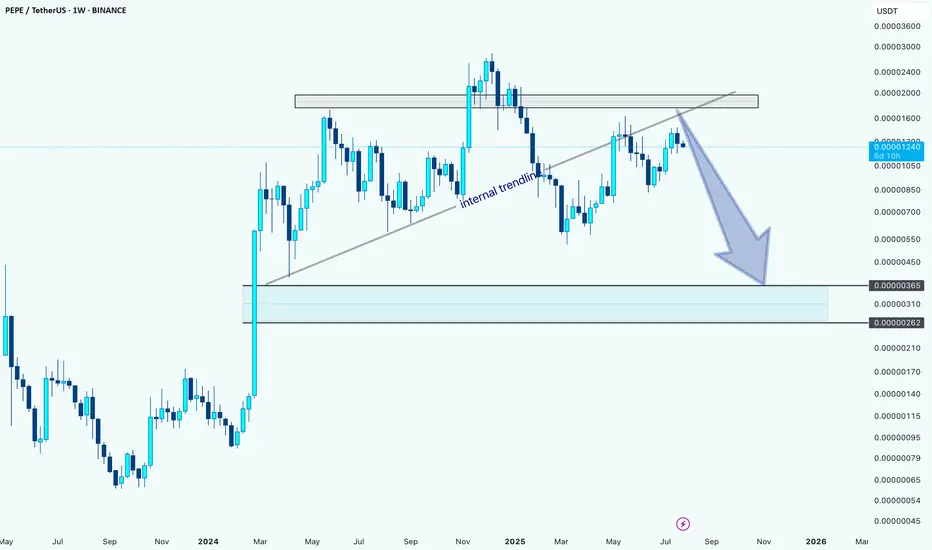
PEPE has tested the internal trendline multiple times and finally broke below it, signaling potential weakness. Price also failed to reclaim the key supply zone above.
Internal trendline broken
Rejection from a key supply zone
Potential move toward the demand zone around 0.00000262–0.00000365
Unless bulls reclaim the broken trendline and break above the recent highs, the bias remains bearish with a possible continuation to the downside.
Pepecoin
PEPE Daily Setup Holding Strong
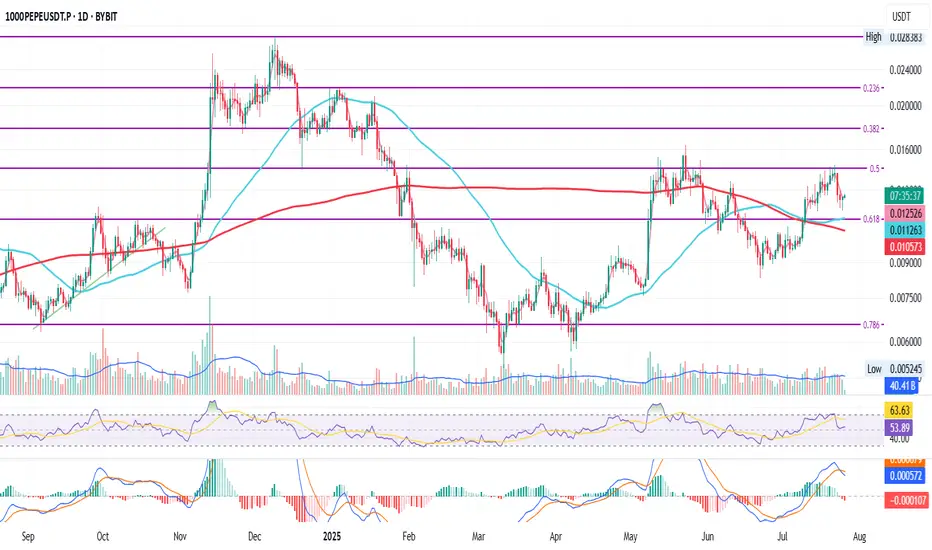
This is PEPE on the daily
Price recently crossed above the 50MA which is currently resting on the 200MA after a golden cross
It was rejected at the 0.5 Fib but is now holding above the 0.618 Fib as well as the 50MA and 200MA
RSI is finding support at the mid level while MACD just turned bearish
Chances are we see a pullback first, a search for support, before the next possible move up
We’ll be here to watch it unfold
Always take profits and manage risk.
Interaction is welcome.
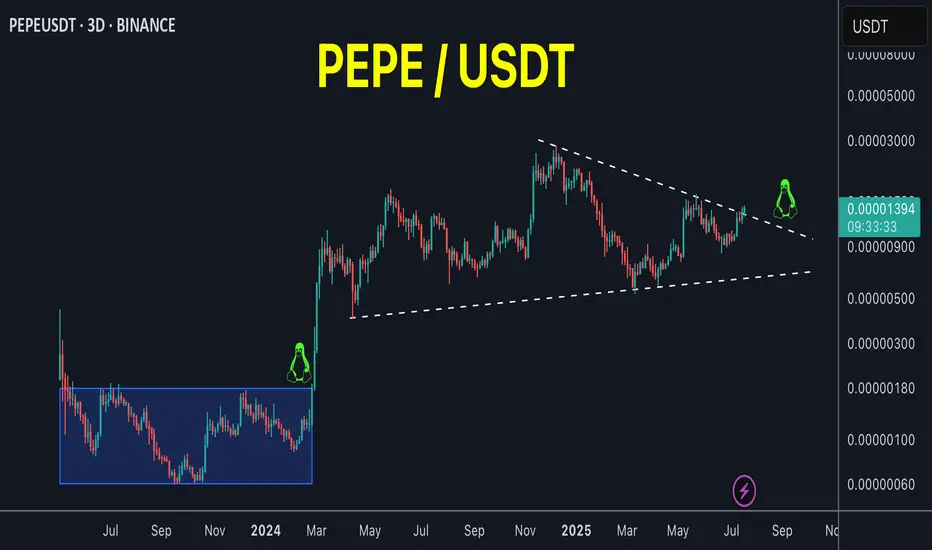
PEPE on the verge of breakout!PEPE / USDT
Price is trying to breakout massive downtrend line since 7 months
Incase of breakout we will see strong bullish momentum
Keep an eye on it
PEPE WILL WE GO TO .000035 ? Evening
so if we can break this orange level here ie this top in price action then a nice run up to .000035 makes send.
stay tuned this is wild one
what do you think Pepe will do ?
Kris/ Mindbloome Exchange

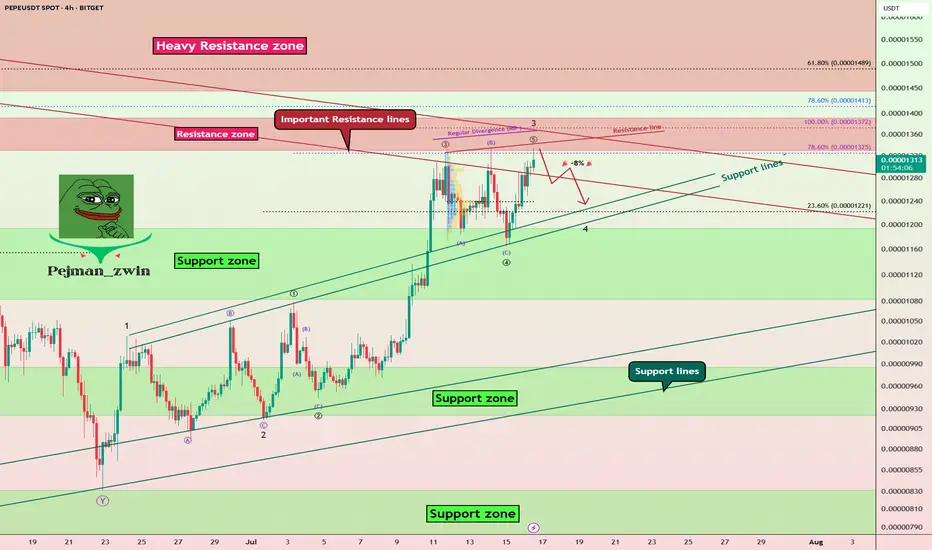
PEPE Faces Key Resistances – Is a -8% Pullback Coming?The PEPE memecoin ( BINANCE:PEPEUSDT ) is currently near the Resistance zone($0.00001392-$0.00001330) and Important Resistance lines . This is the third time that PEPE has attacked the Important Resistance lines .
In terms of Elliott wave theory , it seems that PEPE is completing the microwave 5 of the main wave 3 , so that the main wave 3 is of the extended type .
Also, we can see the Regular Divergence(RD-) between Consecutive Peaks.
I expect a -8% drop for PEPE in the coming hours.
First Target: $0.00001251
Second Target: $0.00001212
Note: Stop Loss(SL)= $0.00001400
Please respect each other's ideas and express them politely if you agree or disagree.
PEPE Analyze (PEPEUSDT), 4-hour time frame.
Be sure to follow the updated ideas.
Do not forget to put a Stop loss for your positions (For every position you want to open).
Please follow your strategy and updates; this is just my Idea, and I will gladly see your ideas in this post.
Please do not forget the ✅' like '✅ button 🙏😊 & Share it with your friends; thanks, and Trade safe.
PEPE Pressing Into Its Macro Downtrend — AgainPEPE is back at the same trendline that’s slapped it down twice before — but this third attempt comes with strength.
We’ve got higher lows, reclaimed support, and a solid grind into resistance.
Still, a macro downtrend is a macro downtrend… until it breaks.
This next move will decide if this is the real deal or just another fakeout.
#PEPE #PEPEUSDT #MemeCoinCharts #CryptoAnalysis #TrendlineTest #BacktestEverything #TradingView #QuantTradingPro #CryptoBreakout

Is Pepe growing? Read the caption, it's important.Hello friends🙌
✔Some factors caused the price to fall, but in a support area that we have drawn for you with several Fibonacci waves, you can see that a classic double bottom pattern has been formed and buyers have entered.
🔊Now there is no more news of a fall and buyers have raised the price to the point where it has created a higher ceiling and floor, and this is very important and signals a change in trend.
📈Now that the price has broken the specified resistance line and is well supported by the specified support line, we can expect the price to move to the specified areas, but do not forget that the most important thing to observe in trading is capital management⚠
🔥Follow us for more signals🔥
*Trade safely with us*

PEPE – Strongest Setup Among Top Meme Coins
Out of the higher-cap meme coins, I’m leaning more toward $PEPEUSDT.
From a price action perspective, it’s showing more strength than CRYPTOCAP:DOGE , CRYPTOCAP:SHIB , and $WIF. That’s not to say the others won’t pump—but personally, CRYPTOCAP:PEPE looks the most appealing here.
The green box is a solid area to build a position. It’s held the trimester lows well and continues to test them while responding bullishly.
Let’s see how it plays out over the next two months—but I like the odds of upside from here.

PEPEUSDT Forming Falling ChannelPEPEUSDT is showing promising signs of a potential breakout, supported by a clear price structure that resembles a falling channel pattern. This technical setup is widely known among traders for indicating a possible trend reversal when the price successfully breaches the channel’s upper resistance line. Coupled with good trading volume, the current market sentiment around PEPE is generating optimism for a potential 60% to 70% gain as buyers step in at these attractive levels.
This crypto pair has caught the attention of both retail and institutional investors due to the growing hype and community-driven momentum behind the PEPE token. Despite its meme origins, PEPE has demonstrated significant staying power in the market, with steady liquidity and regular price swings that attract short-term and swing traders alike. As new investors continue to accumulate positions, the probability of a breakout move increases, reinforcing the bullish outlook.
Technically, the price action indicates that PEPEUSDT may be forming a solid base for an upward surge. The falling channel pattern, if validated with a confirmed breakout and retest, could set the stage for a strong push towards higher levels, aligning perfectly with the projected upside potential. Traders should keep a close eye on the breakout level and volume spikes, as these will serve as key confirmation signals for the next move.
✅ Show your support by hitting the like button and
✅ Leaving a comment below! (What is You opinion about this Coin)
Your feedback and engagement keep me inspired to share more insightful market analysis with you!

PEPEUSD going to moon according to my analysis. {08/june/2025}Educational Analysis says that PEPEUSD may give trend Trading opportunities from this range, according to my technical analysis.
Broker - binance
So, my analysis is based on a top-down approach from weekly to trend range to internal trend range.
So my analysis comprises of two structures: 1) Break of structure on weekly range and 2) Trading Range to fill the remaining fair value gap
Let's see what this pair brings to the table for us in the future.
Please check the comment section to see how this turned out.
DISCLAIMER:-
This is not an entry signal. THIS IS FOR EDUCATIONAL PURPOSES ONLY.
I HAVE NO CONCERNS WITH YOUR PROFIT OR LOSS,
Happy Trading, Fx Dollars.

PEPE Breaks Out After Triple Bottom – Retest Incoming?PEPEUSDT just printed a textbook 3-tap support rejection, followed by a Break of Structure (BOS) through the descending trendline — now bulls are watching for a retest entry opportunity.
--Key Technical Highlights:
🔹 3 Rejections @ Support: Price respected the ~$0.00001000 level multiple times, building a strong base.
🔹 Break of Structure (BOS): Momentum shifted as PEPE broke the local highs and pierced descending resistance.
🔹 Wait for Retest: Ideal entry comes on a pullback to the previous resistance for a clean breakout confirmation.
🔹 Target: $0.00001351 – Based on prior swing highs and fib extension levels.
**A failed retest could invalidate the setup — watch lower support (~$0.00000900) for last line of defense.

Pepe update hello friends✋️
Considering the drop we had, you can see that the price was well supported in the specified area and buyers came in. Now in the return of the price, we can buy step by step in the specified support areas and move with it until the specified goals, of course, with the management of shame and risk...
*Trade safely with us*

pepe updateentry price 0.00001425
stop loss update 0.00001425
take profit
0.00001172
0.00001022
0.0000086
result full target

Weekly Trendline Support Respected – PEPE Holding UpOnce again, CRYPTOCAP:PEPE is bouncing off its trusted rising trendline — a level that’s acted like solid ground for months.
Every time price hits this trendline, buyers show up. That’s a strong sign bulls are still in the game. As long as this line holds, the uptrend stays healthy.
Next challenge? That resistance zone above. If PEPE breaks through, we could see another leg higher. But if it loses the trendline, things might cool off toward the next support.

Most see capitulation. I see clean premium-to-discount deliveryPEPE just swept deep into the 0.786 retracement — right where most fear sets in. But Smart Money? This is where they reaccumulate. The structure isn't broken — it's resetting.
Here’s what the chart tells me:
Price dipped straight into the FVG + 0.786 (0.00000945) zone
That's the deepest discount before structural invalidation — exactly where Smart Money looks for reversal footprints
The upside draw sits cleanly at 0.00001194 (0.5 fib), with an extension possible toward 0.00001297 and even 0.00001424
This move down didn’t violate anything. It rebalanced prior inefficiency and opened the door for premium delivery.
Execution logic:
Accumulate within 0.00000945–0.00000918 (discount zone)
Invalidation: break below 0.00000758 closes the book on this setup
Targets: 0.00001194 → 0.00001297 → 0.00001424
The biggest moves don’t start when it feels safe. They start when it feels late.
For setups like this — built on logic, not luck — check the profile description. I trade where Smart Money trades.

Compression, rejection, and the trap belowPEPE isn’t random here — it’s in a calculated drawdown. Not a dump — a design. What looks like weakness is really compression into a reactive pocket.
The logic:
Price is descending inside a compression channel. But the real interest lies lower — specifically around the FVG and the untouched demand range down to 0.0000089. That’s the key.
The 0.0000103 zone is a surface-level fib level (0.382), but the deeper intention is beneath it — where Smart Money will want to accumulate before running it back into inefficiency.
Above us? There’s a massive void sitting between 0.0000115 and 0.0000126. That’s the draw — but not before a deeper sweep to fuel it.
Two key paths:
Ideal: Full sweep of 0.0000089 demand → strong reversal → drive back into the .5/.618 fib cluster near 0.0000115–0.0000126
If front-run: Hold near current level (0.0000103) and deliver into the FVG gap above
Anything below 0.0000083? That’s your invalidation. Until then, compression is the setup.
Final thought:
“Smart Money doesn’t chase the wick. It sets the trap — then steps in with size.”

PEPE Ready to Rip? 3 Take-Profits Lined Up from This Key SupportPEPEUSD is currently forming a potential bullish reversal near the key support zone between 0.00001060 and 0.00001099. This level has acted as a solid demand zone previously, with price bouncing off this range multiple times in the recent past. The current price action suggests consolidation above this level, hinting at potential accumulation by buyers.
We can observe a compression in volatility, with recent candles showing smaller bodies and longer wicks near support—classic signs of weakening bearish momentum. The prior price rejection from the 0.00001318 zone and the smooth retracement to support further confirm this as a healthy correction rather than a trend breakdown.
The DPO (Detrended Price Oscillator) is hovering close to zero, suggesting the asset is entering a potential pivot zone. A move into positive territory would support the bullish scenario, ideally confirmed by an increase in volume on the breakout above short-term resistance.
This setup is particularly attractive for scalpers or short-term traders, aiming to capture quick momentum surges across multiple resistance levels.
📌 Trade Setup
• Entry Zone: 0.00001167–0.00001177
• Stop-Loss (SL1): 0.00001060
• Take-Profit 1 (TP1): 0.00001318
• Take-Profit 2 (TP2): 0.00001443
• Take-Profit 3 (TP3): 0.00001603
Strategy Note: The risk-to-reward ratio is highly favorable, particularly for TP2 and TP3. The setup allows for flexible scaling of positions as price hits each resistance level. With no immediate macro threats on the 4H structure and price defending support, this setup offers a clean bullish opportunity.

PEPE at Key Reversal Zone — Support Test Coming Soon?Today I want to look at the PEPE token ( BINANCE:PEPEUSDT ), which is part of the memecoin category, and provide you with a short-term analysis on the 1-hour timeframe .
PEPE token is trading in Potential Reversal Zone(PRZ) .
In terms of Elliott wave theory , the PEPE token appears to be completing the microwave 5 of the main wave C . The structure is a Zigzag Correction(ABC/5-3-5) .
Also, we can see the Regular Divergence(RD-) between Consecutive Peaks .
I expect the PEPE token to attack the Support zone($0.0000120-$0.0000108) after completing the main wave C .
Note: Stop Loss = $0.0000362
Please respect each other's ideas and express them politely if you agree or disagree.
Pepe Analyze (PEPEUSDT), 1-hour time frame.
Be sure to follow the updated ideas.
Do not forget to put a Stop loss for your positions (For every position you want to open).
Please follow your strategy and updates; this is just my Idea, and I will gladly see your ideas in this post.
Please do not forget the ✅' like '✅ button 🙏😊 & Share it with your friends; thanks, and Trade safe.

They saw weakness. I saw PEPE return to the source.Every time price dropped today, people called it a breakdown.
But Smart Money doesn’t break price — they rebalance it.
PEPE just swept the prior low into 0.00001145 — the 0.786 retracement — and bounced. No hesitation. That wick? That was engineered. The goal wasn’t to fall — it was to fill.
Now we sit below the 15m OB at 0.00001167–0.00001175. That’s the gate. If price reclaims and consolidates above this zone, the next draw becomes obvious: 0.00001204 — clean inefficiency, clean liquidity.
If it rejects? Watch for one more final liquidity raid into 0.00001129 before the macro expansion.
Execution breakdown:
🔑 Entry: 0.00001145 (0.786)
🎯 TP 1: 0.00001175 (OB mitigation)
🎯 TP 2: 0.00001204 (full inefficiency reclaim)
❌ Invalidation: sustained close below 0.00001129
The chart didn’t break down.
It paused — to let the untrained exit early.

ABOUT PEPE, BEARISH MOVEMENTS WITHOUT GOVERMENTS ^) Hello dear traders! It's Nika...
Today I want to share with you this trading idea, about purpose.
As this technical analysis shows, our indicator has these yellow-marked circles.
This movement of price may happen so easily... So soon.
There are so many support levels that can be checked.
So, my personal opinion is market is bearish, and we can see downfall of a price decline.
Wishing you a profitable day.
Good Luck!

Don't miss today's signal.Hello friends
Given the good growth we had, the price has corrected and now we can buy in steps in the specified areas with capital and risk management and move with it to the set goals.
*Trade safely with us*

PEPE RIGHT TIME TO BUY PEPE coin is currently gaining momentum as market sentiment turns bullish across meme coins. With increased community engagement, rising trading volume, and attention from crypto influencers, PEPE appears poised for its next leg up. If current support holds and broader market conditions remain favorable, PEPE could break out from its current consolidation and target the next resistance level, potentially setting a new short-term high.

PEPE Technical Analysis – Daily TimeframePEPE Technical Analysis – Daily Timeframe
PEPE is currently forming two strong bullish technical patterns, both suggesting significant upside potential if a key resistance level is broken with confirmation.
📌 Scenario 1 : Bullish Flag Pattern
If the price breaks and holds above the $0.00001500 resistance on the daily timeframe, the bullish flag pattern may become active.
This pattern projects a potential move toward the $0.00003000 level, which aligns with the previous all-time high (ATH).
📈 Estimated upside: +90% from the current price.
📌 Scenario 2 : Cup Formation
In the broader structure, PEPE appears to be forming a cup pattern.
A confirmed breakout above $0.00001500 could open the door to a new all-time high around the $0.00004000 level.
📈 Estimated upside: +170%, assuming full pattern completion.
✅ In both scenarios, a strong breakout above $0.00001500 with volume is the key condition for bullish continuation.
Until then, short-term volatility or consolidation remains possible.
📌 This analysis is for educational and informational purposes only and does not constitute financial advice.
This cryptocurrency has two key support levels.
As long as the price remains above these supports, there is still hope for a potential reversal and continuation of the uptrend.
The first support is at $0.00001200
The second support is at $0.00001050
📝 Follow me for updates and more crypto analyses.
