SasanSeifi 💁♂️PEPE 👉6H🔼 0.000000830 / 0.000000875In the 6-hour timeframe, as you can see, the price has experienced a growth of over 30% from the 0.0000006020 range. Currently, with the possibility of a price rejection from the supply area, we can consider a scenario where, after a correction and retesting, the price may once again move upwards if confirmed. The target for further growth could be the important resistance levels at 0.000000830 / 0.0000008755.
To better understand the continuation of the price movement, we need to observe how the price reacts to the range between 0.0000007340 / 0.0000007560. If the price breaks below the support ranges and establishes itself lower, it may increase the likelihood of a further correction.
🔵Remember, always conduct your own analysis and consider other factors before making any trading decisions. Good luck!"✌️
Pepecoin

Pepe Token formed bullish Gartley for the next pumpHi dear friends, hope you are well and welcome to the new update on Pepe Token with US Dollar pair.
Our last successful trade of PEPE was the below one:
Now on a 4-hr time frame, PEPE has formed a bullish Gartley move for the next pump.
Note: Above idea is for educational purpose only. It is advised to diversify and strictly follow the stop loss, and don't get stuck with trade.

We're on our way to the next floorIf you see my profile you will notice that it predicts Pepe's previous floor quite accurately and now I think I am right again, see how the downward trend has been making a megaphone since July 14, I think that after hitting the floor The trend would be upward and the next tarjet could be the daily ma of 100.

📉PEPE analysis after team conflict📈BINANCE:PEPEUSDT
OKX:PEPEUSDT
Hello Traders, please check out my previous ideas.
If the price stabilizes below the yellow area, the long scenario won't be fulfilled.
Targets are on the chart.
Optimum stop-loss for long position is below the 0.0000008415 level.
After what happened to Pepe's developer team and their conflict, there is a possibility of an upward return in the price trend if the sentiment around this project improves.
If the negative sentiment continues, the price of Pepe can decrease to the lower levels of the pitchfork.
✌💥If you are satisfied with my analytical content, please share my ideas💥✌
✍🐱👤Otherwise, make sure you leave comments and let me know what you think.🐱👤✍
🤑🍾Thank you for your support. I hope you will gain profit by following my analyses.🍾🤑
CrazyS✌

PEPE long positionEntered a long #daytrade position on #PEPE... Let's see how far we get today... SL right under SSL...
#memecoins are always risky to #trade with leverage... So NFA...
#trading FWB:PEPE
@pepecoineth
#pepecoin #PepeCommunity_ #PEPEUSDT

PEPE is getting ready to jump!PEPE is currently playing around in a nice trading rage. It looks like we can expect a nice 'HOP' or 'JUMP' over the course of the next couple of weeks.

PEPE coin is on the short list with a level of 0.00000085Hello everyone!
AIHermes today identified the coin PEPE on the short list with a level of 0.00000085
Entry model - breakout! Leverage 10-20X
Stop short.
Trade with us, trade better than us!
Today:
5 coins on the short list
22 coins on the long list

DESCENDING TRIANGLE $PEPEUSDT -50% dropHello crypto fam! I hope everyone is having not only a wonderful but also profitable day trading. Make sure to smash that LIKE and FOLLOW!
Is FWB:PEPE in a Descending Triangle?
Yes i believe FWB:PEPE is in a large BEARISH DESCENDING TRIANGLE that has the potential to dump FWB:PEPE -50%.
What is a descending triangle?
In Descending Triangle Chart Patterns there is a string of lower highs. This pattern is formed with a trend line that is sloping and a flat or a horizontal support line at the bottom. The pattern emerges as a price bounces off the support level at least twice.
How accurate is trading a descending triangle pattern?
Glad you asked, a descending triangle is a powerful technical analysis pattern with a predictive accuracy of 87%.
Conclusion
Well as i have illustrated in the chart above and described in the description box i believe we are in a descending triangle. Everything in the market seems to make sense for FWB:PEPE to see a massive sell off along with CRYPTOCAP:ETH and $BTC. Expect to see MAJOR bounce around $0.0000003700's level which is where i will be LONGING $PEPE. As far as a timeframe on how long it may be until we see a break down is hard to predict. The FWB:PEPE breakdown will likely be ignited by CRYPTOCAP:ETH and CRYPTOCAP:BTC sell offs. A way to measure this would be once eth breaks $1,600 its likely that FWB:PEPE will follow suit and dump alongside CRYPTOCAP:BTC and other major altcoins.
Thanks, LiquidMEX

NEEDS TO BREAK OUT NOW OR WE ARE FACING LONG CONSOLIDATIONPEPE needs to break out now or max tomorrow or else correction will be inevitable due to weakness of demand. I am long term bullish on this coin but this is not a financial advise. good luck to all hodlers.

📉PEPE is ready for a price jump 📈BINANCE:PEPEUSDT
Hello Traders, please check out my previous ideas.
If the price stabilizes below the yellow area, the long scenario won't be fulfilled.
Targets are on the chart.
Optimum stop-loss is below the 0.0000008415 level.
✌💥If you are satisfied with my analytical content, please share my ideas💥✌
✍🐱👤Otherwise, make sure you leave comments and let me know what you think.🐱👤✍
🤑🍾Thank you for your support. I hope you will gain profit by following my analyses.🍾🤑
CrazyS✌

PEPE to fall by 71% to under 100 million market cap!In the absence of any concrete utility to support the token, nothing seems to prevent Pepecoin from falling below the 100 million mark in market cap.
Shiba Inu expands into DeFi to support its ecosystem. Speculators will be less patient for PEPE.
Developers cashed out and are watching the ship sink!
There is no bullish momentum to reject PEPE's price as it approaches key support at $0.0000008375 or June 2023 low.
If price breaks down this level, there would be another drop to 0.0000003099 support, or more than -71%. PEPE market cap would then be less than 100 million dollars.
PEPE's initial price is $0.00000000001394 according to Techopedia.

Pepe Update | Do Or Die Pepe/USDT Update:
In the higher timeframe (HTF), there's a critical situation – it's a "do or die" moment. Pepe is currently testing a significant support level on the daily chart. This level is crucial for Pepe/USDT, and it's important for buyers to maintain this support.
I anticipate the price might rebound from here because of liq pending on the upper side. However, this is just an idea and not financial advice. Always conduct your own research before making any decisions.
Best of luck! If you appreciate our insights, please consider showing your support.
Wishing you successful trading!
Pepe dump #Pepe is in descending parallel channel. It will go down to touch the bottom line of this channel by following blue arrow.
If you want to buy then wait for price to break and go above the green trendline.

$PEPE / present from me to you long setup: entry 0.000000944$ with a stoploss at 0.000000823$ (target 0.0000015$)
short setup: entry 0.00000153$ with a stoploss at 0.0000016$ (target 0.00000104$)

📉PEPE is on the road to 30-40% retracement 📈BINANCE:PEPEUSDT
OKX:PEPEUSDT
Hello Traders, please check out my previous ideas.
If the price stabilizes above the previous price ceiling, the short scenario won't be fulfilled.
targets are on the chart.
optimum stop-loss is above the 0.2561 level.
✌💥If you are satisfied with my analytical content, please share my ideas💥✌
✍🐱👤Otherwise, make sure you leave comments and let me know what you think.🐱👤✍
🤑🍾Thank you for your support. I hope you will gain profit by following my analyses.🍾🤑
CrazyS✌

PEPE is ready to increase at least ➕10%🚀🚀🚀PEPE is moving on the 🟢 support zone 🟢.
According to Elliott's wave theory, PEPE started to form 5 downward waves after losing its uptrend line.
🔔I expect wave 5 to finish at the 🟢 support zone 🟢 and PEPE to grow at least ➕ 10% 🚀🚀🚀.
Pepe Analyze ( PEPEUSDT ), 1-hour time frame ⏰.
Do not forget to put Stop loss for your positions (For every position you want to open).
Please follow your strategy, this is just my Idea, and I will be glad to see your ideas in this post.
Please do not forget the ✅' like '✅ button 🙏😊 & Share it with your friends; thanks, and Trade safe.

Pepe/usdt Update PEPE/USDT Daily Chart:
If you've been following our updates, you know we were waiting for this demand zone as a buying opportunity. Pepe has now reached our buying zone. There's a possibility of a 40-60% rise in the upcoming days from this demand zone.
Remember: This is just an idea. It's important to do your research before making any decisions.
Wishing you the best of luck! And if you're satisfied with our work, please consider showing your support.
Happy trading!

PEPE to see a price reversal?PEPE hit a crucial roadblock, a breaker block of $0.00000136 - $0.00000155, red. With a weak BTC below the $29.5k range-low, a price reversal could be likely at the above roadblock, offering a shorting opportunity.
Entry: $0.00000140
Take-profit: $0.00000120
Exit: $0.00000150
RR: 2
However, the H4 market structure was bullish, and a BTC cross above $29.5k could quickly invalidate the set-up.

PEPE LONGLook at the chart PEPE will run like another meme coin but look at annoucement in twitter pauly0x for make sure this crypto good to buy

🐸PEPE🐸 Analyze (Road Map)!!!🗺️(15 min)Hi everyone👋.
PEPE is moving in the 🔴 resistance zone 🔴.
🌊According to Elliott's wave theory , PEPE is completing the main wave 5 . (currently completing microwave 5 of main wave 5).
💡Also, we can see Regular Divergence(RD-) between wave 3 and wave 5.
🔔I expect PEPE to go UP to the upper area of the resistance zone and then start to FALL again and lose the uptrend line .
--------------------------------------------------------------------------------
🌐➕ Positive News ➕🌐:
Meme Coins PEPE and SHIB Rally Double Digits on the Week.
Analyst Predicts Potential Breakout For Pepe Coin With $1B+ Market Cap In Sight: 'Breakout Has Barely Started.'
Crypto Analyst Predicts Parabolic Run for Memecoin Pepe (PEPE), Updates Outlook on Dogecoin (DOGE).
🌐➖ Negative News ➖🌐:
Attention to PEPE is not the same as before.
--------------------------------------------------------------------------------
Pepe Analyze ( PEPEUSDT ), 15-minute time frame ⏰.
Do not forget to put Stop loss for your positions (For every position you want to open).
Please follow your strategy, this is just my Idea, and I will be glad to see your ideas in this post.
Please do not forget the ✅' like '✅ button 🙏😊 & Share it with your friends; thanks, and Trade safe.

PEPE target .18~.24h time frame
-
PEPE creating a potential double bottom structure.
According to this pattern, there are three resistances zone can also be set as targets.
It could provide a good risk to reward ratio for trading.
TP: .1798~.2 / .2121 / .241
SL: .1027

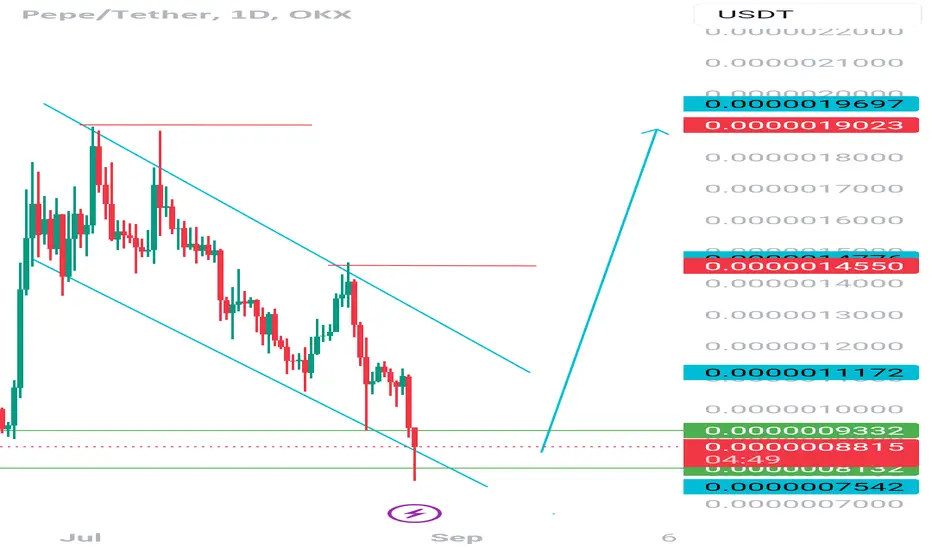
PEPE PEPEUSDT Price Analysis (8h)Hello, esteemed traders and crypto enthusiasts!
Let's embark on a detailed exploration of PEPEUSDT's current market dynamics and presence of the Bullish Divergence. 📈💹
📉 Triangle Breakout and Target Projection:
PEPEUSDT's recent price action showcases a downward trajectory following a breakout from a triangle pattern. The configuration of this pattern signifies a potential target level hovering around the 8320 mark. Interestingly, this target aligns harmoniously with a zone that has previously acted as a crucial support area.
📈 The Emergence of Bullish Divergence:
However, a comprehensive analysis requires us to zoom in on the Relative Strength Index (RSI) indicator. Upon closer examination of the 8-hour timeframe, a noteworthy phenomenon is on the horizon: Bullish Divergence. This phenomenon is pivotal, as it signals a potential shift in the prevailing market sentiment.
🚀 Understanding Bullish Divergence:
Bullish Divergence occurs when the price of an asset is moving downwards while the RSI is moving upwards. This discrepancy suggests that the selling pressure may be waning, despite the price continuing its descent. It often foreshadows a potential trend reversal or a substantial price rebound.
📈 Harnessing Bullish Divergence for Trading:
In this context, if market participants perceive the emerging Bullish Divergence as a compelling buy signal, it could usher in a series of intriguing possibilities. This includes a potential rebound in the price trajectory. The violet resistance line, which had previously constrained the price, could potentially face a breakout.
🎯 Upside Targets and Potential Breakout:
Should this scenario materialize, the price movement might gravitate towards resistance levels located at 12500 and 14400. These levels are significant as they have historically acted as crucial barriers to upward price progression.
🚨 The Key Factor: Risk Management 🛡️:
As traders, it is crucial to underscore the significance of meticulous risk management strategies. While Bullish Divergence offers a glimmer of potential upward movement, it's essential to integrate this insight into a broader risk assessment framework.
Happy trading, fellow crypto enthusiasts! 🚀📈💰

PEPE COIN NEXT POSSIBLE MOVE!!In last 24 hrs pepe token price almost drop upto 10%.
1D AND 4H CHART
small bounce back expected from its first support
and incoming days possible we visite its 2nd support ( meme token if trade go against you then must book your loss longterm holding on pepe coin is not a good option )
FOLLOW ME FOR MORE ANALYSIS
