PEPE(UPDATE)Hello friends
Due to the heavy price drop, you can see that buyers are slowly entering, and now there is a good opportunity to buy in stages and with capital management and move towards the specified goals.
Don't forget to save profit on each target.
*Trade safely with us*
Pepesignals

Breaking: $PEPE Coin Dipped 10% Today- Is the Frog Meta Dead?Pepe the Frog ( CRYPTOCAP:PEPE ) memecoin saw its token price plummet by 10% today albeit the general crypto landscape experienced a deja vu as The US Personal Consumption Expenditures (PCE) inflation numbers for February have been released, showing a steady trend in headline inflation but a slight uptick in core inflation.
Bitcoin and altcoins have extended losses further from earlier today as BTC slips under $85,000, while Ethereum (ETH) tanks 7% slipping under $1,900. Current trend shows that investors could expect strong volatility over the weekend.
US PCE Data Shows Inflation Remains Sticky
As per the Bureau of Economic Analysis, the US PCE inflation data remained unchanged at 2.5% for the month of February, aligning with the market expectations and the previous month’s reading. However, the year-over-year core inflation came hotter-than-expected at 2.8%, higher than both the previous reading of 2.6% and the expected 2.7%.
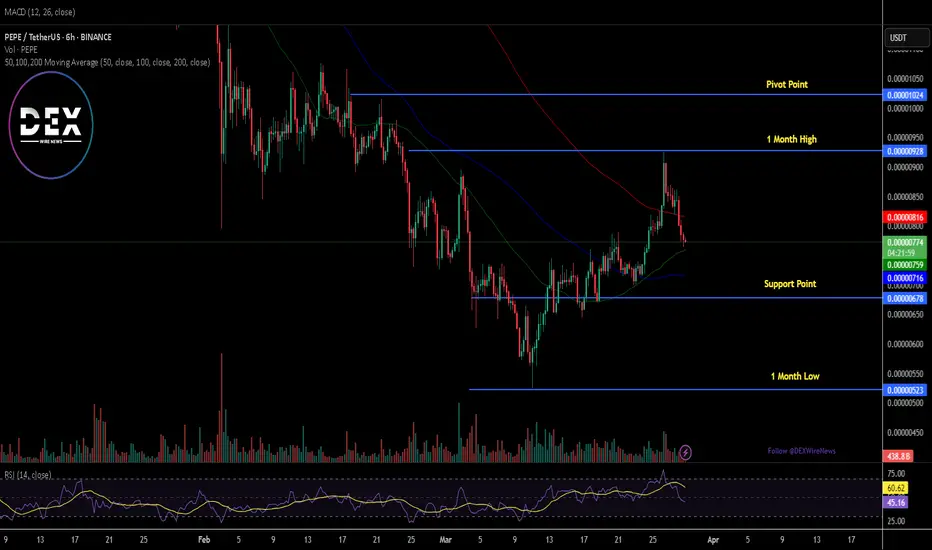
Technical Outlook of PEPE
As of the time of writing, CRYPTOCAP:PEPE is down 8% trading within a bearish trend pattern. the asset is approaching the 65% Fibonacci retracement point is serving as support point should selling pressure submerged. Furthermore, with the RSI at 45, there might be further consolidatory move by CRYPTOCAP:PEPE to cement a perfect liquidity pick region to increase the demand for $PEPE.
Pepe Price Live Data
The live Pepe price today is $0.000008 USD with a 24-hour trading volume of $519,642,130 USD. Pepe is down 8.84% in the last 24 hours. The current CoinMarketCap ranking is #31, with a live market cap of $3,265,213,245 USD. It has a circulating supply of 420,689,899,653,544 PEPE coins and a max. supply of 420,690,000,000,000 PEPE coins.
PEPEUSDT - bottomed out!Pepe has dropped by more than 80% in the past period, making it one of the most heavily declining coins.
The coin is now sitting on a very strong key support level, so we expect a strong rebound in the coming days.

PEPE: Bear Market Bottom or Just a Dead Cat Bounce?Overview:
BINANCE:PEPEUSDT PEPE experienced a brutal three-month bear market, shedding around 80% of its value from its peak. Currently, PEPE is at a crucial juncture, having reached an important cluster support level—a zone historically respected by traders and often indicative of short-term reversals.
Technical Analysis:
- Bearish Trend (3 months): An 80% decline signals severe selling pressure, common in meme coins after parabolic rises.
- Cluster Support Zone: The current price area (highlighted clearly on the chart) has historically attracted buying interest. It has served multiple times as a pivot point.
- Price Action: The recent bounce looks tentative, indicative of a potential "dead cat bounce" scenario—a temporary recovery in prices before a continuation of the bearish trend.
Key Levels to Watch:
- Immediate Support: Current cluster around 0.006-0.007 USDT. A decisive break below may trigger another sharp sell-off.
- Resistance: Strong overhead resistance around 0.010 USDT, crucial for bulls to regain control. A failure to breach could confirm bearish continuation.
Opinion:
From my experience navigating multiple crypto cycles, meme coin rallies typically end in severe corrections like this one. A bounce at current levels is expected, but caution is essential. This looks like a classic bear market relief bounce rather than a true trend reversal.
Trading Strategy Recommendation:
- Short-term traders may consider playing the bounce cautiously, setting tight stops below the recent lows.
- Long-term investors should remain cautious. Wait for stronger confirmation, ideally above resistance at 0.010 USDT, to confirm the bearish trend is weakening.
Conclusion:
PEPE is currently at a critical inflection point. While a short-term bounce is probable, remain vigilant for confirmation before taking major positions. Protect your capital and trade wisely.
Stay safe & trade smart.
What do you think about PEPE's current situation? I'd love to hear your insights below.
#PEPE #CryptoTrading #TechnicalAnalysis #CryptoVeteran #TheCryptoFire

Breaking: The $PEPE X Account Has Been CompromiseThe CRYPTOCAP:PEPE team took to their telegram community to announced that the official X (Formerly Twitter) account has been compromise. Needless to say that the token was already down 3.54% as of the time of writing. With the RSI sitting at 36 more selling pressure could surmount.
What Is PEPE?
PEPE is a deflationary memecoin launched on Ethereum. The cryptocurrency was created as a tribute to the Pepe the Frog internet meme, created by Matt Furie, which gained popularity in the early 2000s.
The project aims to capitalize on the popularity of meme coins, like Shiba Inu and Dogecoin, and strives to establish itself as one of the top meme-based cryptocurrencies. PEPE appeals to the cryptocurrency community by instituting a no-tax policy and being up-front about its lack of utility, keeping things pure and simple as a memecoin
Pepe Price Live Data
The live Pepe price today is $0.000007 USD with a 24-hour trading volume of $454,987,385 USD. We update our PEPE to USD price in real-time. Pepe is down 4.22% in the last 24 hours, with a live market cap of $2,861,929,455 USD. It has a circulating supply of 420,689,899,653,544 PEPE coins and a max. supply of 420,690,000,000,000 PEPE coins.

PEPE BUY (UPDATE)hello friends
Considering the recent drop, the price has now returned well and it can be said that buyers are coming in little by little...
Now we have identified the good support points for you, which you can buy stepwise and with capital management.
*Trade safely with us*

PEPE UPDATE : AGAIN BUYhello friends
Due to the fall of this currency, we are now at the price floor and good conditions have been provided for buying, of course, with capital and risk management...
*Trade safely with us*

PEPE/USDT Breakout Watch: Key Level to Trigger a Bullish SurgeKey Level Analysis
The phrase "if the price closes above this level then" suggests a confirmation level that must be broken for an upward move.
The highlighted level seems to be an area of previous support-turned-resistance (around 0.00001150 - 0.00001200 USDT).
If the price closes above this level on the weekly timeframe, it signals:
Breakout confirmation → Likely leading to a strong bullish rally.
Trend reversal → A shift from bearish to bullish structure.
Momentum entry point → A trigger for potential buy positions.
Potential Price Movement
If the weekly close is above the key level:
The price could rally significantly (illustrated by the large blue arrow).
Next resistance levels could be around 0.00001700 - 0.00002200 USDT.
If the price fails to close above the level:
It could mean a continuation of the downtrend.
Retesting lower support areas around 0.00000650 - 0.00000550 USDT.

#PEPE/USDT#PEPE
The price is moving in a descending channel on the 1-hour frame and is adhering to it well and is heading to break it strongly upwards and retest it
We have a bounce from the lower limit of the descending channel, this support is at a price of 0.00000935
We have a downtrend on the RSI indicator that is about to break and retest, which supports the rise
We have a trend to stabilize above the moving average 100
Entry price 0.00000950
First target 0.000000960
Second target 0.00001000
Third target 0.00001047

#PEPE/USDT#PEPE
The price is moving in a descending channel on the 1-hour frame and is adhering to it well and is heading to break it strongly upwards and retest it
We have a bounce from the lower limit of the descending channel, this support is at a price of 0.0.00000970
We have a downtrend on the RSI indicator that is about to break and retest, which supports the rise
We have a trend to stabilize above the moving average 100
Entry price 0.0.00000986
First target 0.000001013
Second target 0.00000103
Third target 0.000001068

PEPE/USDT 1H: Distribution Pattern Signals Further Downside?!PEPE/USDT 1H: Analysis
🚀 Follow me on TradingView if you respect our charts! 📈 Daily updates!
Current Market Structure:
Price at $0.00000986, continuing within a bearish structure of lower highs and lower lows.
RSI at 40.34, indicating neutral to bearish momentum with no oversold conditions yet.
Smart Money Concepts:
Distribution phase is evident, with declining volumes reinforcing bearish continuation.
Hidden bearish divergence on RSI further supports downside bias.
Accumulation likely around $0.00000900 as Smart Money targets lower liquidity levels.
Key Levels:
Resistance: $0.00001050 (previous support turned resistance).
Support: $0.00000950 (next key level).
Stop Loss: Above $0.00001100 (recent swing high).
Targets:
T1: $0.00000900 (short-term target).
T2: $0.00000850 (extended target).
Risk Score:
7/10 – High-risk environment due to bearish continuation, but clear levels for invalidation.
Market Maker Intent:
Smart Money appears to be offloading positions, as distribution patterns emerge.
Liquidity below $0.00000950 and $0.00000900 could act as magnet levels for the next move.
Recommendation:
Short entry favorable at the current price of $0.00000986.
Maintain stops above $0.00001100 to limit losses in case of invalidation.
Monitor for a break below $0.00000950 for confirmation of extended downside.
Confidence Level:
7/10 – Bearish continuation supported by technical and volume analysis.
🚀 Follow me on TradingView if you respect our charts! 📈 Daily updates!

PEPE/USDT 1H: Bulls Target $0.00001500 After Key Accumulation !PEPE/USDT 1H Chart Analysis
🚀 Follow me on Tradingview if you respect our charts 📈
Market Condition:
Consolidation after a sharp decline, showing signs of accumulation around $0.00001299.
RSI: Bullish divergence from oversold territory, suggesting potential upward momentum.
Volume Profile: Indicates smart money activity at current levels.
Key Levels:
Entry Zone: $0.00001299-$0.00001310
Targets:
T1: $0.00001400 (previous support turned resistance).
T2: $0.00001500 (major psychological level).
Stop Loss: Below $0.00001250 (recent low).
Smart Money Analysis:
Accumulation visible in the discount zone.
Hidden Bullish Divergence: Forming on RSI, supporting a potential reversal.
Fair Value Gap (FVG): Above $0.00001400, likely to act as a magnet for price.
Risk Score: 6/10
Moderate risk due to recent volatility, but reversal signals are promising.
Recommendation:
Long position within the $0.00001299-$0.00001310 range.
Watch for volume confirmation as price approaches $0.00001400.
Keep position sizes conservative to manage risk effectively.
Confidence Level: 7/10 for bullish reversal potential.
🚀 Follow me on Tradingview if you respect our charts 📈

$PEPE will hit ATH again and again?analysis using SNR ORIGINAL Chart Pattern. trade at ur own risk ya. stick with SL

PEPEUSDT: Flash Crash? I’m Ready!PEPEUSDT isn’t looking too strong right now, big sell-offs, not great.
But here’s the deal: I’ve got my blue boxes lined up, and they’re solid. If a flash crash comes, those zones are where I want to meet the price.
This is a long-term play, folks. Smart levels, strong technicals, and a tight stop-loss just below—because we don’t take unnecessary risks. If the market gives us the opportunity, we’re ready to take it.
Patience is key here. Big moves, smart decisions that’s how you win. Let’s watch and see!
I keep my charts clean and simple because I believe clarity leads to better decisions.
My approach is built on years of experience and a solid track record. I don’t claim to know it all, but I’m confident in my ability to spot high-probability setups.
My Previous Analysis
🐶 DOGEUSDT.P: Next Move
🎨 RENDERUSDT.P: Opportunity of the Month
💎 ETHUSDT.P: Where to Retrace
🟢 BNBUSDT.P: Potential Surge
📊 BTC Dominance: Reaction Zone
🌊 WAVESUSDT.P: Demand Zone Potential
🟣 UNIUSDT.P: Long-Term Trade
🔵 XRPUSDT.P: Entry Zones
🔗 LINKUSDT.P: Follow The River
📈 BTCUSDT.P: Two Key Demand Zones
🟩 POLUSDT: Bullish Momentum
🌟 PENDLEUSDT.P: Where Opportunity Meets Precision
🔥 BTCUSDT.P: Liquidation of Highly Leveraged Longs
🌊 SOLUSDT.P: SOL's Dip - Your Opportunity
🐸 1000PEPEUSDT.P: Prime Bounce Zone Unlocked
🚀 ETHUSDT.P: Set to Explode - Don't Miss This Game Changer
🤖 IQUSDT: Smart Plan
⚡️ PONDUSDT: A Trade Not Taken Is Better Than a Losing One
💼 STMXUSDT: 2 Buying Areas
🐢 TURBOUSDT: Buy Zones and Buyer Presence
🌍 ICPUSDT.P: Massive Upside Potential | Check the Trade Update For Seeing Results
🟠 IDEXUSDT: Spot Buy Area | %26 Profit if You Trade with MSB
📌 USUALUSDT: Buyers Are Active

#PEPE $PEPEUSD Is seaking demand.CRYPTO:PEPEUSD Key levels:
0.00021600 = Nearest Weekly/Daily Supply
0.000014900 = Nearest Demand / Breakout level
0.000010100 = Channel lower wedge last buying level "Below this the coin turns bearish"
CRYPTO:PEPEUSD
Is currently seeking demand after the price has tested the recent nearest supply around 0.00021600.
Price is determined to test the nearest demand around 0.00014900. A daily close below this level is unlocking a new zone that extends until the lower channel wedge around 0.000010100.
The coin is abuy as long as it is trading above 0.000010100. Any daily/monthly close below this level is bearish.
#AHMEDMESBAH #CRYPTOCOIN #PEPE #PEPEUSD #ETHEREUM #MEMECOIN #MEME #SUPPLYANDDEMAND #CRYPTOCURRENCY


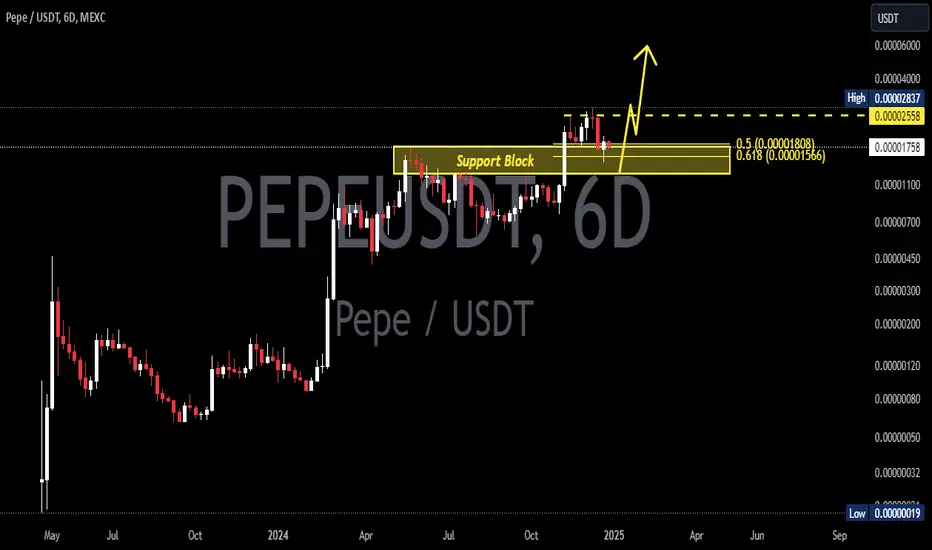
PEPEUSDT 6DPEPE Update ~ 6D
#PEPE So far it still maintains its bullish structure. Buy gradually within this support block,. it's only a matter of time these Memes will make new highs.
PEPE - Hold box to go higherPEPE - Hold orange box to go higher. Which I think will happen if BTC behaves

Pepe drops 8%, further weakness expected: analysisPEPE’s price has dropped nearly 8% in the past 24 hours, days after reaching its all-time high on December 9. Momentum indicators, including the RSI at 33.3, show that PEPE is nearing oversold territory but has not yet hit the critical threshold of 30, leaving room for further correction.
Additionally, the 7D MVRV Ratio at -9.3% points to significant short-term holder losses, with historical data indicating a potential downside toward -12% to -15% before a rebound. Whether PEPE holds its key support at $0.0000188 or breaks lower will likely define its next major price movement.
PEPE RSI is currently at 25.87, reflecting a sharp decline since December 16. This indicates that the meme coin is approaching oversold territory, as its RSI nears the critical threshold of 30.
On the chart, the support at $0.0000188 is a critical level for PEPE price, as a breakdown below it could lead to further declines. If this support fails, PEPE may test $0.000017, with the potential to drop as low as $0.000011, representing a 47% correction from current levels.
This bearish outlook is reinforced by its EMA lines, which have formed a death cross as short-term EMAs cross below long-term EMAs, signaling continued downside momentum.
On the other hand, if PEPE price can regain positive momentum, it could challenge the resistance at $0.0000227.
A breakout above this level could open the door to further gains, with targets at $0.0000259 and potentially $0.000028 if the uptrend strengthens.

PEPE / USDT : rebounding from support, prepping for breakout PEPE/USDT: Rebounding Strongly from Trendline Support, Prepping for a Breakout
PEPE/USDT is showing signs of strength 📈 as it rebounds from a critical trendline support zone 📊. The pair is forming a bullish setup, indicating a potential breakout 💥 in the coming days. If this breakout materializes, we could witness a powerful bullish rally 🚀. Stay vigilant 👀 and wait for confirmation before taking action.
Key Insights:
1. Trendline Support: PEPE/USDT is respecting a long-standing trendline support, providing a solid foundation for a potential upward move. A breakout above resistance could trigger a strong bullish trend.
2. Volume Surge: Monitor trading volume closely—a significant increase during the breakout will confirm buyer strength 🔥.
3. Bullish Signals: Momentum indicators such as RSI and MACD are turning upward ⚡, supporting the likelihood of a bullish breakout.
Steps to Confirm the Breakout:
Wait for a decisive 4H or daily candle closing above the immediate resistance level 📍.
A noticeable spike in volume during the breakout will confirm strong buying activity 📊.
A successful retest of the broken resistance as a new support zone adds credibility to the move ✅.
Watch out for fake breakouts, such as wicks above the resistance or sudden reversals ⚠️.
Risk Management Strategies:
Set stop-loss orders below the trendline support to protect your capital 🔒.
Position sizing should align with your overall trading plan and risk tolerance 🎯.
This analysis is for educational purposes only and not financial advice. Always conduct your own research (DYOR) 🔍 before making investment decisions.

pepe coin can be legend?"🌟 Welcome to Golden Candle! 🌟
We're a team of 📈 passionate traders 📉 who love sharing our 🔍 technical analysis insights 🔎 with the TradingView community. 🌎
Our goal is to provide 💡 valuable perspectives 💡 on market trends and patterns, but 🚫 please note that our analyses are not intended as buy or sell recommendations. 🚫
Instead, they reflect our own 💭 personal attitudes and thoughts. 💭
Follow along and 📚 learn 📚 from our analyses! 📊💡"

PEPE - Ready for another PUMP
If you have been following my previous PEPE analysis, you will find whale movements and sentiment has been covered accurately across the past month of trading.
We have seen a whale re enter a position yesterday potentially confirming another key support for PEPE, If you are interested check out my previous PEPE posts to see how whales have manipulated the market.
ALERT:
Yesterday's whale re entering market sees Net Cumulative flow head back to - 7 trillion PEPE, signaling a move from exchanges back into cold wallet storage. this along with my whale tracker saw another whale enter the chat.
Key takeaways, we should now be looking for key level buying opportunities, but keep an eye on whale movements, they may take advantage of the bearish sentiment caused by liquidating over leveraged longs, don't panic sell, PEPE definitely has room to grow this alt season

PEPEUSDT AnalysisWhen our latest PEPEUSDT.P analysis( 1000PEPEUSDT.P: Prime Bounce Zone Unlocked ) was very accurate I wanted to check the chart again and sharing my thoughts with you.
Demand Zone: The price action indicates a clean demand zone where buyers previously stepped in.
Range Analysis: Using the recent swing high and low, the 0.5 Fibonacci retracement level aligns closely with the demand zone, strengthening its importance as a possible buyer zone.
Key Levels to Watch:
Demand Zone: Blue Box
0.5 Fibonacci Level: (0.022)
A confluence of these levels could attract buyer interest if the price retraces into this area.
Trading Plan:
Bullish Scenario:
Wait for the price to retest the demand zone.
Confirm with bullish price action, such as pin bars or engulfing candles, for a long entry.
Bearish Scenario:
If the price breaks below the demand zone and the 0.5 Fibonacci level, consider this invalidated. Look for new structures below.
Additional Notes:
Keep an eye on the volume; increased volume near these levels could signify stronger buyer activity.
Place stop losses below the demand zone for protection.
I keep my charts clean and simple because I believe clarity leads to better decisions.
My approach is built on years of experience and a solid track record. I don’t claim to know it all, but I’m confident in my ability to spot high-probability setups.
My Previous Analysis
🐶 DOGEUSDT.P: Next Move
🎨 RENDERUSDT.P: Opportunity of the Month
💎 ETHUSDT.P: Where to Retrace
🟢 BNBUSDT.P: Potential Surge
📊 BTC Dominance: Reaction Zone
🌊 WAVESUSDT.P: Demand Zone Potential
🟣 UNIUSDT.P: Long-Term Trade
🔵 XRPUSDT.P: Entry Zones
🔗 LINKUSDT.P: Follow The River
📈 BTCUSDT.P: Two Key Demand Zones
🟩 POLUSDT: Bullish Momentum
🌟 PENDLEUSDT: Where Opportunity Meets Precision
🔥 BTCUSDT.P: Liquidation of Highly Leveraged Longs
🌊 SOLUSDT.P: SOL's Dip - Your Opportunity
🐸 1000PEPEUSDT.P: Prime Bounce Zone Unlocked
🚀 ETHUSDT.P: Set to Explode - Don't Miss This Game Changer
🤖 IQUSDT: Smart Plan
⚡️ PONDUSDT: A Trade Not Taken Is Better Than a Losing One
💼 STMXUSDT: 2 Buying Areas
