Pepe: Pump or Dump ? Watch the Whales
Pepe coin, often the poster child for volatile meme coins, is showing signs of another major rally. Recent on-chain data, analyzed through our PEPE Whale Activity Indicator, highlights intriguing patterns of whale accumulation and distribution that may signal a bullish breakout is on the horizon.
Between November 10 and November 14, 2024: We saw a massive pump from PEPE, quite characteristically. On the 10th we saw an increase to 13 whale wallets followed by a 3 day drop off of 3 major whale wallets signaling a large selloff and price rally.
This Pump resulted in a final day of 1.1 trillion in PEPE being sold off.
Interestingly enough the following day we see a huge reinvestment of 4.7 Trillion PEPE back into cold wallets of large whales and an increase in our whale wallet count back up to 12 wallets.
On the 18th we see a whale increase to 13 whales as seen before the initial pump.
The Turning Point:
Fast forward 8 days, and the data reveals more bullish momentum:
The cumulative net flow has reached a -9.12 trillion PEPE, indicating that whales have been steadily withdrawing tokens from exchange wallets and transferring them into cold storage.
What This Means for Pepe
The current pattern is strikingly similar to earlier accumulation-distribution cycles that preceded significant price rallies:
Accumulation Phase:
The 4.7 trillion PEPE accumulation on November 14, coupled with increased whale numbers during the following minor price dips, suggests that whales are preparing for another potential pump.
Key Metrics to Watch
As Pepe enters this critical phase, traders should monitor these metrics closely:
Cumulative Net Flow: Continued negative net flow signals sustained accumulation and a potential price floor.
Whale Count Trend: A further decline in whale numbers could indicate the beginning of distribution, setting the stage for a pump.
Price-Volume Correlation: Watch for volume spikes, as they often confirm the onset of price momentum.
Conclusion: A Pump in the Making?
Pepe's current on-chain data suggests the market is entering a whale-driven accumulation-distribution cycle. The 4.7 trillion PEPE accumulation day on November 14, combined with the -9.12 trillion PEPE cumulative net flow.
For savvy traders, this could be a pivotal moment. Pepe is volatile, but with patterns aligning for another pump, now may be the time to prepare for the next big move. Will Pepe break out, or will the whales play another trick? Keep an eye on the charts—opportunity awaits.
PEPEUSDT

#PEPE - Long Setup FormationBINANCE:PEPEUSDT looks like it forms some juicy lows for market makers to sweep
and fuel the next leg up
Will it use the closest demand zone for it, or will it need more liquidity below to have enough?
I expect sometime tomorrow to see the pivot for the next leg up so keep an eye on #PEPE to make sure you don't miss this long!

SasanSeifi|Is PEPE Poised for Another ATH After Corrections?Hey there, In this analysis, we examine the price movement of BINANCE:PEPEUSDT cryptocurrency in the daily timeframe. As shown on the chart, the price started its bullish phase from the $0.000010 range and, after breaking the structural level (BMS) at $0.000012, attracted additional demand. This upward momentum pushed the price beyond its previous all-time high (ATH) of $0.000017, leading to the formation of a new ATH at $0.000025.
Currently, after a significant rally, PEPE has undergone minor corrections. These corrections appeared as a pullback to the previously broken resistance level, with the price showing a positive reaction at $0.000018. Given the current price behavior, it is anticipated that in the medium to long term, PEPE could reach new price targets at $0.000027, $0.000029, and $0.000030.
If the price can maintain the support levels between $0.000018 and $0.000017, the bullish trend is likely to continue, potentially reaching new ATHs.
❌However, given the highly volatile nature of this cryptocurrency and its characteristics as a meme coin, it is advisable to allocate only 1% of your portfolio to this asset.
💡 Keep in mind, this is just my personal perspective and shouldn't be considered as financial advice. I’d love to hear your thoughts and engage in a discussion!
Happy trading!✌😎
Feel free to reach out if you have any questions or need more clarification. I'm always here to assist!✌
If you want any further adjustments, just let me know!

Pepe (PEPE) may be poised for a new ATH. Here's why:Following the channel breakout rally in PEPE price creating an ATH in November, the meme coin shows a post-retest rally. As the bull run restarts in PEPE, bulls anticipate the rally to create a new ATH next week.
In the daily chart of PEPE, the meme coin shows a bullish recovery, regaining momentum. The ongoing recovery trend started near the $0.000075 with a Morning Star pattern.
This rally peaked at nearly 200%, nearly $0.000025. However, the falling channel breakout rally took a quick retest of the previous all-time high near the $0.000017223.
The 10% surge last night, creating a bullish engulfing candle, ended the five-day consecutive red-candle streak. It also marked the post-retest bounce back for the meme coin.
Currently, the bull run is extended with an intraday gain of 2.79% as the PEPE price trades at $0.00002126.
Using the trend-based Fibonacci levels, the uptrend is approaching the 23.60% Fibonacci level at $0.00002303. Considering that the recovery run of the broader market will be prolonged, the PEPE price bull run is likely to reach $0.00002989 by the end of November.
Hence, the PEPE price will explode with a massive upside of 40% in the next week. On the flip side, the $0.00001879 will likely provide bullish support.

BeamTrend broken out from a consolidation and currently retesting support. Targets mentioned on the chart.
I would like it bounce back from 0.618 level that would seem like a great buy oppurutunity

HolderStat | Memecoins included in the top 100📊 This week’s analysis of top 100 memecoins revealed some surprises: classic memes like DOGE and SHIB didn’t make the top 5 performers or underperformers. Their lower volatility makes them less appealing for quick gains on price growth.
📉 Coins on the Solana network faced notable declines, presenting an opportunity to build positions at lower prices.
🔥 Meanwhile, fresh memecoins across various networks delivered impressive results, grabbing the spotlight for the week.

BUY Opportunity for PEPE/USDT – More than +10% Upside Potential!Is it now, or will you miss the boat?
PEPE has broken out of a descending triangle pattern and is currently testing the breakout level near 0.00002000, offering an excellent buying opportunity with a potential upside of over 10%. This classic descending triangle breakout, combined with a pullback to retest the breakout line, often signals the beginning of a bullish trend.
Entry Plan:
Traders are advised to wait for rejection confirmation from 0.00002075 (support entry line) on lower timeframes (1H/30M) before entering. This validation ensures strong buyer activity and improves the chances of a successful trade.
Final Note:
PEPE is at a critical decision point. If buyers step in now, it could lead to a significant upward push. However, as with any trade, proceed with caution, monitor price action closely, and always manage risk effectively.
Sidenote:
Share your thoughts or results if you’re already trading this setup or planning to enter. Let’s grow together. Good luck! 🚀

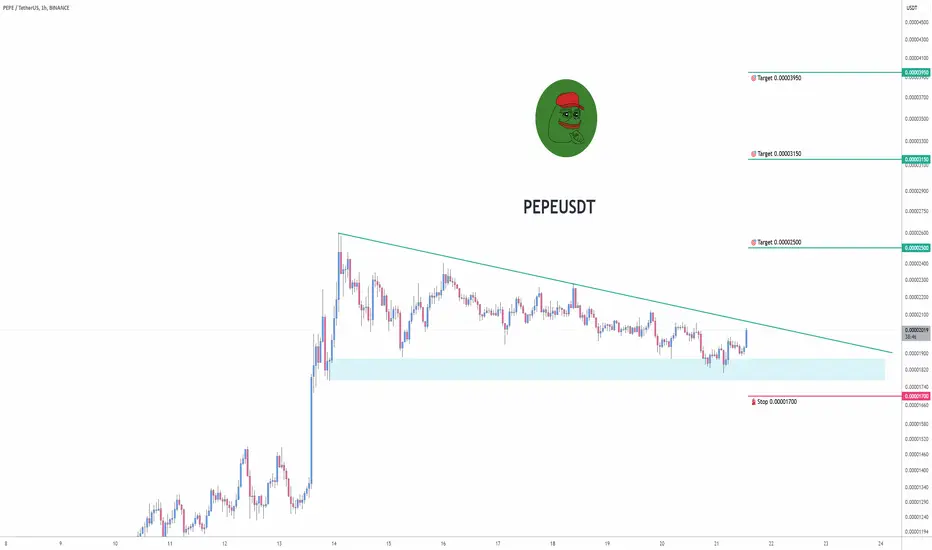
Trading opportunity for PEPEUSDTBased on technical factors there is a Buy position in :
📊 PEPEUSDT
🔵 Buy Now
🪫Stop loss 0.00001700
🔋Target 1 0.00002500
🔋Target 2 0.00003150
🔋Target 3 0.00003950
💸RISK : 1%
We hope it is profitable for you ❤️
Please support our activity with your likes👍 and comments📝
NeiroThe conventional money flow has changed. In my opinion the next in line will be Meme coins.
Neiro has given significant profits in its last run and now it's time to rebuy the giant.

PEPE new ATH is coming Hello and greetings to all the crypto enthusiasts, ✌
In this analysis, I aim to provide you with a comprehensive overview of the future price potential for PEPE, 📚💣
A substantial and encouraging influx of capital has recently been directed towards this stock, reflecting strong investor confidence and growing market interest. This surge in investment activity is particularly noteworthy, as it signals a positive shift in sentiment towards the stock's future performance. At the same time, the key first-layer Fibonacci support levels have been holding up effectively, providing a solid foundation for the price action and reaffirming the strength of the current trend. These technical indicators suggest a robust level of price stability and resilience, even in the face of potential market fluctuations. 📚💡
Given this favorable combination of capital inflow and solid technical support, the stock appears to be on the verge of a significant upward movement. In the near term, we could witness an establishing a new historical high. Such a move would not only signal the continuation of the stock's bullish momentum but also present new opportunities for both short- and long-term investors. As the market dynamics continue to unfold, this stock seems poised for impressive growth, making it a key one to watch in the coming months. 📚🙌
🧨 Our team's main opinion is A significant influx of capital and strong first-layer Fibonacci support levels suggest the stock is well-positioned for substantial growth. In the near future, a sharp rally and a potential new all-time high are likely. 🧨
Thank you for your attention. If you have any questions or comments, I’m here to respond to you. 🐋💡

PEIPEI breakout imminent - Chinese PeipeiPeipei can be seen breaking out from its bearish mode.
A 2000% on the way

A currency that I always loved #pepeThis currency has always been profitable for me, so far I have not lost on this currency.
When the falling trend line was broken, I entered and took a profit of almost 20%. Now this currency has shown a good position for an upward movement. If you are going to buy from these places, don't forget risk and capital management.

PEPEUSDT Forming Bullish Flag$1000PEPEUSDT Technical Analysis update
BINANCE:PEPEUSDT 's price has increased by over 230% from its bottom. It is now consolidating and forming a bullish flag pattern in the middle of the trend. The price could touch the flag pattern support at $0.018 before moving higher, where the 200 EMA will act as support. A bullish continuation can be confirmed once the price breaks the flag's resistance line.
CRYPTOCAP:PEPE CRYPTO:PEPEUSD

BRETT - all time high and moon soon!?Brett - funny meme coin that retail likes to gamble on.
Brett is near all time high and a huge explosion is possible. If you don't already have a Brett position, it may be time to prepare for one. I see a pull back to 0.14 as healthy and a good entry before Brett picks up new power. Right now Retail is rushing into the market and it is not certain that there will be a pull back to the 0.5 fib level.
BRETT is risky with high volatility but with great potential.

Why Crypto Memecoins are Winning Hearts & Wallets ? The Memecoin Supercycle
The Rise of Memecoins as Dominant Players
- Performance Trends: Memecoins are currently outperforming other crypto asset classes, signaling a shift from the uniform growth of all cryptocurrencies to selective surges in niche categories.
-Data Driven Insight: Among the top tokens, memecoins constitute a significant portion of those that have outperformed Bitcoin year2date
Structural Issues in Traditional Crypto Projects
-Overproduction and Valuation Problems:
- The market is flooded with tokens leading to oversaturation and inflated valuations.
- Many altcoins are launched with extremely high valuations, often benefiting insiders while retail investors bear the losses.
-Centralization: Despite the decentralization ethos, token distributions are often controlled by insiders, alienating retail investors.
Why Memecoins Thrive?
-Market Fit: Memecoins resonate with retail investors due to their simplicity, cultural relevance, and the promise of community-driven gains.
-Speculation and Momentum:Memecoins capitalize on speculative dynamics and community participation, often generating cult-like followings.
- Emotional Utility:Beyond financial returns, memecoins provide entertainment, identity, and a sense of belonging—qualities overlooked by tech-driven tokens.
External Factors Boosting Memecoins
-Economic Pressures: Inflation, income inequality, and job insecurities are pushing individuals toward high-risk, high-reward opportunities.
-Cultural Shifts: With declining influence of traditional institutions like religion, people are gravitating towards digital communities and narratives, such as those offered by memecoins.
Memecoins vs Traditional Altcoins
-Token Dynamics: Memecoins simplify the crypto experience by focusing on the community and token without overcomplicating with software utilities.
-Competitive Advantage:Memecoins are described as “better products” for retail investors due to their accessibility, liquidity, and lack of insider-driven dilution.
Predictions for the Future
-Market Growth: there is a chance for $1 trillion market cap for memecoins, with some reaching valuations above $100 billion.
-Shift in Dominance: Memecoins are expected to occupy a more significant share of the crypto market, outperforming utility-focused tokens and tech-backed assets.
-Institutional Adoption: Venture capitalists and traditional finance players are likely to pivot toward memecoins as they recognize their market potential.
Implications for the Crypto Industry
-Reevaluating Narratives: Memecoins challenge the tech-first narrative of crypto by emphasizing community-driven growth and speculative value.
-Tokenization of Faith:Memecoins symbolize a broader trend of financializing belief systems and creating "mini religions" around digital assets.
-Retail-Centric Approach: The success of memecoins highlights the importance of catering to retail investors' aspirations for financial gains, fun, and community.
Long story short
the memecoin supercycle is not only a reflection of market trends but also a response to broader societal changes. Memecoins have become a powerful force in the crypto landscape by aligning with the emotional and speculative desires of investors. As the industry evolves, their role as cultural and financial phenomena is likely to grow, reshaping how we perceive and participate in cryptocurrency markets.
Which meme coins do you think will pump 100X soon? and why!?

$PEPE update on 1D is bullishCRYPTOCAP:PEPE is currently in a rising channel, heading towards a target of 1300.
Support and resistance levels are strong, with both the MACD and RSI in an uptrend. While CRYPTOCAP:PEPE is moving up, this momentum appears to be short-term. The MACD is already high, and the RSI is nearing overbought levels, suggesting a likely rejection around 1300, after which these indicators will need to reset for the price to potentially overcome this resistance.
Look at the chart to identify key support levels— CRYPTOCAP:PEPE is expected to bounce off them while the RSI and MACD reset. Compared to other altcoins, CRYPTOCAP:PEPE has pumped faster, meaning it will likely consolidate for several weeks after this short-term rise. A strong rejection at 1300 is highly probable.
Despite this, the overall trend remains bullish. With a bottom formed at 600, CRYPTOCAP:PEPE appears to be in an uptrend that could last for several months.

PEPEUSDT - Setting Up for a Long OpportunityPEPE/USDT is showing signs of a potential reversal on the 15-minute chart, with price consolidating near a key support zone and buyers stepping in to defend it. This could be a good opportunity to consider a long position if the bullish momentum confirms.
Trade Setup:
Entry: Look for confirmation of a bounce above the support zone.
Target: Aim for a move toward the previous resistance level.
Stop Loss: Consider setting a stop just below the recent support to manage risk.
Rationale: The current consolidation and increased buyer activity suggest that a breakout to the upside is possible. Monitoring indicators like RSI and volume can provide additional confirmation before entering.
Let's see if PEPE can gain momentum and push higher!
Dyor
Hedonist

Alikze »» PEPE | The next rally - 1D🔍 Technical analysis: The next rally, Wave 3 or C bullish scenario - 1D
- It is moving in an ascending channel in the daily time frame.
- After hitting the ceiling of the channel, the price faced a zigzag correction, which faced buying pressure in the demand range.
- In the daily time frame, a movement cycle has been completed up to the ceiling of the channel, after which the correction has been completed with a zigzag correction in the range of the green box.
- After that, it had a rally in the form of the first wave, after which a zigzag correction in the bottom range of the channel met with demand.
💎 Currently, it is located in the middle of the channel due to the failure of the previous roof.
💎 Therefore, this bullish wave can continue the bullish trend to the specified areas with a pullback to the broken structure.
⚠️ In addition, if the price enters the Invalidation LVL range, the bullish scenario will be invalidated.⚠️
»»»«««»»»«««»»»«««
Please support this idea with a LIKE and COMMENT if you find it useful and Click "Follow" on our profile if you'd like these trade ideas delivered straight to your email in the future.
Thanks for your continued support.
Best Regards,❤️
Alikze.
»»»«««»»»«««»»»«««
BINANCE:PEPEUSDT

PEPEUSDT Symmetric Triangle BreakoutBINANCE:PEPEUSDT Technical analysis update
PEPEUSDT has been forming a triangle pattern for the past 240 days and is now breaking the triangle resistance on the daily chart. The price is trading above the 100 and 200 EMAs, suggesting that a strong bullish move can be expected from the current level.
Buy zone : Below 0.0111
Stop loss : $0.00888
Take Profit 1: $0.0130
Take Profit 2: $0.0170
Take Profit 3: $0.0250
Regards
Hexa

What's next for PEPE?It looks as though there is a fractal forming with PEPE that can take it onto significant higher highs. If wave 5 completes, we'll see the same fractal playing out from the two boxes. The Hurst cycles at the bottom also infer that this upward surge can happen quite quickly given there's not a huge amount of time left before the end of the cycle, validation the 5 waves. No matter how good PEPE looks, I'm not going near it. But, it's up to you as they say. Follow for more.

PEPEUSDT Pennant Breakout: Ready for Lift-Off? BINANCE:PEPEUSDT has just broken out of a bullish pennant formation, hinting at a potential strong upmove. Recently, it formed an inverse head and shoulders pattern that led to impressive gains, and now, with this breakout, we could see a similar rally. This setup mirrors BINANCE:DOGEUSDT ’s previous path, suggesting a possible bullish follow-through.
As always, trade with caution. Set your stop loss to manage risk and make the most of this opportunity safely. Trade smart, and let’s see where BINANCE:PEPEUSDT takes us!
OKX:PEPEUSDT.P trading at $0.000011
Buy level: Above $0.00001
Stop loss: Below $0.0000077
TP1: $0.000013
TP2: $0.000017
TP3: $0.000025
TP4: $0.00005
Max Leverage 2x
Follow Our Tradingview Account for More Technical Analysis Updates, | Like, Share and Comment Your thoughts

Pepe price set the trend of the alt-season?🐸 Today we're talking about #memecoins and first, CRYPTOCAP:PEPE
Against the backdrop of news about the upcoming listing or plans to list PEPE on #Coinbase and #Robinhood , the price has skyrocketed.
And this is very good for the upcoming #Altseason, as it was in 2016-17 and a little weaker in 20-21, when any more or less “marketing” news about the project “exploded” the price of the token.
If we look at the OKX:PEPEUSDT chart, you can see how well the price was held in the upper half of the channel. And now the price is close to the upper limit, which suggests that a correction is just around the corner.
And then, depending on the depth of the correction, either (1) or (2) will become a realistic target.
Which target do you prefer?)
_____________________
Did you like our analysis? Leave a comment, like, and follow to get more

#PEPE/USDT#PEPE
The price is moving in a descending channel on the 1-hour frame and sticking to it well
We have a bounce from the lower limit of the descending channel, this support is at a price of 0.00000780
We have a downtrend, the RSI indicator is about to break, which supports the rise
We have a trend to stabilize above the moving average 100
Entry price 0.00000811
First target 0.00000852
Second target 0.00000892
Third target 0.00000950
