CREAMUSDT UPDATECREAMUSDT is a cryptocurrency trading at $10.90. Its target price is $22.00, indicating a potential 100%+ gain. The pattern is a Bullish Falling Wedge, a reversal pattern signaling a trend change. This pattern suggests the downward trend may be ending. A breakout from the wedge could lead to a strong upward move. The Bullish Falling Wedge is a positive signal, indicating a potential price surge. Investors are optimistic about CREAMUSDT's future performance. The current price may be a buying opportunity. Reaching the target price would result in significant returns. CREAMUSDT is poised for a potential breakout and substantial gains.
PEPEUSDT

$COINEX:PEPEUSDT Pepe is a meme-based token that references the famous image of "Pepe the Frog." This image has become very popular on the internet and symbolizes meme culture.
- **Inspired by Previous Successes:** Other tokens like Dogecoin and Shiba Inu have inspired the creation of such cryptocurrencies.
- **Developers and Community:** The developers of the token and the user community significantly impact its success. Social activities and marketing can help increase its price and adoption.
- **Price Volatility:** The prices of meme-based currencies tend to fluctuate significantly. Investors should be cautious of these fluctuations.
- **Adoption and Use:** Although Pepe was initially created as a meme token, it needs wider adoption in wallets and exchanges to survive.
- **Liquidity:** One of the main challenges for new cryptocurrencies is low liquidity, which can affect buying and selling capabilities.
- **Regulation:** As governments pay more attention to the cryptocurrency market, regulations can significantly impact the development and acceptance of these tokens.
Pepe is an appealing token linked to meme culture, but investing in it, like any other cryptocurrency, carries risks. It is advisable to conduct thorough research before investing and to gather more details about the community, goals, and future of this token. If you have specific questions or need more details on particular aspects, I’d be happy to help!
JASMYUSDT UPDATEJASMYUSDT is a cryptocurrency trading at $0.03336. Its target price is $0.06000, indicating a potential 100%+ gain. The pattern is a Bullish Falling Wedge, a reversal pattern signaling a trend change. This pattern suggests the downward trend may be ending. A breakout from the wedge could lead to a strong upward move. The Bullish Falling Wedge is a positive signal, indicating a potential price surge. Investors are optimistic about JASMYUSDT's future performance. The current price may be a buying opportunity. Reaching the target price would result in significant returns. JASMYUSDT is poised for a potential breakout and substantial gains.

PEPE Long Spot OpportunityMarket Context:
PEPE, as a leveraged beta play on Ethereum, tends to outperform during ETH rallies. With price currently interacting with the 200-day EMA, there's a high probability for a bounce from this key support level. A bottom here could lead to a significant rally.
Trade Details:
Entry Zone: $0.00001 (strong bounce zone, near 200-day EMA)
Take Profit Targets:
$0.0000165
$0.00003
$0.00004
Stop Loss: Daily close below $0.000008
This setup offers an attractive risk-to-reward ratio, positioning us for potential upside as PEPE aligns with Ethereum’s momentum. Stay vigilant on price action and adjust stop loss if needed! 📈

PEPE/USDT 1H: Accumulation Underway Bulls Targeting $0.0000150!!PEPE/USDT 1H Chart Analysis
🚀 Follow me on TradingView if you respect our charts 📈Daily new charts!
Current Market Structure:
Neutral-bearish after rejection from 0.00001350 resistance.
Accumulation Zone: 0.00001200 - 0.00001250.
Hidden Bullish Divergence: RSI forming higher lows, while price makes lower lows.
Smart Money Activity:
Market Makers Likely Accumulating at current levels.
Volume Profile: Increasing buying interest.
Multiple Retests of Support: Suggests strong accumulation.
Trade Setup (Confidence 7/10):
Entry Zone: 0.00001297 (current price).
Targets:
T1: 0.00001350.
T2: 0.00001500.
Stop Loss: 0.00001200 (below accumulation zone).
Risk Score: 7/10 (moderate risk, favorable setup).
Key Observations:
RSI Bouncing from Oversold Territory, supporting potential upside.
Market Maker Intent: Accumulation likely before move up.
Break Above 0.00001350: Confirms stronger bullish continuation.
Recommendation:
Long positions valid at current price (0.00001297).
Wait for confirmation above 0.00001350 for higher probability trade.
Manage risk with stops below 0.00001200.
Confidence Level: 7/10 for bullish continuation.
🚀 Follow me on TradingView if you respect our charts 📈Daily new charts!

PEPE/USDT 1H: Bulls Target $0.00001500 After Key Accumulation !PEPE/USDT 1H Chart Analysis
🚀 Follow me on Tradingview if you respect our charts 📈
Market Condition:
Consolidation after a sharp decline, showing signs of accumulation around $0.00001299.
RSI: Bullish divergence from oversold territory, suggesting potential upward momentum.
Volume Profile: Indicates smart money activity at current levels.
Key Levels:
Entry Zone: $0.00001299-$0.00001310
Targets:
T1: $0.00001400 (previous support turned resistance).
T2: $0.00001500 (major psychological level).
Stop Loss: Below $0.00001250 (recent low).
Smart Money Analysis:
Accumulation visible in the discount zone.
Hidden Bullish Divergence: Forming on RSI, supporting a potential reversal.
Fair Value Gap (FVG): Above $0.00001400, likely to act as a magnet for price.
Risk Score: 6/10
Moderate risk due to recent volatility, but reversal signals are promising.
Recommendation:
Long position within the $0.00001299-$0.00001310 range.
Watch for volume confirmation as price approaches $0.00001400.
Keep position sizes conservative to manage risk effectively.
Confidence Level: 7/10 for bullish reversal potential.
🚀 Follow me on Tradingview if you respect our charts 📈

PEPE/USDT 1H: Bulls Eye Oversold Reversal to $0.00001460!
PEPE/USDT 1H Chart Analysis (Smart Money Concepts)
🚀 Follow me on Tradingview if you respect our charts 📈
Current Price: $0.00001225
Market Structure:
Bearish momentum with lower lows and lower highs.
RSI: 30.81, oversold conditions indicating potential for a bounce.
Key Levels:
Resistance: $0.00001460
Support: $0.00001150
Stop Loss: Above $0.00001280 (recent swing high).
Trade Setup (Confidence Level: 7/10):
Entry Zone: $0.00001225 (current price).
Targets:
T1: $0.00001350
T2: $0.00001460
Hidden Bullish Divergence: Forming on RSI, suggesting accumulation and potential reversal.
Smart Money Analysis:
Market makers likely accumulating at current levels following an engineered drop.
Signs of liquidity building for a potential upward move.
Risk Score: 6/10
Decent risk/reward, but tight management required due to prevailing bearish trend.
Confirmation needed with RSI breaking above 40 for stronger confidence.
Recommendation:
Long position at current levels with tight risk management.
Monitor volume and RSI for signs of reversal.
Watch for breakout strength toward the resistance levels.
Confidence Level: 7/10 for potential short-term bounce.
🚀 Follow me on Tradingview if you respect our charts 📈

BTCUSDT H8 : New RoadmapHi Friends,
Following the previous analysis of Bitcoin and the rejection above the ATH , I expect such a movement from the chart. And once again, liquidity can be collected above the historical ceiling.
SecondChanceCrypto
⏰ 21/Jan/25
⛔️DYOR
Always do your research.
If you have any questions, you can write them in the comments below and I will answer them.
And please don't forget to support this idea with your likes and comments.

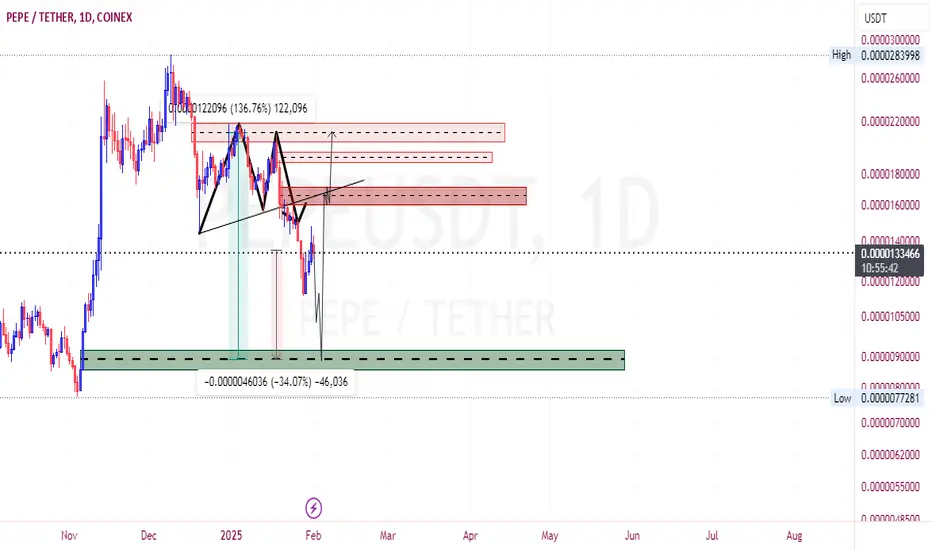
Pepe’s Weak Price Action Signals Trouble AheadAs with many coins, Pepe saw a massive pump following Trump’s election, with the coin hitting a new all-time high (ATH).
However, the bullish momentum quickly faded. After a marginal new ATH at the beginning of December, the price dropped back to the old resistance level, which had turned into support.
In early 2025, bulls made two more attempts to push the price higher, but both efforts failed, sending the coin back to the support zone.
This kind of price action suggests growing weakness. I expect the current support zone to eventually break. If that happens, the coin could accelerate its decline, potentially targeting the 0.000007 area.

$PEPE is again in my buy green box. Time to refill your bag?CRYPTOCAP:PEPE has corrected enough to drop into my green box—lower is better.
From this point, we can expect a potential 2x or more.
If possible, wait for it to touch 0.00001; that would be an amazing opportunity.
Looking at the weekly chart, a drop to 0.00001000 is entirely possible, and 0.000008 would be an absolute gift.

The Time is Now! $PEPE Bottoming and Signaling a 3x PotentialI'm buying CRYPTOCAP:PEPE here. I've been waiting for an SFP at these lows or a touch of the orange line (though it might not reach). I'd rather start longing now and not miss out if the other bids don’t fill. Both the daily and weekly charts show good potential for a reversal. Overall, this is a solid level to enter.
BINANCE:PEPEUSDT

PEPE/USDT 1H: Bulls Building Momentum Toward $0.00001850 PEPE/USDT 1H Chart Analysis
🚀 Follow me on Tradingview if you respect our charts 📈
Current Price: $0.00001578
Market Structure:
Bullish momentum building after a double bottom formation.
RSI: 59.57, indicating bullish divergence and upward potential.
Order Block: Formed at $0.00001450, acting as strong support.
Trade Setup (Confidence Level: 7.5/10):
Entry Zone: $0.00001550-$0.00001580
Targets:
T1: $0.00001700 (FVG fill).
T2: $0.00001850 (previous high).
Stop Loss: Below $0.00001450 (recent swing low).
Risk Score: 6/10 (moderate risk due to meme coin volatility).
Smart Money Analysis:
Institutional accumulation visible in recent volume profile.
A break above $0.00001600 could trigger stop hunts and drive price higher.
Liquidity pools above $0.00001700 act as magnet levels.
Recommendation:
Long position valid in the $0.00001550-$0.00001580 range.
Watch for a confirmed breakout above $0.00001600 to strengthen bullish conviction.
Manage risk carefully due to potential volatility.
Confidence Level: 7.5/10 for bullish continuation.
🚀 Follow me on Tradingview if you respect our charts 📈

PEPEUSDT: Anticipating a Correction Before the UptrendGreetings, fellow traders!
The recent surge in Bitcoin's price, sustained over the past 72 hours, has injected a bullish sentiment into the broader market. For those considering a long position on PEPEUSDT, I anticipate a potential price correction before the primary uptrend commences.
I foresee a possible retracement to the $0.000014150 level, followed by a renewed upward trajectory with two price targets: $0.000017500 and $0.000020000. My recommendation is to consider entering a long position after the anticipated correction, above the $0.000015300 threshold.
Best of luck and profitable trades to all!
BINANCE:PEPEUSDT

PYRUSDT UPDATEPYRUSDT is a cryptocurrency trading at $2.929. Its target price is $4.200, indicating a potential 45%+ gain. The pattern is a Bullish Falling Wedge, a reversal pattern signaling a trend change. This pattern suggests the downward trend may be ending. A breakout from the wedge could lead to a strong upward move. The Bullish Falling Wedge is a positive signal, indicating a potential price surge. Investors are optimistic about PYRUSDT's future performance. The current price may be a buying opportunity. Reaching the target price would result in significant returns. PYRUSDT is poised for a potential breakout and substantial gains.

$PEPE will hit ATH again and again?analysis using SNR ORIGINAL Chart Pattern. trade at ur own risk ya. stick with SL

PEPE/USDT 1H: Bulls Poised for a Breakout to $0.00002100!PEPE/USDT 1H Chart Analysis
🚀 Follow me on Tradingview if you respect our charts 📈
Current Market Analysis:
Price: Consolidating in a tight range.
RSI: Bullish divergence at 40, indicating potential reversal.
Support: $0.00001450
Resistance: $0.00001750
Trade Setup (Confidence Level: 7.5/10):
Entry Zone: $0.00001500-$0.00001550
Targets:
T1: $0.00001750 (previous resistance).
T2: $0.00001900.
T3: $0.00002100.
Stop Loss: Below $0.00001400.
Risk/Reward: Favorable with a 1:3 ratio.
Smart Money Analysis:
Accumulation: Visible at support level, suggesting preparation for an upward move.
Liquidity Target: Market makers likely aiming above $0.00001900.
RSI Divergence: Hidden bullish divergence supports the bullish case.
Risk Score: 7/10 (moderate risk, manageable with position sizing).
Recommendation:
A long position is favorable within the entry zone.
Employ strict risk management to safeguard against potential downside.
Watch for volume confirmation as price approaches resistance levels.
Confidence Level: 7.5/10 for a bullish setup.
🚀 Follow me on Tradingview if you respect our charts 📈

PEPE/USDT 1H: Bulls Gearing Up for a Reversal!PEPE/USDT 1H Chart Analysis
Current Price: $0.00001528
Market Structure:
Bearish trend with lower highs and lower lows.
Consolidation phase near potential reversal zone.
Smart Money Analysis:
Distribution phase evident after the recent high at $0.000021.
Multiple Break of Structure (BOS) confirmations to the downside.
RSI indicating bullish divergence, suggesting potential reversal.
Trade Setup (Confidence Level: 7.5/10):
Entry Zone: $0.00001500-$0.00001528
Targets:
T1: $0.00001650
T2: $0.00001750
Stop Loss: Below $0.00001450
Market Maker Activity:
Accumulation signals at current price levels.
Selling volume exhaustion indicates a possible shift in momentum.
Discount blocks formed, highlighting a likely reversal area.
Key Observations:
RSI bullish divergence supports a reversal setup.
Smart money appears to be accumulating in preparation for a potential upside move.
Recommendation:
Consider a long position within the entry range, keeping tight stops.
Monitor volume and breakout confirmations for sustained bullish momentum.
Confidence Score: 7.5/10 for a cautious bullish setup.

DOGEUSDT WEEKLY : Long-term RoadmapHi friends,
I have left you with a long-term analysis of Dogecoin, which I foresee with the Alt Season occurring in the first quarter of 2025.
SecondChanceCrypto
⏰ 19/Jan /25
⛔️DYOR
Always do your research.
If you have any questions, you can write them in the comments below and I will answer them.
And please don't forget to support this idea with your likes and comments.

XLMUSDT UPDATEXLMUSDT is a cryptocurrency trading at $0.4602. Its target price is $0.7000, indicating a potential 60%+ gain. The pattern is a Bullish Pennant, a continuation pattern signaling a potential breakout. This pattern suggests a brief consolidation before a strong upward move. The Bullish Pennant is a positive signal, indicating a potential price surge. Investors are optimistic about XLMUSDT's future performance. The current price may be a buying opportunity. Reaching the target price would result in significant returns. XLMUSDT is poised for a potential breakout and substantial gains. The Bullish Pennant pattern typically leads to a strong upward move.

$PEPE - Mini DistributionOn the daily chart, we can see a mini-distribution is taking place on CRYPTOCAP:PEPE
The immediate resistance is currently at .000020
If we lose .0000168 support, we can see it retesting .000012s or it can wick down to daily imbalance at .00009 area

VTHOUSDT UPDATEVTHOUSDT is a cryptocurrency trading at $0.002696. Its target price is $0.003800, indicating a potential 45%+ gain. The pattern is a Bullish Falling Wedge, a reversal pattern signaling a trend change. This pattern suggests the downward trend may be ending. A breakout from the wedge could lead to a strong upward move. The Bullish Falling Wedge is a positive signal, indicating a potential price surge. Investors are optimistic about VTHOUSDT's future performance. The current price may be a buying opportunity. Reaching the target price would result in significant returns. VTHOUSDT is poised for a potential breakout and substantial gains.

PEPE chart levels to watch PEPE left chart RSI shows when goes below green trendline is time to buy.
Right chart yellow arrows show when daily orange EMA21 goes above yellow MA55 after being below it. These are failed rallies.
Right chart red arrows show when daily orange EMA21 goes above yellow MA55 after being below it. These are confirmed rallies.
We are waiting to see next cross of the daily EMA21 over MA55 and expect a confirmed rally.
Trendline above shows target with yellow fib level major target for parabolic move.
Don't forget to smash that rocket like button!

PEPE/USDT 1H Analysis: Bearish Momentum ContinuesPEPE/USDT 1H Analysis: Bearish Momentum Continues
Current price: $0.00001605, down 0.19%, reflecting strong bearish pressure.
Support and resistance:
Immediate support: $0.0000155 – potential short-term relief zone.
Key resistance: $0.0000177 – acting as a barrier for recovery attempts.
Recent price action:
Clear breakdown from the equilibrium zone, with price falling through multiple support levels.
Consecutive red candles breached the POL (Point of Loss) level, signaling persistent selling pressure.
Volume profile:
Indicates an ongoing distribution phase, with sellers dominating the market.
Trade setup:
Rated 3/10 for longs – current conditions are unfavorable for bullish entries.
Best to wait for:
A clear reversal signal.
Formation of a double bottom around key support zones.
Market outlook: Bearish sentiment dominates until price reclaims resistance at $0.0000177 or shows signs of accumulation.
What’s your perspective on this bearish structure? Drop your insights below! 📉👀
