KO: Coca-Cola (CFD) Earnings 23-07-2025Yesterday we have the Coca-Cola earnings report came out and beat on both earning and revenue. But due to the technical position I do not see it a good entry on the stock CFD, still see PepsiCo stock CFD is a better option.
Disclaimer: This content is NOT a financial advise, it is for educational purpose only.
Pepsi

PEP: PepsiCo Earnings resultsIts looks like PEP is a buy now. Just want to double check on future sales growth as it is stable for a while. Lower stock price made the dividend very attractive since PEP is a defensive stock.
Disclaimer: This content is NOT a financial advise, it is for educational purpose only.

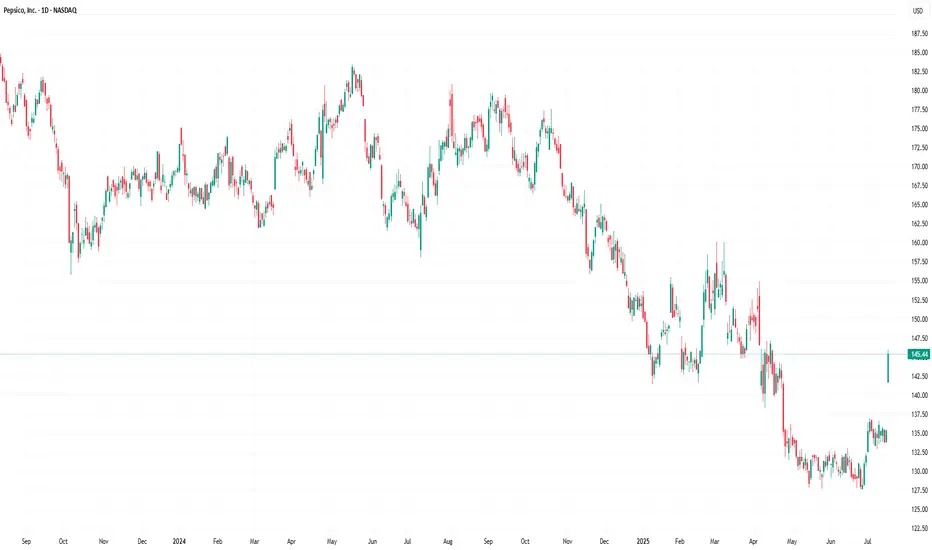
PepsiCo (PEP) Stock Rallies 7.4% Following Earnings ReportPepsiCo (PEP) Stock Rallies 7.4% Following Earnings Report – What Comes Next?
Yesterday, PepsiCo Inc. (PEP) released its quarterly earnings report, which significantly exceeded market expectations:
→ Earnings per share (EPS) came in at $2.12, surpassing the forecast of $2.02.
→ Gross revenue reached $22.7 billion, above the projected $22.3 billion.
In addition, PepsiCo reaffirmed its full-year guidance: the company expects earnings per share to remain virtually unchanged compared to the previous year, while organic revenue is anticipated to grow by a few percentage points.
Executives also outlined development plans for their brand portfolio, emphasising a focus on the growing demand for healthier snacks and a strategic initiative to reduce costs.
These factors contributed to PepsiCo Inc. (PEP) becoming one of the top-performing stocks on the market yesterday – its price surged by 7.4%, reflecting strong investor sentiment. What could come next?
Technical Analysis of PEP Stock Chart
A strong bullish candle formed on the chart yesterday, signalling a spike in demand:
→ The session opened with an impressive bullish gap, decisively breaking through the July resistance level around $137.
→ The share price continued to climb steadily throughout the day, forming a long-bodied candle.
→ The session closed near its high, confirming sustained upward momentum.
Notably, on 27 June (highlighted by an arrow on the chart), the stock posted gains on the highest trading volume of 2025 so far (according to Nasdaq data), which can be interpreted as a potential sign of sentiment reversal driven by institutional investors.
However, the broader picture remains bearish. PEP stock continues to trade within a long-term downward channel, shaped by declining demand for PepsiCo products and intensifying market competition.
Given the above, the following scenario should not be ruled out: the upper boundary of the long-term descending channel may act as resistance in the near term. As the post-earnings euphoria fades, the price could undergo a pullback – for instance, towards the $140 level, which previously served as support.
At the same time, the strong fundamental backdrop, reflecting the company’s operational success, could fuel persistent bullish interest. This may empower buyers to challenge and potentially break the long-standing downtrend in PEP shares.
This article represents the opinion of the Companies operating under the FXOpen brand only. It is not to be construed as an offer, solicitation, or recommendation with respect to products and services provided by the Companies operating under the FXOpen brand, nor is it to be considered financial advice.
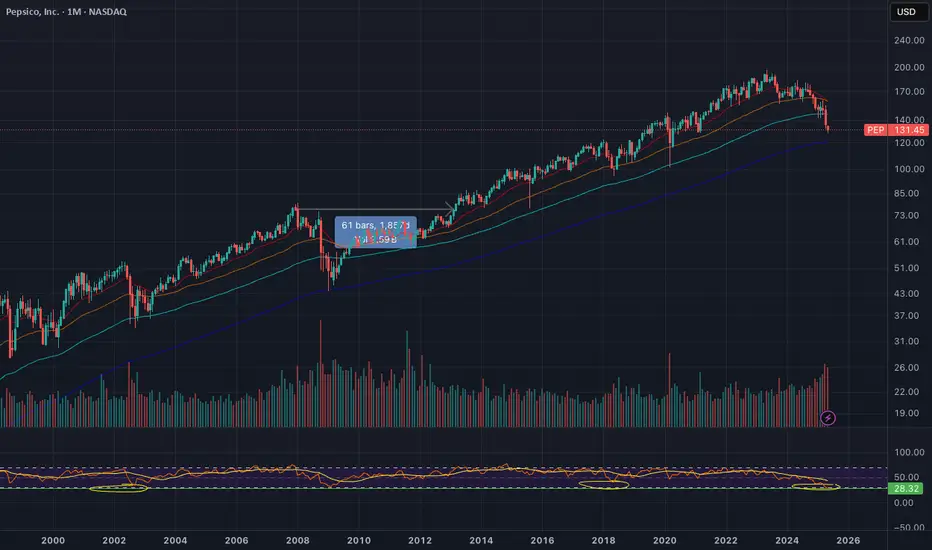
PEP: Long Buy OpportunityPEP is about to touch the 200 Monthly Moving Average. This last 2009.
The RSI is touching less than 30, which last happened in 1973.
PEP is a Dividend King which has increased it's dividend for 53 years. Did Warren Buffett say compounding is the 8th wonder of the world? Oh no, it was Einstein.
Evidence suggests great Long Term BUY opportunity on the price and momentum signals. Compelling.
#PEPSICO (PEP)
PepsiCo: In the Target ZonePepsiCo is currently trading in the middle of our active Long Target Zone (coordinates: $133.53 – $125.10). Although all technical requirements for the correction of wave a in beige have already been met here, we still see some remaining downward potential for the subordinate wave 5 in turquoise within our Target Zone. There's even a 36% chance that the price will fall below our Target Zone as part of the beige wave alt.a , which is relevant for any stop-loss orders and could potentially cause a significant short-term drop. In both our scenarios, however, we expect significant increases after the wave a low.
📈 Over 190 precise analyses, clear entry points, and defined Target Zones - that's what we do.

Sitting in Demand for PEP! OptionsMastery:
🔉Sound on!🔉
📣Make sure to watch fullscreen!📣
Thank you as always for watching my videos. I hope that you learned something very educational! Please feel free to like, share, and comment on this post. Remember only risk what you are willing to lose. Trading is very risky but it can change your life!

$PEP $150 retest Hi, liking NASDAQ:PEP here for a retest of mental price $150. NASDAQ:PEP is at 4 year lows, was at four year lows and bounced twice off $141 zone. Short term $150c could be a play here for April expiration but also could be patient and see if it retests the supply zone of $140. This is on watch. Just acquired Poppi brand as well. Overall it could be forming a rising wedge, not definitive on that thesis just yet, though.
NFA
WSL

PepsiCo: A Dividend King at a Discount – Time to Buy?PepsiCo, Inc. (PEP)
- Sector: Consumer Defensive
- What It Does: Produces beverages and snacks, like Pepsi, Frito-Lay, and Quaker products.
Fundamental metrics
- Dividend Yield: ~3.5%
- Payout Ratio: 67.8%
- 5-Year Dividend Growth Rate: 7.2%
- Debt-to-Equity Ratio: 2.05
- Return on Equity (ROE): 50.8%
- Price-to-Earnings (P/E) Ratio: 18.9
- Price-to-Book (P/B) Ratio: 11.6
- Analyst Average Price Target: $167.00
- Consecutive Years of Dividend Increases: 53
--------------------------
Technical Factors
The stock is currently experiencing its largest correction since the COVID flash crash, with the last major downturn occurring during the 2008 financial crisis. In such a rare scenario, it's worth considering adding one of the top Dividend Kings to your portfolio.
These companies, with a track record of increasing dividends for 50 consecutive years, tend to be financially stable and reliable, making them an attractive option during market corrections. Their consistent dividend payouts offer a solid income stream, providing a level of security in uncertain times.
Criteria:
- Mid-round number at $150, acting as a psychological level
- Channel projection from the top, aligning with the price structure
- Equal waves from the top, suggesting symmetry in the correction
- Previous resistance levels turning into support, reinforcing the zone
- A key trendline inside the marked box, the last missing touch
The price has already met most of these criteria, except for the trendline, and it has rejected upwards twice from this zone. That’s why this level presents a solid long-term opportunity to consider an entry from current levels.
Make sure to conduct your own fundamental research to ensure the investment aligns with your investment thesis. While I can provide a technical "green light," it’s crucial to confirm that it also fits with the underlying fundamentals.
Before you leave - Like & Boost if you find this useful! 🚀
Trade smart,
Vaido

PepsiCo (PEP) – A Strong Long Setup for 2025📈 Ticker: PEP
📊 Timeframe: Swing trade (3-6 months)
🎯 Target Price: $190 - $200
⏳ Entry Zone: $160 - $165
🛑 Stop Loss: $148
🔹 Thesis for the Long Trade
PepsiCo (PEP) is a defensive consumer staple stock with strong brand power, consistent revenue growth, and a resilient business model. As market volatility increases due to macroeconomic concerns, investors tend to rotate into high-quality dividend-paying stocks like PEP.
Despite some near-term pressure from inflation and shifting consumer preferences, PepsiCo’s diversified portfolio (beverages & snacks) and global expansion efforts continue to support long-term growth.
PepsiCo: Strong ReactionThe Pepsi stock recently showed a strong reaction to the support at $141.52, reinforcing the significance of this level. However, we primarily anticipate that this level will be breached next. During the ongoing magenta wave (5), the price should drop into our beige Target Zone (coordinates: $131.12 – $124.50), which presents potential long-entry opportunities. We primarily expect the beige wave a to conclude within this Zone. But if the stock instead breaks above the resistance at $165.13 (probability: 31%), this will confirm that the low of the beige wave alt.a was settled prematurely.

Market Reversal or Just a Pause? PEPSI Faces a Pivotal MomentIs PEP Ready for a Breakout or a Breakdown?
NASDAQ-PEP finds itself at a crossroads, trading at $150.39, nearly 24% below its all-time high of $196.88 from May 2023. However, recent price action suggests that volatility is brewing. The stock has rebounded 6.2% from its absolute low of $141.51, recorded just 24 days ago, and is now hovering near key technical levels.
The 50-hour moving average (MA50) at $151.06 and 100-hour moving average (MA100) at $150.93 indicate that PEP is struggling to maintain upside momentum. Additionally, the RSI14 is at 39.18, signaling that the stock is nearing oversold conditions—historically a zone where buyers start stepping in.
Adding to the intrigue, a Buy Volumes Takeover pattern appeared on January 31, with an attempted push higher, but the main directional force remained bearish. Will buyers finally overpower the downtrend, or is this just another false hope before a deeper correction?
With resistance looming at $155.94, PEP needs a convincing breakout. Failure to reclaim this level could expose it to renewed selling pressure, possibly retesting lower supports at $149.14 and $146.45.
The question remains: Is this the last chance to catch an uptrend before PEP slips further? Stay tuned for the next move!
NASDAQ-PEP: Pattern Roadmap – The Market’s Hidden Clues
The market never moves randomly—every candle tells a story. Let’s break down the latest sequence of patterns that shaped NASDAQ-PEP’s price action and see which signals traders should have paid attention to.
January 27 - Buy Volumes Surge, Bulls Step In
Opening at $152.26 and closing at $153.57, PEP flashed an Increased Buy Volumes pattern, hinting at a bullish move. The next step? Confirmation was needed—would price hold above its recent lows and push higher?
January 28 - Bearish Shift as Sellers Dominate
Just a day later, the script flipped. A Sell Volumes Max pattern took over, pulling PEP down from $150.6 to $150.19. The abrupt reversal signaled a shakeout—weak longs got trapped.
January 29 - VSA Buy Pattern Brings the Bounce
The bulls fought back, forming a VSA Manipulation Buy Pattern. With a low of $150.23 and a push to $150.95, this setup hinted at smart money stepping in. The key was the low of the last three bars—a crucial trigger point for future movement.
January 30 - VSA Sell Triggers a Deeper Drop
Despite the previous day’s rally, VSA Manipulation Sell Pattern 2nd took control, closing at $152.01 from an open of $152.37. This was a textbook trap—prices moved up, only to be swept back down.
January 31 - Buy Volumes Takeover, Bulls Reload
After the prior day’s bearish push, another Buy Volumes Takeover emerged, attempting to shift control back to buyers. The range tightened, but was this a real reversal or another bull trap?
The roadmap shows a clear battle between buyers and sellers, with rapid shifts in direction. The market is at a tipping point—will bulls finally regain control, or is another sell-off looming? Stay locked in.
Technical & Price Action Analysis: Key Levels to Watch
Every market move is a test—either levels hold, or they flip into resistance. Here’s where the real game is played:
Support Levels:
$149.14 – First demand zone. If buyers step in, expect a bounce. If not, it flips into resistance, trapping late longs.
$146.45 – The make-or-break level. A failure here could open the door for a deeper dive.
Resistance Levels:
$155.94 – First wall for bulls. Needs a solid breakout to confirm upside momentum.
$163.18 - $165.15 – Heavy supply zone. If price stalls here, shorts will pile in.
$168.7 - $170.83 – Stronger hands waiting to offload. Only a clean breakout can shift momentum.
Powerful Support Levels:
$169.2 – If price ever reclaims this, the game changes completely.
$196.57 – The final boss level.
Levels are only as strong as their reaction. If support fails, these same levels will act as magnets for sellers, creating resistance on any pullbacks. Stay sharp—this is where the market traps traders.
Trading Strategies with Rays: Precision Entry & Exit Points
The market moves through a dynamic structure of Fibonacci-based rays, where each interaction defines the next move. These rays, combined with VSA (Volume Spread Analysis) levels, create a predictive map—guiding trades from one ray to the next.
Optimistic Scenario: Bullish Ray Interaction
If price interacts with the $149.14 support level and shows buying volume confirmation, we look for a move toward the next ray. The key signals:
Moving averages (MA50 at $151.06, MA100 at $150.93) aligning with price movement.
First target: $155.94 – the first strong resistance where sellers may emerge.
Second target: $163.18 - $165.15 – a breakout here signals trend continuation.
Third target: $168.7 - $170.83 – a full bullish scenario unfolding.
Pessimistic Scenario: Bearish Breakdown Below Support
If price fails to hold $149.14 and sellers take control, we pivot to a short strategy:
Price confirms a breakdown below $146.45, signaling further weakness.
First target: $141.51 – the previous absolute low, critical for buyers to step in.
Second target: New breakdown structure, where price searches for fresh demand zones.
Key Trade Setups Based on Ray Interactions
Bounce Long from $149.14 → Target $155.94: If price interacts with the ray and moving averages turn upward, this trade has strong risk-reward potential.
Breakout Trade Above $155.94 → Target $163.18: Needs clear volume confirmation—watch for aggressive buy-side flows.
Short Below $146.45 → Target $141.51: A clean break and close under this level confirms bearish sentiment.
Every move starts with interaction with a ray, and the price will continue from one ray to the next—that’s the core principle. The market map is set—are you ready to play it?
Your Move – Let’s Talk Trading!
Markets don’t lie—price respects structure, and now you’ve got the map. Check back later to see how price follows these rays and levels—because that’s the key to understanding real trading setups.
Got questions? Drop them in the comments! Let’s discuss the setups, confirm levels, and make sure everyone gets clarity. If this analysis helped you, hit Boost and save it—you’ll want to revisit this as price plays out.
My ray-based strategy maps everything automatically, but it’s available only in Private. If you’re interested in using it, DM me—I’ll explain how to get access.
Need analysis on a specific asset? I can chart anything. Some ideas I post publicly, others we can discuss privately if you want exclusivity. Just let me know what you need.
And if you want more high-precision market breakdowns, follow me here on TradingView—this is where I drop all the insights. Let’s trade smarter together! 🚀

Daily PEPSI Bullish DivergenceBullish div on 1D, ticks all the boxes. Bullish div on MACD-H, EFI, macd lines, ATR price channel divergence, EFI ATR channel divergence, and divergence on Stochastic RSI. Impuls on 1W still read, but upwick bar and also EFI on -3 ATR which seems to be a turning point many times
TP1
157,95
TP2:
161,21
Entry
152,89
Stop loss:
149,33
Scaling out as I see fit. At least 50% on 1 ATR, ultimate target of 2 ATR, previous turning points, could be possible, but a bit far. Planning to scale out other half there, or earlier when I detect weakness.
Trade #00004
Hitrate until #00003:
66% (trade 3 still open, but nearing target )

Looking for a bounce on Pepsi for a nice swing trade! 🔉Sound on!🔉
📣Make sure to watch fullscreen!📣
Thank you as always for watching my videos. I hope that you learned something very educational! Please feel free to like, share, and comment on this post. Remember only risk what you are willing to lose. Trading is very risky but it can change your life!

PEPSI - Bounce TimeThe 200MA in red which I have shown using area shows consistent bull rejections off it on this Weekly timeframe extending way back.
Great time to buy PEP as this 200MA is currently being tested, a buy the dip scenario.

Pepsi Co to test 157$ resistance, what's next?Pepsi co had a steady bull run from March of 2020 to May 2023, where the price doubled in a span of three years after testing it's long term support line in March of 2020 at 100$.
Since May 2023, the price is in a downtrend and even Trump pump did not help it!
Currently price is about to test its short term resistance at 157$. This price coincides with 0.382 fibonacci retracement level. If the price holds there, there might be a chance for Pepsi co to break out of the downtrend and start a bull run.
However, if the resistance does not hold and price fall below 150$, we are probably going to test the long term trend line (green line) which has been a support since market crash of 2009. If that happens, then we will be looking at prices around 130$ per share. This price is retracement level of 0.618 of fibonacci level.

PepsiCo Stock Struggles Amid Weak Revenue and Guidance CutPepsiCo Inc. (NASDAQ: NASDAQ:PEP ) has long been a staple of the food and beverage industry, with a reputation for consistent growth and strong brand recognition. However, recent performance suggests a slowdown in momentum, as both technical indicators and fundamental data point to challenges ahead for the stock.
Declining Revenue and Softened Outlook
On Tuesday, PepsiCo (NASDAQ: NASDAQ:PEP ) reported its fiscal third-quarter results, revealing a mixed performance that failed to meet Wall Street's expectations. The company posted earnings per share of $2.31, narrowly surpassing analyst expectations of $2.29, but its revenue of $23.32 billion fell short of the anticipated $23.76 billion ugh too bad. This marks a 0.6% decline in net sales compared to the same quarter last year.
The revenue shortfall is largely attributed to the impact of product recalls in its Quaker Foods North America division, a key segment of the company’s portfolio. Quaker Foods saw a 13% volume drop following recalls related to salmonella contamination and the subsequent closure of a production facility. The weakening demand in the U.S. market, alongside disruptions in international markets such as Latin America and the Middle East (Tensions between Israel, Iran and Lebanon), exacerbated PepsiCo's woes.
PepsiCo CEO Ramon Laguarta acknowledged the challenges, noting that weaker-than-expected sales, particularly in its snack and beverage divisions, have weighed heavily on the company's outlook. As a result, PepsiCo (NASDAQ: NASDAQ:PEP ) trimmed its full-year organic revenue growth forecast, now expecting only a low-single-digit rise, down from the previous 4% projection.
Moreover, despite some resilience in brands like Gatorade and Pepsi within the North American beverage segment, overall volume declined by 3%, underscoring the broader slowdown in consumer demand. Rising inflation and shifts in consumer behavior have prompted shoppers across various income levels to cut back on discretionary spending, especially on premium products.
Let's check out what the Technical data says
From a technical perspective, PepsiCo’s stock is reflecting the underlying weaknesses in its business. After consolidating within a tight range for much of the year, NASDAQ:PEP has now formed a bearish reversal pattern, signaling the potential for further downside.
As of the latest premarket trading, the stock is down 0.66%, and its technical indicators suggest that more selling pressure may be on the horizon. The relative strength index (RSI) stands at 32.74, inching closer to the oversold territory, which reflects a growing bearish sentiment. An RSI reading below 30 typically indicates that a stock is oversold, but NASDAQ:PEP is dangerously close to crossing that threshold, which could spur a wave of panic selling.
Furthermore, PepsiCo's stock is currently trading below its key moving averages, with the 50-day, 100-day, and 200-day moving averages converging at a critical juncture. When these averages converge and begin to trend downward, it often signals that a stock could face extended bearish momentum. In this case, the bearish crossover suggests that NASDAQ:PEP may experience further downside movement in the near term.
The stock is also hovering near a crucial support level at $158, a pivot point that, if breached, could open the door to a steeper decline. Should NASDAQ:PEP break below this support, it may revisit its recent lows, potentially entering a more prolonged bearish trend.
Conclusion: A Cautious Outlook for PepsiCo Investors
PepsiCo's (NASDAQ: NASDAQ:PEP ) revised guidance for organic revenue growth indicates that management is bracing for slower growth ahead, and this cautious outlook has weighed on investor sentiment.
From a technical standpoint, PepsiCo’s stock appears vulnerable to further declines, with bearish patterns and weak momentum pointing to the possibility of additional downside. The stock's proximity to a critical support level at $158, coupled with a low RSI and downward-trending moving averages, suggests that investors should exercise caution.
PepsiCo (NASDAQ: NASDAQ:PEP ) may face headwinds in the coming months. While the company remains a long-term blue-chip investment, short-term traders and investors should monitor the stock closely for any signs of a reversal, particularly if the stock breaches its key support level. Until the company can demonstrate stronger revenue growth and address its operational challenges, NASDAQ:PEP may continue to underperform relative to market expectations.

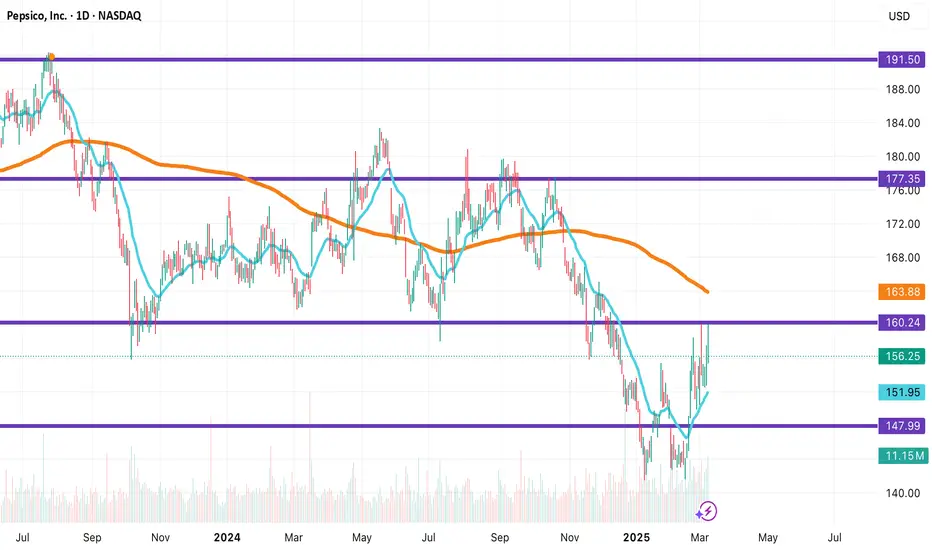
Pepsico (PEP): Breakout or Rebound? Earnings Report IncomingThis week, Pepsico is set to announce its earnings, and we continue to monitor the same pattern that has persisted for a while now.
PepsiCo's recent $1.2 billion acquisition of Siete Foods is a strategic move to expand Frito-Lay's "better-for-you" snack segment. Although the near-term impact on revenue is expected to be minimal, Citi predicts a modest contribution to overall growth. The deal is anticipated to close in 2025, broadening PepsiCo's multicultural portfolio.
From a technical perspective, NASDAQ:PEP is still moving within the established range. We've added zones above and below the range and highlighted each instance when NASDAQ:PEP broke through the range. Except for one occurrence, all these breakouts provided good entry opportunities. The future direction remains uncertain, but the key is whether Pepsico can hold its level upon breaking through the range—it needs to hold to sustain momentum rather than falling back.
For now, we continue to keep a close watch on NASDAQ:PEP and are waiting for this week's earnings report to provide further clarity. ✅

PEP breakout expected , US Stock167.50 above trendline breakout
169 above horizontal resistance breakout possible
172/174/177/180 expected to test

PepsiCo _ Next Target is Triangle Pattern TopPepsiCo is forming a Triangle Pattern. The Next Target is the Top of the Triangle. If it doesn't Breakout above the Triangle Pattern (or) Resistance, the market is Expected to move downward again, anticipating a breakout at the bottom of the triangle. If there is a breakout at the bottom of the triangle, the market Expects a 27% fall. Because PepsiCo has been trading within two parallel lines, or a channel, since 2009. Therefore, if it breakout on the bottom side of the triangle pattern, the market could fall to at least the 0.3 Fibonacci Retracement level. Refer to this below image :
Support me; I want to Help People Make PROFIT all over the "World".

PepsiCo: Analyst Bullish Despite Slowdown, Sees 17% UpsidePepsiCo, the giant in the beverage and snack food industry, is currently under the spotlight as analysts adjust their price targets ahead of its upcoming quarterly earnings report. Amidst varying evaluations, one Wall Street analyst remains notably optimistic about the stock's future, suggesting a significant upside potential.
Banking on Continued Profitability:
Analyst Bryan Spillane of Bank of America Securities remains bullish on PepsiCo despite lowering his price estimate from $210 to $190 per share. Spillane's objective suggests a potential 17.2% increase over the following 12 months, demonstrating significant confidence in PepsiCo's steady profitability and earnings power.
PepsiCo's Financial Resilience:
Spillane acknowledges some concerns regarding soft demand in the food and beverage sector but believes PepsiCo's current valuation is attractive. The company has a solid track record of profitability, supported by its strategic pricing and product placement. Spillane's confidence is further bolstered by PepsiCo's ability to maintain healthy profit margins despite industry challenges.
PepsiCo's Strengths and Opportunities:
PepsiCo has always been a favorite choice for investors due to its diverse product portfolio and consistent dividend payouts. The company's strong presence in both snacks and beverages ensures a steady revenue stream. Presently, PepsiCo offers a dividend yield of over 3%, making it an appealing option for income-focused investors.
Growth Amidst a Slowdown:
Even with recent concerns about a slowdown, PepsiCo's results remain robust. Despite a modest 2.3% sales increase in Q1, this follows years of consistent revenue growth. In 2023, the company's sales increased by 8.7%, with a 10-year CAGR of 3.3%, showcasing PepsiCo's resilience and consistent growth capability.
Pricing Strategies:
PepsiCo's revenue growth has largely been driven by strategic price increases. Despite higher prices potentially affecting volume sales, the company has successfully increased its overall revenue. This approach underscores PepsiCo's strong brand equity and its ability to navigate market dynamics effectively.
Valuation and Dividend Appeal:
Given PepsiCo's current trading price, investors have a valuable opportunity. The price-to-earnings (P/E) ratio of the stock is currently 20.6, which is less than its historical average of 23 to 25. With PepsiCo's astounding record of 52 years of dividend increases, this reduction presents a unique opportunity to purchase shares at a discount in a dependable and rapidly expanding business.
Broader Industry Context:
The non-alcoholic beverage market is evolving, with major brewers like Carlsberg expanding their soft drink portfolios to adapt to changing consumer preferences. Carlsberg's recent acquisition of Britvic, a Pepsi and Lipton distributor, underscores the growing importance of the non-alcoholic segment. This trend reflects a broader industry shift towards diversification and catering to health-conscious consumers.
Strategic Implications:
PepsiCo is well-positioned for future growth thanks to its sustained emphasis on both its core products and smart acquisitions. The company remains an appealing option for investors seeking steady returns due to its robust dividend policy and ability to balance price hikes with volume sales.
Conclusion:
PepsiCo remains a strong contender in the beverage and snack food market, with analysts like Bryan Spillane projecting significant upside potential. Despite a recent slowdown in growth, the company’s strategic pricing, consistent profitability, and attractive valuation present a solid investment opportunity. As PepsiCo prepares to release its second-quarter earnings, investors should closely monitor its performance and consider the long-term benefits of holding PEP stock in their portfolios.

Food & Beverage Titans: Macro Fib SchematicsThe biggest food and beverage companies in the world consist of Nestle, Coca Cola, Pepsi, Unilever, Mondelez, Kraft Heinz, Tyson, and Hormel. These are the main ones but there are other ones as well. I have linked the rest in my other idea below. While it does not cover every single company in the group, it highlights the Main Titans of the sector.
I have shown their main products showing why they are the Titans dominating grocery stores. Especially thing like Pepsi and Coca Cola. Just for example, people do not know that they own many other brands and companies themselves.

PepsiCo, Inc. 🥤Daily chart with the ichimoku indicator.
Price below the simple 200-day average.
Cloud twist very close, caution is advised.
Make up your mind.

PepsiCo: 3 Line Strike at the PCZ of a Bearish GartleyPepsiCo has confirmed a 3 Line Strike on the Daily at the PCZ of a Bearish Gartley with Bearish PPO confirmation, which I think will result in PepsiCo making at least an 88.6% retrace.
