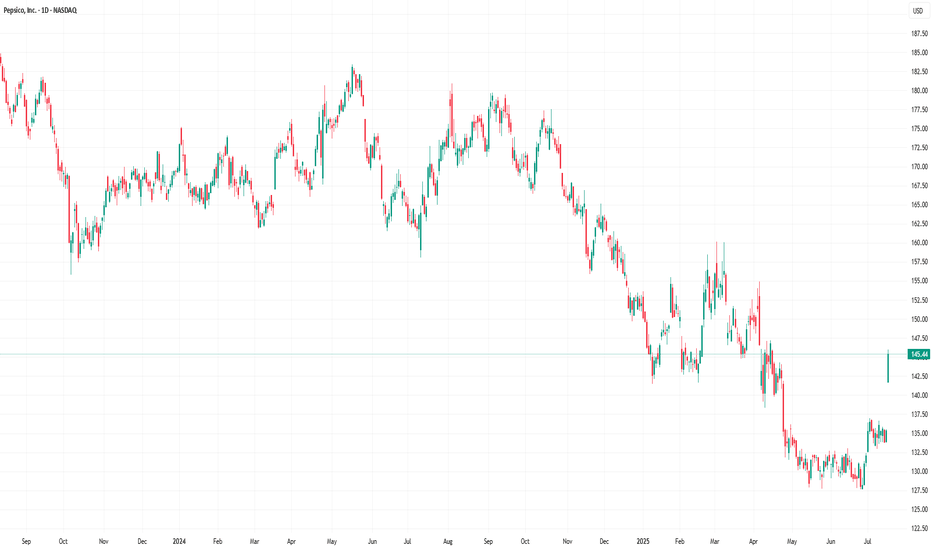
PepsiCo (PEP) Stock Rallies 7.4% Following Earnings ReportPepsiCo (PEP) Stock Rallies 7.4% Following Earnings Report – What Comes Next?
Yesterday, PepsiCo Inc. (PEP) released its quarterly earnings report, which significantly exceeded market expectations:
→ Earnings per share (EPS) came in at $2.12, surpassing the forecast of $2.02.
→ Gross revenue reached $22.7 billion, above the projected $22.3 billion.
In addition, PepsiCo reaffirmed its full-year guidance: the company expects earnings per share to remain virtually unchanged compared to the previous year, while organic revenue is anticipated to grow by a few percentage points.
Executives also outlined development plans for their brand portfolio, emphasising a focus on the growing demand for healthier snacks and a strategic initiative to reduce costs.
These factors contributed to PepsiCo Inc. (PEP) becoming one of the top-performing stocks on the market yesterday – its price surged by 7.4%, reflecting strong investor sentiment. What could come next?
Technical Analysis of PEP Stock Chart
A strong bullish candle formed on the chart yesterday, signalling a spike in demand:
→ The session opened with an impressive bullish gap, decisively breaking through the July resistance level around $137.
→ The share price continued to climb steadily throughout the day, forming a long-bodied candle.
→ The session closed near its high, confirming sustained upward momentum.
Notably, on 27 June (highlighted by an arrow on the chart), the stock posted gains on the highest trading volume of 2025 so far (according to Nasdaq data), which can be interpreted as a potential sign of sentiment reversal driven by institutional investors.
However, the broader picture remains bearish. PEP stock continues to trade within a long-term downward channel, shaped by declining demand for PepsiCo products and intensifying market competition.
Given the above, the following scenario should not be ruled out: the upper boundary of the long-term descending channel may act as resistance in the near term. As the post-earnings euphoria fades, the price could undergo a pullback – for instance, towards the $140 level, which previously served as support.
At the same time, the strong fundamental backdrop, reflecting the company’s operational success, could fuel persistent bullish interest. This may empower buyers to challenge and potentially break the long-standing downtrend in PEP shares.
This article represents the opinion of the Companies operating under the FXOpen brand only. It is not to be construed as an offer, solicitation, or recommendation with respect to products and services provided by the Companies operating under the FXOpen brand, nor is it to be considered financial advice.
Pepsicosignals
PepsiCo _ Next Target is Triangle Pattern TopPepsiCo is forming a Triangle Pattern. The Next Target is the Top of the Triangle. If it doesn't Breakout above the Triangle Pattern (or) Resistance, the market is Expected to move downward again, anticipating a breakout at the bottom of the triangle. If there is a breakout at the bottom of the triangle, the market Expects a 27% fall. Because PepsiCo has been trading within two parallel lines, or a channel, since 2009. Therefore, if it breakout on the bottom side of the triangle pattern, the market could fall to at least the 0.3 Fibonacci Retracement level. Refer to this below image :
Support me; I want to Help People Make PROFIT all over the "World".
PEPSICO Testing Lower Highs. Strong buy if broken.Pepsico Inc (PEP) has been trading within a Channel Up pattern for more than 1 year. Currently it has been rejected on the internal Lower Highs trend-line from the May 15 High. As you can see within this Channel Up, every time the price tested such Lower Highs (3 occasions), it had an initial rejection (twice to the 1D MA50 (blue trend-line)) and then broke out. On all occasions, it hit the dotted Higher Highs trend-line, just below the top of the Channel Up. The 1D RSI is on a similar pattern with all those past fractals.
As a result, we will be ready to buy after it breaks above the Lower Highs and target the dotted trend-line at 200.00.
-------------------------------------------------------------------------------
** Please LIKE 👍, FOLLOW ✅, SHARE 🙌 and COMMENT ✍ if you enjoy this idea! Also share your ideas and charts in the comments section below! **
-------------------------------------------------------------------------------
💸💸💸💸💸💸
👇 👇 👇 👇 👇 👇


