LUNA Retracement LONGAfter an extended rally, we expect retracement of LUNA down to the lower support zones around 77.85 to 72 areas, where we look to BUY or LONG.
This rebigion is also the confluence of the 0.5 Fib level + previous resistance flipped to support @ 76.5 + 200 EMA.
The overlap of these zones will likely give strong support for REBOUND from here.
Buy zone : 72 - 77
SL 64.6
TP 103.2 (ATH)
Perp

BIG ACCUMULATION ON EOS - Triangle breakout soon!Huge squeezing into a triangle formation for EOS,
bullish divergence on MACD
Big buy volume spikes, much weaker sell volume
Target next major resistance at 3.77
SL 2.995
RR 2.65 very favorable

Long OKB for Full cup and Handle Pattern OKB has full formed a curve for the cup pattern, retesting previous resistance as support near the 29.9-30 levels.
Now we use the fib levels to extend for a TP target at 1.618 level at 39.39
We draw the full depth of the cup pattern and extend it above to coincide with the 1.618 level
Volumes also show buyers trying to break the 33 resistance level, with at least 6 touches already on the 1H
MACD crossing over to upside with momentum.
TP 39.397
SL 20.0895
Very favorable RR 2.56

Nice Demand zone on PERP, 1:3 trade ideaI think we could bounce off the previous POC,
we are trading at the level from wich we run up massively the first time.
let's see if we run up again

PERPUSDT Daily TimeframeSNIPER STRATEGY (new version)
It works ALMOST ON ANY CHART.
It produces Weak, Medium and Strong signals based on consisting elements.
NOT ALL TARGETS CAN BE ACHIEVED, let's make that clear.
TARGETS OR ENTRY PRICES ARE STRONG SUPPORT AND RESISTANCE LEVELS SO THEY CAN ACT LIKE PIVOT POINTS AND REVERSE THE WAVE (or act like a mirror that can reflects light) BASED ON STRENGTH OF THAT LEVEL.
ENTRY PRICE BLACK COLOR
MOST PROBABLE SCENARIOS TARGETS GREEN COLOR
LEAST PROBABLE SCENARIOS TARGETS RED COLOR
TARGETS ARE NOT EXACT NUMBERS THEY ARE MORE LIKE A ZONE.
DO NOT USE THIS STROTEGY FOR LEVERAGED TRADING.
It will not give you the whole wave like any other strategy out there but it will give you a huge part of the wave.
The BEST TIMEFRAMES for this strategy are Daily, Weekly and Monthly however it can work on any timeframe.
Consider those points and you will have a huge advantage in the market.
There is a lot more about this strategy.
It can predict possible target and also give you almost exact buy or sell time on the spot.
I am developing it even more so stay tuned and start to follow me for more signals and forecasts.
START BELIEVING AND GOOD LUCK
HADIMOZAYAN


MER-PERP (get MAX SHORT) Positionit looks like the measures are starting to deflate, I think the fall will reach 0.15$, you can go short with the maximum leverage.
I closed all deals on it at a small loss. I think the short will fight off the losses.

PERP is reaching important supply zone at 18.00I think 18 is a good target price or at least a level where you can take a partial.
If we reach the 18.00 zone I think we could pullback in the 10.00 zone for more demand

FLMUSDTPERP Long Idea 4HrAlt that has not had the same upward move as some of the majors. Looking at possible ranges to breakout of.

PERP descending trianglePERP in descending triangle, now above 200SMA and below 20SMA, also right above the support level. Expecting possible bounce up to open long trade. That position between 200 and 20SMA could be tricky for entry, price often bounces up and down from them before descision. SRSI RSI and MACD on 1hr chart look like it could go up. Could have a nice move, but you should be aware that it has a death cross printed on MACD 12hr chart, so this could be short-term trade or scalp trade only (if long). If this support is lost we could enter a short trade, breaking under 200SMA is usually a nice chance for short trade... GL traders... Needless to say that BTC could have an impact on this trade...

PERP falling wedge breakout?Falling wedge printed, wants to breakout, looks bullish on 1hr chart. Got some volume increased in the last candle... Bounced from the support level at 13.54 that was already established earlier... BTC dump could ruin this. Good luck traders

Perpetual Protocol HODL Longjust some fun for some BanklessDAO Fam!! #Markets
Here we have PERP Daily time frame. Elliot Wavers will understand that this broke the previous 1 wave of 5, signaling that the 5 wave identified is the end of the 5 wave and we have been correcting ever since. Hit the Golden Pocket. Low Market cap tokens often are a little messy in hitting their algo targets. If this low holds i will be looking for a 1 to 1 fib extension (100x+) with some take profit along the way and HODLing some for the 1.618 fib extension.
The pitch fork is added confluence and if you redraw a new pitchfork from the bottom of the 5 wave to the top of the 5 wave and down to the low, you may realize that a 50x move to the red median line is an 80% probablility with very close stop loss.
that being said if bitcoin takes off and leaves alt coins behind one could expect to find support and a great buy opportunity at historic lows. for sure i will try to catch a wick down there.
So if you are bullish on DEFI and check out the exchange and like it, well it looks like an opportunity to me to have fun. this is of course not financial advice.

DYDX & PERP - Narrative and fundamentalsAll over the world we have regulators attacking crypto. Slowly, but surely... More and more exchanges having mandatory KYC , shutting down derivative products for certain countries, closing down registrations and trading for certain countries, as well as having issues maintaining and launching new products. China has essentially completed and finalized its crackdown, but US is coming next and will probably go after certain exchanges like Binance the same way they went after Bitmex (big fines and prison time).
Crypto is going against the state's interests and this was to be expected. That's why DeFi is so big and why decentralization really matters. Currently there are two major tokens related to 2 perpetual swap protocols which have been growing for some time. DYDX is the first one and launched its token fairly recently, while PERP is the other one and has been out there for some time. DYDX is at about 900M and PERP at about 800M, however DYDX is looking a lot better for many reasons.
First of all DYDX has a much cleaner chart and is a much younger coin. It's making new highs vs BTC and is near ATHs vs USD, while PERP is looking more heavy. Now for this there are some fundamental reasons as to why things look that way, and that's because DYDX just over the last week has had 11x higher revenue compared to PERP. DYDX also has a few more listings and is a bit more liquid, so currently either DYDX is undervalued or PERP overvalued.
In my opinion based on PERP's chart I think it could grow more and I don't think its valuation is that extreme. There is potential for both of them to grow as people might want to have a backup in case something happens to one of them. Both have had some major upgrades recently and have been doing pretty well, and in my opinion could continue to grow rapidly as Ethereum's scaling technologies could grow really fast as well. However the key takeaway here based on the current set of circumstances + the rapid growth + the relative valuations based on the current revenue, is that DYDX is undervalued and its price could appreciate a lot.
Finally I'd just like to point out that there are big risks for both of those. On chain derivatives trading isn't simple and we all know how easy it is for a DeFi protocol to get hacked... So be careful with the amount of money you put in either of those and remember that there are no certainties here.

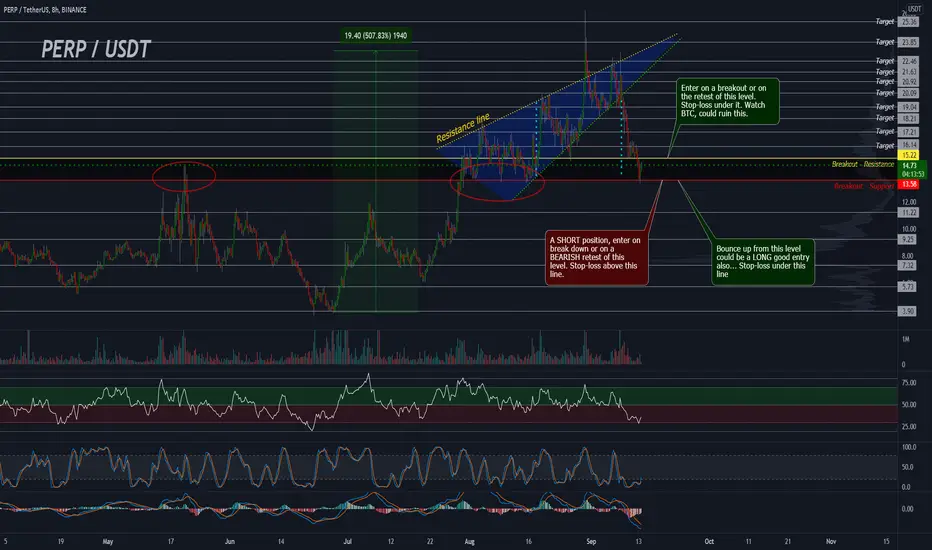
PERP USDT: 8Hr timeframe, end of correction?8hr timeframe had an amazing run-up of 500% + since the start of Jul... In rising wedge since the start of Aug.
Now pulled back almost exactly to the measured move of break down from this wedge, and that is also the big support level which was tested multiple times in the first half of Aug...
If that support is lost, we could see a massive selloff, but also if it holds and BTC doesn't crash over our heads, we have a good chance to see some nice upside movement...
We could expect a golden cross on MACD and already got one on SRSI, RSI looks ok, but on a shorter timeframe it's already high, and maybe one more retest of that support level is possible before attempting break of this next resistance level...
BAKE - 10x long trade setupBAKE 10x long trade setup:
Entry: 2.02
T1: 2.08
T2: 2.14
T3: 2.20
Stop: 1hr candle close below 1.96

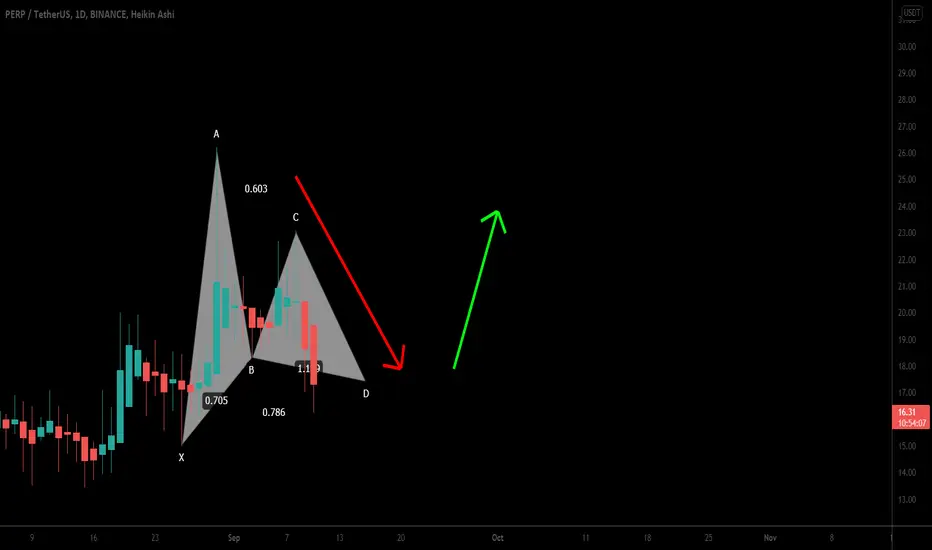
Perpetual Protocol (PERP) formed Gartley for upto 61.5% big moveHi dear friends, hope you are well and welcome to the new trade setup of Perpetual Protocol (PERP).
Previously we had a nice trade of PERP:
Now on a daily time frame chart, PERP has formed bullish Gartley.
CTK - Long 20x trade setupCTK is making another push here. Resistance at 2.90, but I believe it will get by this time.
Mt CTK Long 20x trade setup:
CTK Long 20x
Entry: 2.88
T1: 2.938
T2: 2.996
T3: 3.053
Stop: 1hr candle close below 2.821


perp/usdttarget 1 & 2 were hit in a few hours !
and in less than two days , it achieved more than 50% profit

Perpetual Protocol (PERP) formed Cypher for upto 13.5% moveHi dear friends, hope you are well and welcome to the new trade setup of Perpetual Protocol (PERP).
Previously we had a nice trade of Protocol (PERP):
Now on a 4-hourly time frame chart, the Perp has formed a bullish Cypher pattern.

ADAUSDTPERPADAUSDTPERP IN DAILY time frame
Trade ON Daily CANDLE ON 19 AUG .. on candle node .
3 Node Level
target upside last daily candle

TrendTracers Weekly Market Analysis #11tl:dr
Small correction across the markets in the short term, followed by sideways bitcoin and ethereum, other alts should start gaining strength when this range is being formed.
Review of last weeks TA
BTC hit our target from last week between 45k and 47k. So did ETH. The markets seem topped out for now as predicted.
BTC
We expect some sideways consolidation near the resistance depicted in the chart. From a bullish perspective, after consolidation for a period of time, a move to the highs of April seems possible. The bearish scenario is where btc tests around previous lows for maximum pain around 28k. It might even go lower to sweep liquidity.
During this consolidation we expect an alt season. So now we look at BTC.D which
seems to be heading to the lows of the range again around 40%, supporting our theory for another alt season. Because when BTC.D is moving down money is flowing out of BTC and into altcoins.
ETH
Ethereum is at resistance depicted on the chart. We don’t expect a massive bullrun from here instead some consolidation seems more likely because of Bitcoin. However there is a bull flag pattern forming on the ETH-BTC Daily chart which will play most likely play out coming days. This is one to keep an eye on.
THE PERPS
Midperp and shitperp reacted from a nice bottom pattern. After a small correction at the start of Bitcoins consolidation we expect shitcoins and midcap coins to make a significant move to the upside.
So we expect a pullback in the coming days to get in our positions. And then ride them up into the next resistance.

Perpetual Protocol (PERP) with USD formed Shark for upto 12.50%Hi friends, hope you are well and welcome to the new update on Perpetual Protocol (PERP) with US Dollar pair.
On the 2-hourly time frame chart, the priceline of PERP with USD has formed a bullish Shark.
