DJI SHORT POSITION Its look great to short here because we have some confirmation so enjoy it the rising channel have been breakdown and the RSI is making bearish divergence
Perpetual

BTC Buy limitHello Traders!
Welcome Back to another episode with Analyst Aadil1000x.
I just saw that there is a strong reversal point in BTC before our Final target so we will close 100% of the short trade at 16680 and we will set the buy limit at 16583.
There is A1000x True reversal point in BTC at 16583 and we will buy BTC from there with tight stop loss.
16583 BTC Buy Limit
Stoploss 16484(-0.6%)
Target 1, 16845(+1.75%)
Final Target 17336(+4.57%)
Don't forget to hit the like button and follow to stay connected

Filusdt: Buy timeHello Traders!
Welcome back to another episode with Analyst Aadil1000x.
We are Buying FIL from the True reversal point with tight stoploss.
FIL Buy now
Stoploss 4.322(-0.7%)
Target 1, 4.415(+1.5%)
Final Target 4.49(+3.15%)
Don't forget to hit the like button and follow to stay connected.

ANKR Strong supportHello traders!
Welcome back to another episode with Analyst Aadil1000x.
Today we are buying ANKR from the key support area with tight stoploss.
0.02055 ANKR Buy limit
Stoploss 0.02042(-0.6%)
Target 1, 0.02089 (+1.66+)
Final Target 0.02124(+3.4%)
Don't forget to hit the like button and follow to stay connected.

Neousdt shorting from A1000x TR pointHello traders!
Welcome back to another episode with analyst Aadil1000x.
Today we are shorting another pair. This time we are shorting Neousdt from A1000x True reversal point.
NEO Sell limit 7.673
Stoploss 7.825(-2%)
Target 1, 7.482(+2.6%)
Final Target 7.08(7.7%)
Don't forget to hit the like button and follow to stay connected

APE A1000x True reversal pointHello traders!
Welcome back to another episode with analyst Aadil1000x.
Today we are selling APE from 3.99 A1000x True reversal point for a good profit.
Sell limit 3.99
Stoploss 4.073(-2%)
Target 1, 3.87(+3%)
Final Target 3.626(+9%)
Don't forget to hit the like button and follow to stay connected

Wait for confirmation first! ✨I think this is a very interesting moment for this coin as it approaches a very important resistance level. However, it's no clear yet if it could break through it or reverse altogether so here are 2 tips. If it breaks through, wait for the retest to enter and set target a little bit below resistance level as it could react fast to it and drop fast once it reaches. Another scenario could be it actually break the upper channel it's making and if it does wait for the breakout once you have it, wait for the re-test of this breakout and then enter the trade lower. Always wait for confirmation to be safe. Target for down is previous resistance turned into support.

Bandusdt: Sell for Infinity fallHello traders!
Welcome back to another episode with Analyst Aadil1000x.
Today we are going to sell BANDusdt because of the inverse Head and Shoulder Pattern.
Stoploss 1.0978(-4%)
Target 1, 0.9922(+6%)
Final Target, Let it run

A Buy Entry Levels of Ethereum/USDT Pair Hello Guys You All!
Here Is the Draw Level of eth/usdt perp pair. I analyzed that a little reversal possible at draws level. but this isn't not confirmed for long only depend on this level. We need more confirmations at this level like, candlestick behavior or pattern or Price momentum with a help of indicators.. So we need to patience for a good entry on long side.
Hope So You All like analysis. If wrong in analysis please give comment for correction

$BTC | We are going lowerThe dead cat bounce was retraced last week along with all other markets and hit the trend line nicely. If we break the support zone highlighted (which is a major leve) the next stop is around the $16,000 area (which isn't a strong level at all) and then $11,000. We haven't cleared any trend line and have respected the 50 EMA for over 5 months now.
For investors, this is fantastic news. For traders and who are shorting, this is fantastic news.

Dogeusdt Swing Trade DOGEUSDT ⏱ Daily 1D chart
It has a positive harmonic pattern, provided that it does not close on a daily basis, below 0.06284, and the target is 0.07400 .

Perpetual Protocol (PERP) formed Gartley for upto 16% pumpHi dear friends, hope you are well and welcome to the new trade setup of Perpetual Protocol (PERP) with US Dollar pair.
Previously we had a nice trade of PERP with BTC pair.
Now on a 4-hour time frame, 1INCH has fored a bullish Gartley pattern:
Note: Above idea is for educational purpose only. It is advised to diversify and strictly follow the stop loss, and don't get stuck with trade

Perpetual PERPUSDT - Record volume! + Elliott wave + Wedge!- If we take a look at the volume indicator, we can clearly see a massive bullish volume spike, which is definitely a good sign!
- On the weekly scale, we can see a falling wedge that is currently breaking out!
- As per my Elliott wave technical analysis - the huge impulse wave (12345) should be completed, as you can see.
- On the RSI indicator, there is a bullish divergence - wonderful sign of a trend reversal.
- Profit target: 0.618 FIB + start of the wave 5 for 700% profit.
- Look at my ideas about another interesting altcoins in the related section down below ↓
- For more ideas please hit "Like" & "Follow"!


Short Sol till $4Sol is gonna hit that Monthly FVG, price ranging around $5-$4 and can even go beyond that.
There might be some retracement before it goes further down, know when to put your trade setup.

tetherus perp looking like its headed for some final harmonicperpetuals for usdt look logarithmically like some harmonic pattern is completing, and that sell volume will lead to a spike in rsi, along with retesting trama and vwma levels.

BNXUSDT PERPETUALBINANCE:BNXUSDTPERP
BNXUSDTPERP Looking for Breakout here.
Bullish if breakout confirmed📈
Don't forget to set your trade with SL. 🙌

This channel is STILL working and keeping me SAFE I was hesitant last week to share this and wasn't sure enough about this working for longer time frames. BUT as you can see this has been really good for me the last 2 weeks. Same with this morning as my reference to keep my mind LEVEL and stay away from emotions and Drama. I HOPE it can help someone else make and KEEP what gren they see in these times of #BearMarkets and #Winter ... Trade safely Hustlers ... Ive used THIS channel to reference OTHER things im trading and its been CRAZY accurate even for other charts when im not sure about a move or breakout i go back and see what ADA on this chart is doing ( 1 tab click away) and its SAVED me several times this last two weeks from making BAD emotional and or #fomo moves. Until further notice its STILL helping .

BTC 20k-18khi, we´re waiting for that falling price at the short time, that´s my Elliott waves countdown, greetings

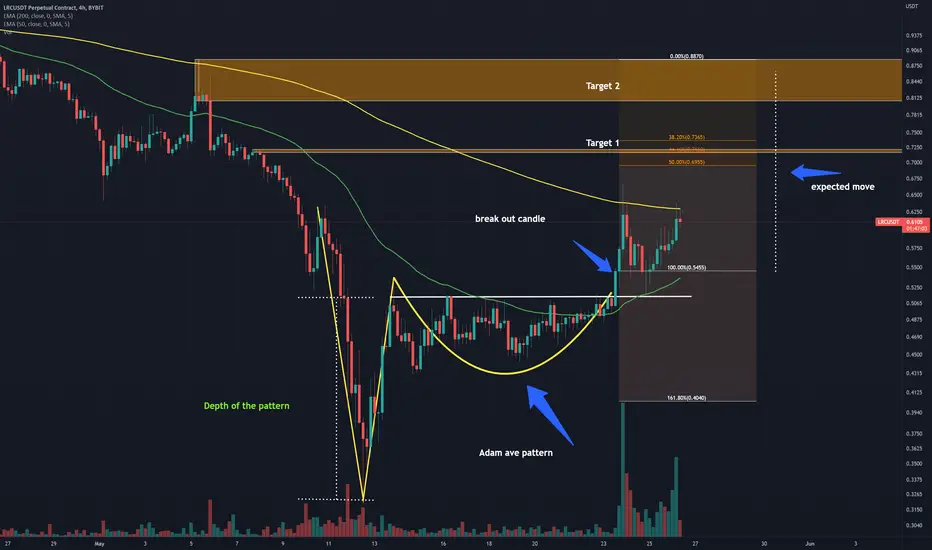
LRC/USDT Adam and Eve PatternLRC/USDT has formed an Adam and Eve pattern. LRC has broken the neck neckline @ $0.51 cents and has retested it before making a move to the upside. Volume is increasing and price action is currently testing the 200 EMA.
Potential move is 61% from the break of the neckline (as indicated on the chart).
TP1: $0.71 -$0.72
TP2: $0.80 - 0.88
Hope you have enjoyed this analysis. Remember nothing is 100% accurate even if you do see this pattern play out. always follow the price action and let the price tell you where the market is heading. Good luck
<<<>>>>>>>>>>
let's take a look at #ftm herethere is a long-term trend line that it's been broken already, I just marked the possible targets for the #short #position on the chart but be careful there's no confirmation yet,we still have to wait for it to see what will happen.

Perp 1h ShortSetup: There is huge rejection off the POC in the 1h timeframe signified by the large volume candle. This looks real bearish for Perp. Furthermore, Perp is also on a long term downtrend, adding confluence to the trade. For extra confirmation, we will like to see it consolidate before breaking down.
Entry: Breakdown trade( 1 ATR below the weekly lows) at 1.02
Exit: Trail using the SAR indicator

Trxusdti seen a good bullish momentum on tron and seems like a triangle on 15 timeframe so i trade with R/R 1:4 trade and share it with you
hope you enjoy trading
don't invest more than 5% of your balance
like it if u agree or trade with me
