Dis-Chem Bullish SentimentThe skills and knowledge we apply in currencies can also be applied in any other market, how so?, as long as there is a chart, technical analysis can be used to predict and/or determine future movements, along with fundamentals and economic events.
Here is a possible investment opportunity for those interested in owning shares.
Good Luck ;)
Pharmaceuticals

Syros Pharmaceuticals may be ripe for a day tradeSyros Pharmaceuticals made a big move up this morning, but has retraced to support at 7.08 (not reflected on the chart yet for some reason). It may bounce higher later today.

Arvinas Pharmaceuticals likely to reach 25.60Arvinas Pharmaceuticals is on a run thanks to FDA approval of phase 1 clinical trials on a new drug. It's above critical resistance levels and appears to have clearance up to 25.60.
Personally I won't be taking a position in this one, though. Arvinas's earnings are pretty garbage, and honestly a phase 1 clinical trial doesn't mean much in this industry.
We've also got a Democratic debate coming up, so I've exited all my positions in pharmaceuticals and healthcare lest they take a hit due to rhetoric about universal healthcare or drug price controls. There's lots of litigation around the ACA right now that provides additional risk. I'm not sure how this fight will play out or how markets would react to the various outcomes.

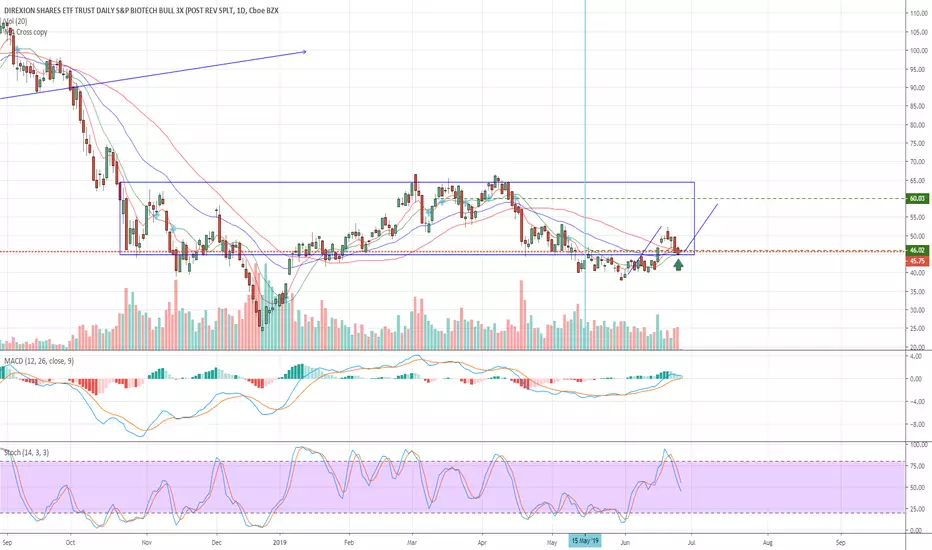
LABU Long ideaIt sounds like the trade war between USA and China is about to get resolved. IF it does I expect a move higher for the markets. With LABU sitting on lower support, it should be a short term low risk BUY.
ITCI bullish call activity and insider buyingITCI is moving mostly horizontally lately, and there's definite room for downside to its channel bottom around 10.40, so this is a risky play. However, a large stock purchase a couple days ago by one of the board of directors triggered a large volume of bullish option activity. Possibly the director purchased stock in anticipation of forthcoming clinical trial results that he expects to be positive. Watch this one closely and look for an opportunity to buy nearer the channel bottom. Alternatively, wait for upside channel breakout.
ITCI has generally poor analyst ratings and negative earnings. However, it's made progress toward profitability and generally delivered earnings beats in recent quarters. It next reports on August 6.

Pieris Pharmaceuticals upward channelPieris is in an upward channel and looking bullish. Analyst ratings on the stocks aren't great, but Zacks has given it a HUGE Earnings Surprise Prediction (13.25%!), which should help the stock continue its run until the next report date in early August. Be aware, however, that it is approaching some stiff resistance above $4.60. It should rise Monday, but then it may go horizontal for a while until the channel pushes it upward.

Buy ICPT at this multiple support - 8:1 reward to risk ratioPattern: $84-$90 support has proven itself a multiple times. Stock is in a medium term consolidation pattern between $85 to $130 range.
Edge: Buying so close to or right at support gives us a great reward to risk ratio. If the stock breaks below support, we are stopped out for a small loss, but if support is protected again, we have more higher upside.
Risk Management:
Bought at $87
Stop Loss = $84
Profit target 1 = $113
Profit target 2 = $130
Profit target 3 = open
Risking $3 to make at least $26 for PT1. That's over 8:1 ratio for just PT1!


BIOMARIN - GOOD BUY OPPORTUNITYToday we gonna look at the pharmaceutical company, as a potential new giant trend on the stock market. NASDAQ:BMRN laying on the strong support line near $87.87 and can move up suddenly. My recommendation:
1. Buy now around 87.87
2. Take profit: 109.45
3. SL: 78.68
Risk/Reward - 2.39, potential profit - 24,6%

BLUEBIRD BIO INC - AWESOME TIME TO LONG THIS STORYAnother pharma company - with amazing correct Elliot 5 waves which you can try to ride.
1. Buy 131.32
2. Take profit: 213
3. SL: 115.90
RISK/REWARD: 5.38, potential profit 62.39%

Long If The Pattern ContinuesHere we can see that for the past INTERCEPT PHARMACEUTICALS INC has been finding support at around in around $87, which has been confirmed 5 times, and a resistance of about $116-$120, which is a little less defined but just looking at the chart, it is there. Once the pattern proves itself that price action is going bull up to support, that's when I will go long. But for now we wait, anything could happen. Also looking at the chart, we see every single time earnings come out within this pattern, price action goes bull, and very quickly.
Thumbs up if you like my ideas

Bullish Inverted H&S Potentialtarget 1: $3.70 - 3.94
lets see how the next 2 weeks play out (some time around 4/24/2019)

CVS Health Corporation stock sell opportunities CVS Health Corporation is american stock pharmacy operator offering nice sell opportunities at new supply imbalances created on both the weekly and the monthly timeframes with everything pointing down in a clear downtrend with new supply levels being created and demand levels being eliminated. Strong imbalances created on the way down.Two new supply levels have been created on the monthly and weekly charts. Monthly supply imbalances is located around $64 per share and weekly supply imbalance is around $65 per share.
As supply and demand traders, we do not need to pay attention to the news, fundamentals or any earnings reports. Once a big timeframe imbalance has gained control, earnings do just the opposite and reacts strongly to those imbalances. Why is it that you see positive earnings and then the underlying stock drops like a rock, or a negative earnings announcement and the stock rallies like a rocket out of control? You are probably missing the fact that there are big imbalances gaining control.Unless you are doing very short term trading and scalping, you should not worry about fundamentals or earnings announcements. You can use these imbalances to plan your trades in lower timeframes.
Trading is just waiting for the right trigger points and scenarios to present themselves, this game has got a name and it’s called the waiting game. We need to patiently wait for the correct scenarios and setups to happen and wait for price to pullback or dip into the price levels we want to trade, in our case supply and demand imbalances. There are several ways of buying stocks. When trading stocks, you can buy shares of the underlying stock or use options strategies to go long or short at these specific supply and demand levels, long calls or long puts or spreads. You can even buy a CFD (contracts for difference) if you are in a country where it’s allowed.If you still want to take earnings into account, it has not been good for CVS Health Corporation lately, read below some of this fundamental analysis...In a note to investors previewing the healthcare services sector's first quarter, analyst David MacDonald said he expects a challenging year for the Woonsocket, Rhode Island-based company, but pointed to "a unique collection of assets." He said he expected CVS's first-quarter results to reflect a handful of challenges, including reimbursement pressure, fewer generics, lower brand inflation."While 2019 is expected to be difficult," MacDonald wrote, "we remain positive on CVS' underlying value proposition tied to its integrated pharmacy/medical benefits, unique set of assets, meaningful patient touch points, and strong clinical programs, and view the company as well positioned to bend the cost curve over time.Can you really make sense out of those statements? I just can't. That's a very thick layer of complexity you would be adding to your trading plan. We have to make easier and faster decisions that don't lean on suppositions or forecasts based on X and Y fundamentals data. Everything is pointing down, so short bias.
Some information about CVS Health CorporationCVS Health Corporation provides health services and plans in the United States. Its Pharmacy Services segment offers pharmacy benefit management solutions, such as plan design and administration, formulary management, retail pharmacy network management, mail order pharmacy, specialty pharmacy and infusion, Medicare Part D, clinical, disease management, and medical spend management services. The company's Retail/LTC segment sells prescription drugs and general merchandise, such as over-the-counter drugs, beauty products, cosmetics, and personal care products, as well as provides health care services through its MinuteClinic walk-in medical clinics. Its Health Care Benefits segment offers traditional, voluntary, and consumer-directed health insurance products and related services, including medical, pharmacy, dental, behavioral health, medical management, Medicare plans, PDPs, Medicaid health care management services, workers' compensation administrative services, and health information technology products and services.

Biogen Inc: Rare Long-Term Buy Opportunity.Biogen has lost over 30% of its value this month. Looking at the monthly chart, we have concluded that this is a rare investment opportunity as the current price is just above its 1M Support Zone.
Historically we see that such an aggressive sell off recently took place in 2015 - 2016 and again the stock managed to recover almost reaching the 390 Resistance again. This pattern may be similar to the one the long term (~10 year) consolidation that took place after the 2000 peak. The price then traded sideways roughly within 17.00 - 71.00, providing a buy opportunity on every major pull back.
We believe such an opportunity is presented now. Every dip near the 180 - 205 Support Zone can be bought with 350 - 390 as the Target Zone.
** If you like our free content follow our profile (www.tradingview.com) to get more daily ideas. **
Comments and likes are greatly appreciated.

Canopy GC: High return long term investment.Canopy Growth Corporation is on strong long term bullish price action both on 1W (RSI = 58.856, MACD = 4.873, Highs/Lows = 2.6189) and 1M (RSI = 66.122, MACD = 12.099, Highs/Lows = 7.3414). Since mid 2017 in particular, it has been trading on Higher Lows reaching +1000% in growth. Using the Pitchfork to identify the pressure zone, we estimate that the asset is close close to a bullish accumulation point (Higher Low). Out moderate Higher High target is 110.00.
** If you like our free content follow our profile (www.tradingview.com) to get more daily ideas. **
Comments and likes are greatly appreciated.

ABBV consolidating with gap to fill higherWatching for ABBV to break this wedge and go higher to fill the gap from earnings.

Are ASPEN's Woes Nearly Over?Aspen is a global supplier and manufacturer of branded and generic pharmaceutical products as well as infant nutritionals and consumer healthcare products in selected territories.
ASPEN has been under the microscope over the past few years with various negative rumors and investigations driving the share price lower and lower. I believe that we haven't quite seen the bottom yet but that there is a possibility of strength to come soon. Perhaps a take over is what they need?
Technicals
The corrective structure has seen a break of the 61.8% Fib retracement level and is currently trading below it. I am expecting to see wave 3 end at the 78.6% level. In my opinion, it is likely that there will be a rally from that point onwards and that the structure will break to the upside. A larger retracement than that would indicate serious repercussions for ASPEN and I am certain that they will do everything in their power to avert a further decline in share price.


Long in NVO Established There are several aspects to this chart- the wave analysis is certainly up for debate, but what remains is improving fundamentals.
On this chart we have a corrective sequence ABC starting in 2014 and concluding in early 2017. On this chart, we can see the 30 day MA volume skyrockets in the beginning of 2017. This corresponds to the timing of the Obama administration focusing their healthcare attacks on big pharma, specifically drug pricing. We can even see a faint busted head and shoulders on this chart, with the right shoulder being broken by terrible guidance on earnings
At the peak in 2015, we also see a peak in operating profit margin. Over the next 12 month fundamentals began to draw back with book value/share, liquidity ratios, and margins all slowly declining. As Obamacare got pushed through US congress (where over 50% of revenue is earned), the outlook looked bleak. Then the Man who lives above the Guchi Store was elected, and big pharma saw hope on the horizon and began surging higher. This was a false bull market though; margins and liquidity ratios were not improving for NVO.
Then the surprise happened, President Trump began attacking pharma. Combined with the already volatile stock market NVO plunged to a correction right at the .618 fibonnaci level, if it maintains this as the low a perfect sign that the 2 impulse wave has just completed.
Where we stand now:
Novo Nordisk, one of the largest pill pushers was forced to lower outlooks with increasing competition from generics. With this pressure, the company has been forced to cut many US jobs and refocus R&D spending, rendering some patents and research useless. Over the last few years they've been forced to impair assets for use on their income statement, but NVO still maintains a 2.29 P/Tangible Book ratio, (better than peers: GSK, BMY, LLY). Gross margins have begun improving and P/S has landed at one of the lowest, if not the lowest level in the peer group. Improvement on the liquidity measures could send this stock flying, but most importantly is the deadlock that could ensue in congress. Recently one of the up-and-coming generics plunged as the FDA put a hold on their diabetes drug trial.
I took a long position in NVO on 11/27 and plan on holding this until I either get stopped out at 44 or we rally to previous highs

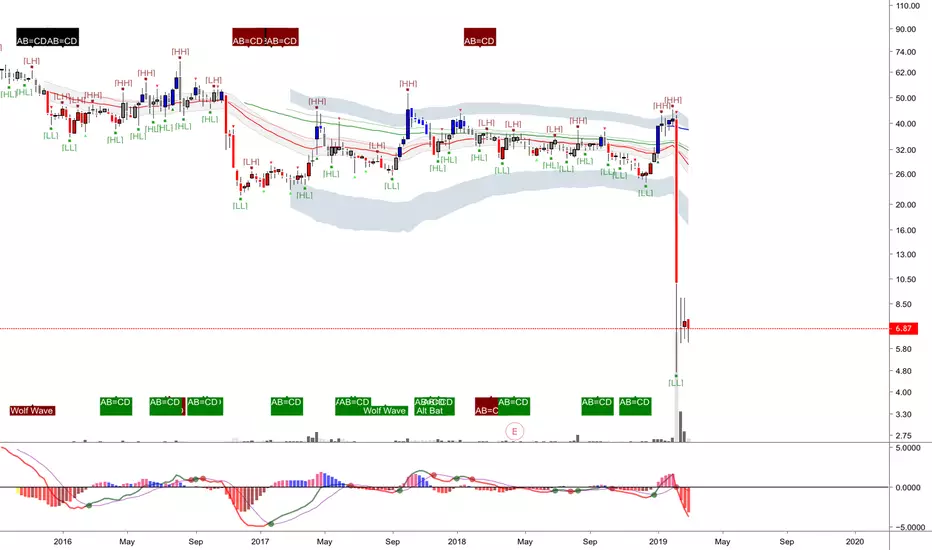
Loxo - Bull pennant and upcoming eventsThis is the weekly chart on Loxo Oncology. This biotech focuses on cancer treatments by targeting genetic mutations that create protein chimers that lead to unregulated cellular proliferation. In English, and very simply, imagine a copy machine. When you press 'Copy' you should get one duplicate of the item you want copied. Cells have similar systems where a protein in the cell membrane receives a signal from the outside world telling the cell to divide and make a copy of itself.
Now imagine your copy machine crosses circuits with a 'Repeat' button. This will lead to infinite, unchecked copying. In cancer a similar thing occurs. Genetic mutations can cause the growth signalling protein to get joined to other proteins leading to unchecked, infinite cellular proliferation. This is one of the several steps to developing cancer. Loxo has developed and is testing drugs that target these specific mutations.
Their leading drug, Lorotrectinib, targets TRK fusion proteins (-tinib as a suffix indicates it inhibits tyrosine kinases) and has shown good efficacy in combating several types of cancer with minimal side effects reported. Notable upcoming events are a data review at an upcoming oncology conference October 19-23, Earnings Report on 11/5/18, and a New Drug Application review PDUFA by the FDA on 11/26/2018. The last date is the most important as Loxo could see Lorotrectinib obtain FDA approval. Other possibilities for the PDUFA are an extension of the review or rejection of the drug. From the research reports I have read so far on Lorotrectinib I am doubtful a rejection/denial will happen. I suspect it will either be approved or the review extended and this will depend upon new data, likely to be presented in October.
The chart currently looks bullish to me. There is a clear uptrend long term with us likely in a Wave 2 in Elliot Wave Theory. Mid term price is consolidating in a descending wedge/bull pennant. The safe trade is to buy once price breaks the top of the channel. An aggressive option is to buy when price touches the bottom of the channel. If I buy prior to earnings I will probably trim half my position the day before ER then play the run up to the PDUFA review late November.
***This is not investing advice. I am not an investing professional. Do not invest what you cannot afford to lose. All investors should seek guidance from licensed financial advisers and not random people on the internet.***

