Biocon trade setup 27th November 2023 (Language Hindi)A short two minute overview of Biocon and levels to watch. Before taking any trade please do your own research. This is only an insight from us thank you
Pharmaceuticals

Solara - The Sun is Rising Behind the PyramidSolara Active Pharma:
After the CEO of Solara resigned 1.5 years ago, the Company shares faced a major crash - retracing near 100% on Fib scale. A large Pyramid like structure was formed eventually
Over the past few months - the price has started to strengthen the base taking support near the 290-300 zone which is one the Strongest support for the script
A Bullish Reversal sign is seen when a Right Angled Triangle pattern was formed and successfully breaking out of the Pattern along with the next immediate resistance at 410. I can also be seen as a Double Bottom pattern - long long way to go
Its changing direction from being a Sunset company to a Sunrise company. With the Breakout of Pharma sector, many Pharma companies are having their dream run and SOLARA is riding the journey along with its peers.
The Sun is Rising behind the Tall Pyramid. Wait for Large Targets ahead - 550, 830, 1200
Disclaimer:
Stocks-n-Trends is NOT a SEBI registered company. We do not provide Buy / Sell recommendations - rather we provide detailed analysis of how to review a chart, explain multi--timeframe views purely for Educational Purposes. We strongly suggest our followers to "Learn to Ride the Tide" and consult your Financial Advisors before taking any positions.
If you like our detailed analysis, please do rate us with your Likes, Boost and share your comments
-Team Stocks-n-Trends

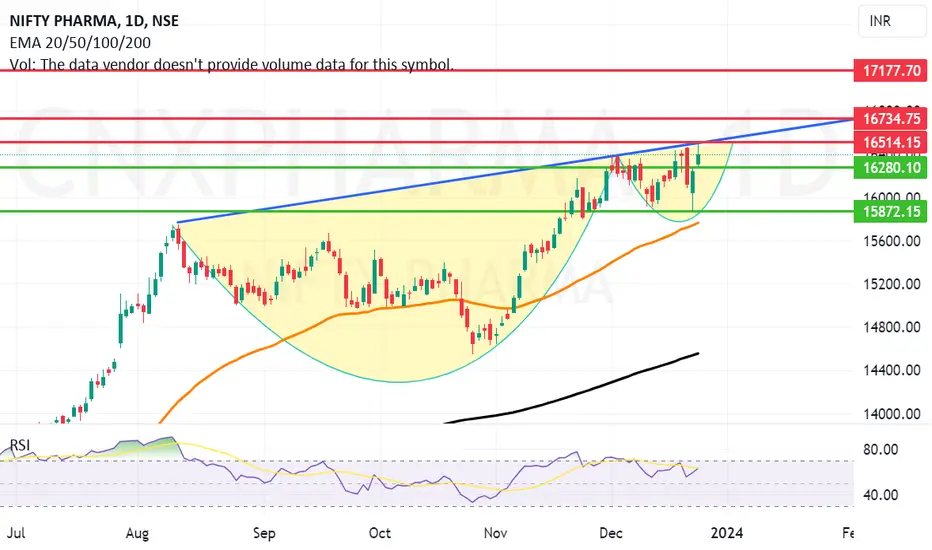
Cup and Handle kind of Breakout on cards for Pharma Index. Technically Pharma index is on the verge of giving a cup and handle like breakout in addition to news of new COVID variant making waves. The Pharma index also looking very buoyant. If this particular index can give a closing above 16515 there can be an upsurge 16734 or even 17177 levels taking the index constituents higher along with it.
Major companies in pharma index are Abbott, Cipla, Glaxo, Sanofi, Pfizer, Dr Reddy's, Lupin, Torrent Pharam, Ipca Labs, Sun Pharma, Aurobind Pharma, Natco Pharma, Granules India, Gland Pharma, Alkem, Biocon, Glenmark, Zydus Lifescience, Divi's lab, Laurus lab. Some companies good companies of Mid and Small cap pharma can also yield positive momentum.
Post identification of a strong index what you can do is try to look at the charts of each constituent of the index individually and select the stocks with best EPS, PE ratio, Good Cash flow from operations, Revenue and Net Profit growing year on year and quarter on quarter.
Remember that now all the stocks in an index will move equally some will move faster, some will move at the same pace, some will move slowly and some will not move at all or move negatively. You have to be smart in selection of your stocks from the particular index and you will surely be able to beat the market and Ace the art of investing. There are many Pharma related Mutual funds that can also be looked at.
Disclaimer:
Investment in stocks and mutual funds is subject to market risks, please consult your investment advisor before taking financial decisions. The data provided above is for the purpose of analysis and is purely educational in nature. The names of the stocks given in the above article and chart of IT Index is only for analysis. Purpose of this article is educational. Please do not consider this as a recommendation of any sorts.
Long Rubles Big PharmaAs you can see on the presented chart first goes Gilead Sciences, USA Pharmaceutical Giant which we see as the main sorce of income and R&D of USA Pharmaceuticals Industry. Main levels are 82.50, 79.00, 73.50, 69.00. Second is Pfizer, Europe Pharmaceutical giant, main levels are 54.50, 46.50, 28.50. Third is Merck, based, again, in Europe, main levels are 115.00, 80.50. Fourth is Bayer, a multinational Pharmaceutical Giant. Fifth is Life, biopharm company from Russia, main levels are, 9.00, 7.25, 4.70. Sixth is Diod, experimental and natural medicine company, main levels are 24.00, 15.50.
We see a possibility of strong profits in coming quarters, due to the winter season and new R&D activities. Wee see these companies as a good opportunity for a risk oriented investor to hold for about twelve to twenty four months.

GILD - Setting up for multi year run
Monthly chart is setting up nicely.
if it takes out 88, ATH should be quick.
stop loss: 79

Ruble developing ground to restructure third world economiesOn the presented chart we have prepared, you can see correlations of Ruble currency with Telecoms, Steel producing, Concrete producing, Land transport and Medicine. As you can see Ruble is building a solid ground to become a back end for the developing world destroyed by conflicts and fist fights. ATR is going down and from the june it shows backward correlation with Ruble. This is good because this means Ruble can rise without volatility. Telecommunications prices are falling after this event. Steel producing showing strange pattern and can be a risk for the Ruble. Concrete producing and transportation developing a good foundation. Transportation industry is still and strong. And medicine industry showing weakness but we see rise in pharmaceuticals profits so we hope this will drag whole venture up.

LLY Bearish Confirmation Put in at the 3.618 Fibonacci ExtensionLLY has given us Bearish RSI Confirmation at the 3.618 Fibonacci Extension and now looks to push below the $580 level. This could quickly devolve into LLY making a much deeper Bearish Retrace that would bring it below trend. At that point, we could very well see LLY come all the way back down to fill the gap at $163.42

ELI LILLY Next bullish phase starts. Target 670.Eli Lilly / LLY stopped its short term decline yesterday a little over the 1day MA50.
The green 1day candle signals the start of the new bullish phase inside this double Channel Up.
The 1day RSI is on a similar pattern as August 3rd.
Assuming a declining rate of growth on each Higher High, buy and target 670 (+30% from the recent bottom).
Follow us, like the idea and leave a comment below!!

Weight loss - Stock GainEli Lilly & Co. is a pharmaceutical company with a long history dating back to its founding by Eli Lilly in May 1876. The company is headquartered in Indianapolis, Indiana, and is engaged in the discovery, development, manufacture, and sale of pharmaceutical products. Their product portfolio includes a range of therapies in various therapeutic areas, such as diabetes, oncology, immunology, neuroscience, and other medical conditions.
One notable aspect of their recent success is the introduction of a weight loss drug, tirzepatide. This drug is similar to other medications like Ozempic and Wegovy, which are also designed to help with weight loss. These medications are administered via weekly injections and work by affecting the patient's appetite by mimicking certain hormones in the gut.
Wegovy, for instance, primarily mimics the hunger-regulating hormone called GLP-1, while tirzepatide goes a step further by mimicking both GLP-1 and another hormone called GIP. These hormonal effects can lead to decreased appetite, making it easier for individuals to manage their weight.

ELI LILLY Our gem on the verge of making a paradigm shift.Eli Lilly and Company (LLY) has long been one of our best investments a real gem that even withstood and was practically unaffected by the 2022 inflation crisis. For long we have been using the Fibonacci Channel to display LLY's parabolic nature having broken above the 2.0 Fibonacci extension last May.
This time the price reversed much quicker than technically expected and is attempting again to break the top (Higher Lows trend-line) of the Channel Up that started in 2020. If it closes above it, then we wil target the 3.0 Fibonacci Channel extension at $700. If it gets rejected and stays within the Channel Up, we will sell and target the recent Support at $520.
Note that a break above this 3-year Channel Up may constitute a paradigm shift as the stock has never hit a new upper Fibonacci level that quickly (remember it broke above the 2.0 Fib just 5 months ago). This can transcend LLY into an even more aggressive bullish nature that we can't yet quantify.
-------------------------------------------------------------------------------
** Please LIKE 👍, FOLLOW ✅, SHARE 🙌 and COMMENT ✍ if you enjoy this idea! Also share your ideas and charts in the comments section below! This is best way to keep it relevant, support us, keep the content here free and allow the idea to reach as many people as possible. **
-------------------------------------------------------------------------------
💸💸💸💸💸💸
👇 👇 👇 👇 👇 👇

Longing Novartis (NVS) Longing Novartis (NVS): A Strategic Investment Amidst Geopolitical Tensions
This article presents a compelling rationale for considering a long position in Novartis (NVS) stock. The primary driving factor behind this investment strategy is Novartis' close association with Sandoz (SDZ) following the latter's stock debut last week. Sandoz, a subsidiary of Novartis, is a prominent manufacturer of the generic version of Copaxone, a glatiramer acetate injection widely used in the treatment of relapsing forms of multiple sclerosis. This article examines the strategic advantages of this association, highlighting the potential benefits of Novartis' position in the pharmaceutical market in light of increasing tensions in the Middle East.
Sandoz's Role in the Copaxone Market:
Sandoz's significance in the pharmaceutical industry cannot be overstated, particularly with its role in manufacturing the generic version of Copaxone, known as Glatopa. This medication contains the same active ingredient, offers comparable clinical benefits, and shares a similar administration process with Copaxone. Notably, Copaxone has historically been one of Teva Pharmaceuticals' most profitable products.
Geopolitical Tensions and Consumer Behavior:
A critical aspect of this investment thesis revolves around the current escalation of tensions in the Middle East, specifically the Israeli-Palestinian conflict. As geopolitical uncertainties continue to mount in the region, consumers and healthcare providers may seek alternative sources for medications, including those used to treat conditions like multiple sclerosis. This shift in consumer behavior is attributed to concerns about supply chain disruptions and the desire to reduce dependence on Israeli-produced drugs amidst the ongoing conflict.

TEVA SHORT - Israel Palestine ConflictPrice points indicated on chart. Helios is shorting Teva. Looking for put options with close expiry dates.
Not financial advice
This article explores the potential implications of the ongoing Israel-Palestine conflict, which was initiated on October 7th. Teva, a global pharmaceutical giant, operates five manufacturing facilities situated within a 50-mile radius of the Gaza Strip border. This geographic proximity raises concerns about the company's exposure to heightened geopolitical tensions, as any escalation in the conflict could disrupt, or even lead to the complete shutdown of these facilities. The article also contemplates the likelihood of nations worldwide seeking alternative pharmaceutical suppliers in the event of such disruptions.
Teva's Geographic Exposure:
Teva Pharmaceutical Industries maintains five manufacturing facilities located within a mere 50 miles of the Gaza Strip border. This close geographic proximity to a region frequently affected by conflicts and geopolitical tensions exposes Teva to a unique set of risks. The facilities in question play a pivotal role in the production and distribution of essential pharmaceutical products, which adds to the significance of this geographical positioning.
Potential Consequences:
The crux of this article centers on the potential consequences of the Israel-Palestine conflict for Teva Pharmaceuticals. While the conflict's course remains uncertain, any escalation in hostilities could result in a range of adverse outcomes for the company's operations:
Factory Closures: In the event of heightened tensions or direct conflict affecting these manufacturing facilities, temporary closures could disrupt production. Such closures might be mandated for employee safety or due to logistical challenges associated with operating in a conflict zone.
Shutdown Scenarios: The most extreme scenario involves the complete shutdown of Teva's facilities near the Gaza Strip border. This would not only halt production but also entail significant economic losses for the company.
Global Pharmaceutical Market Dynamics:
Furthermore, this article contemplates the global pharmaceutical market dynamics in the context of Teva Pharmaceuticals. In the event of disruptions in Teva's supply chain due to the Israel-Palestine conflict, nations worldwide may seek alternative pharmaceutical suppliers to ensure the availability of essential medications. This shift in supplier preferences could impact Teva's market share and revenues.
Conclusion:
In conclusion, the Israel-Palestine conflict has introduced a unique set of risks and challenges for Teva Pharmaceutical Industries due to its proximity to the conflict zone. While the actual impact remains uncertain and contingent on the course of the conflict, investors and stakeholders should remain vigilant and consider diversification strategies to mitigate geopolitical risks associated with their pharmaceutical investments. The potential ramifications of this conflict extend beyond regional concerns and could reverberate throughout the global pharmaceutical industry, making it imperative for industry observers and investors to closely monitor developments in the region.

PFIZER Buy signal but only on the short-term.Pfizer (PFE) has been trading within a Channel Down pattern since the start of the year and on Friday it registered the strongest green 1D candle since the recent Lower Low leg started in August. This is technically the start of the new rebound leg towards a new Lower High. Those have been priced within the 1D MA50 (blue trend-line) and 1D MA100 (green trend-line), never breaking above the latter.
We are therefore targeting the 1D MA50 again at 34.50, an average estimate based on the previous three Lower High legs. Note that this is only a short-term trade as the long-term trend remains heavily bearish within the Channel Down. Only a 1D candle closing above the 1D MA100 can justify a longer term buy targeting the 1D MA200 (orange trend-line).
-------------------------------------------------------------------------------
** Please LIKE 👍, FOLLOW ✅, SHARE 🙌 and COMMENT ✍ if you enjoy this idea! Also share your ideas and charts in the comments section below! **
-------------------------------------------------------------------------------
💸💸💸💸💸💸
👇 👇 👇 👇 👇 👇

Pfizer (PFE) -> It Is Now Or NeverMy name is Philip, I am a German swing-trader with 4+ years of trading experience and I only trade stocks , crypto , options and indices 🖥️
I only focus on the higher timeframes because this allows me to massively capitalize on the major market swings and cycles without getting caught up in the short term noise.
This is how you build real long term wealth!
In today's anaylsis I want to take a look at the bigger picture on Pfizer.
At the moment Pfizer stock is once again retesting major sructure at the psychological $33 level which already acted as pretty strong support in the past.
Considering that the next support level below current price is at $27, Pfizer is now trading at a pretty decisive potential turning point and has not yet broken structure towards the downside.
- - - - - - - - - - - - - - - - - - - -
I know that this is a quite simple trading approach but over the past 4 years I've realized that simplicity and consistency are much more important than any trading strategy.
Keep the long term vision🫡

ELI LILLY Hit the top of the 4-year Channel. Relief sell-off?Earlier this year we gave a strong buy signal on Eli Lilly and Company (LLY) on March 01 (see chart below) where we called for the most optimal buy entry exactly at the bottom of the bullish pattern:
The price has now hit (last week) the top of the 4 year logarithmic Channel Up, highly overbought with the RSI on the 1W time-frame reaching 84.30, breaking above the August 16 2021 High. As last week's 1W candle closed in red (the first after 5 straight bullish weeks) this is considered so far a Higher Highs rejection and calls for an early sell signals towards the end of October, targeting the 1D MA100 (red trend-line) at $500.00, where the stock will start turning into a buy opportunity again (assuming the RSI is below 55.00).
-------------------------------------------------------------------------------
** Please LIKE 👍, FOLLOW ✅, SHARE 🙌 and COMMENT ✍ if you enjoy this idea! Also share your ideas and charts in the comments section below! **
-------------------------------------------------------------------------------
💸💸💸💸💸💸
👇 👇 👇 👇 👇 👇

Potential Up Trend on Gland Pharma Ltd (NSE), Fib RetracementThis is my personal view that Gland Pharma Ltd ha very potential uptrend for coming future.
I tried to figure it out with the Fib Retracement with Anchored volume profile.
As I have noticed it retraced exactly from -1.618 (905.85).
Target 1.618, which is 3190.45
Let me know if you have different views..
Thanks for viewing.

LLY: The NVDA of Pharmaceuticals Showing Signs of Future DeclineIf we close the day as we are now, we will have confirmed a 3 Line Strike, a Bearish PPO Arrow, and a break below the 5 EMA on the Daily Timeframe just above the 3.618 Fibonacci Extension. From there I would expect LLY to first Fill the gap at $451.50 and beyond that I think it will revisit the 200-day SMA around $350 and maybe even the 800-day EMA at around $285.

GRI Bio periodic pumps
GRI Bio recently underwent a 1/30 split on April 24th, accompanied by a merger/restructure of Vallon Pharmaceuticals. The stock price immediately tanked approx. 50% in the following days. The price has held above the low of $5.50 on April 26th for over a month. Based on past performance, this stock has a tendency to jump 30 to >200% in a single day. GRI Bio has touted the merger and restructuring will bring "near term" value to stock holders, and perhaps a catalyst will emerge in the coming month(s). I think this is a safe long with stops at $5.50 or thereabouts. A jump to $10 or higher seems reasonable, but will likely retrace immediately.

UPDATE: Clicks just gave two extra buying signals!Inverse Head and Shoulders formed on Clicks.
The price broke up and then there was a consolidation to the downside forming a somewhat Falling Pennant.
During this time the price bounced off the 200 MA and the uptrend.
This coonfirms the upside will continue along with other indicators.
7>21>200
RSI>50
Target remains at R340.76

UPDATE You pay less for Clicks for NOW target still R340You pay less at Clicks but the price is going up so now is the best time to buy.
We have an Inverse Head and Shoulders pattern form, as I mentioned earlier. the price broke up and is showing strong upside to come.
We have other indicators confirming including:
7>21>200
RSI>50
Target R340.76
ABOUT THE COMPANY
Clicks is a well-known South African retail pharmacy, health, and beauty chain.
Clicks was founded in 1968 in Cape Town, South Africa, as a health and beauty retail store.
Product Range:
Clicks offers a wide range of products, including pharmaceuticals, over-the-counter medications, beauty products, skincare, haircare, personal care items, and more.
Store Network:
Clicks has a vast network of stores across South Africa, with locations in cities, suburbs, and shopping malls.
Pharmacy Services:
Many Clicks stores have an in-house pharmacy, providing prescription medications, advice from qualified pharmacists, and other pharmaceutical services.
Private Label Products:
Clicks has its own private-label brands for various products, offering customers affordable alternatives to well-known brands.
Wellness Clinics:
Some Clicks stores have wellness clinics that offer various healthcare services, including vaccinations, screenings, and family planning consultations.
Beauty Services:
Some larger Clicks stores offer beauty services such as nail bars and eyebrow threading, enhancing the shopping experience.
Online Shopping:
Clicks offers an online platform where customers can shop for a wide range of products and have them delivered to their homes.
Rewards Program:
The Clicks ClubCard loyalty program offers customers discounts, cashback rewards, and personalized offers based on their shopping habits.
Parent Company:
Clicks is part of the Clicks Group, which also owns other retail brands like Musica, The Body Shop, and UPD (United Pharmaceutical Distributors).
HOW IT GOT ITS NAME
The "Clicks" name was apparently derived from the sound that the founder, Jack Goldin, heard from a clicking stethoscope, embodying the health focus he wanted for the company.
However, due to the existing legislation, the health focus was not immediately realized until later years.

IPCA LABSHello & Welcome to this analysis
The outlook has been down from quarterly, monthly, weekly & daily chart study.
Its been in a 2 years downtrend, now near a support but yet to give any reversal confirmation. If this level of 700 fails to hold the next major support comes in at 600.
Overall its a wait and watch stock even from a bounce back point of view

#DEEPAKNTR...looking good 18.05.23#DEEPAKNTR.. ✅▶️
Intraday as well as swing trade
All levels given in charts ...
IF good potential seen then we work in options also
if activate then possible a huge movement Keep eye on this ...
We take trade only when it activates...
Possible to give good target
TRADING FACTS

Eye Spy a MultibaggerI was hesitant to publish this chart because the extreme upside it shows will likely be viewed as unrealistic. However, HROW recently decisively broke above its 4-year trend channel as business developments have been quite positive lately - particularly with IHEEZO. This is a rare setup where the fundamentals and technicals both align for a sharp move to the upside.
Over the short-term HROW may retest the trend channel breakout around the $17 region. If it holds, which I expect, I believe we could reach a triple-digit share price in short-order, potentially within 18-months, which would be a 500%+ return from today's share price of $19.50.
My personal price target is $150/share by end of year 2025.
