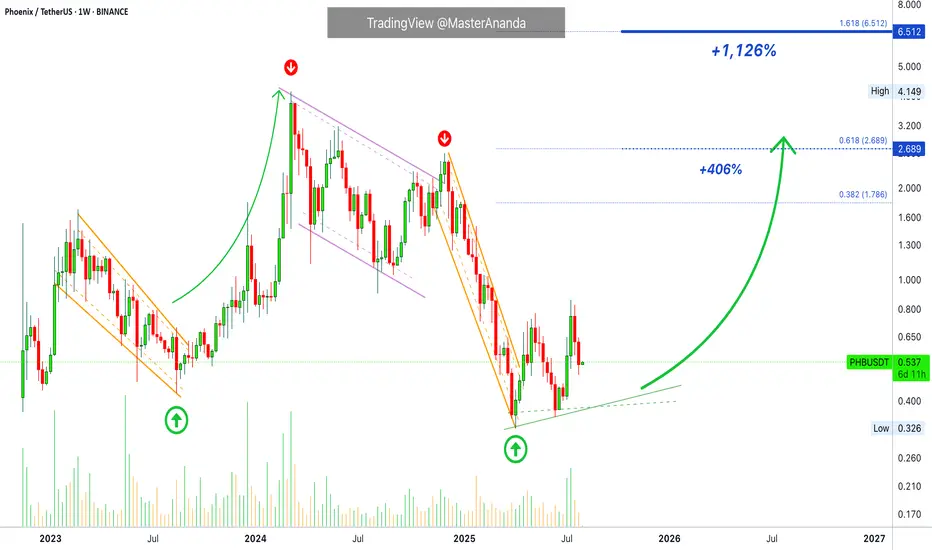
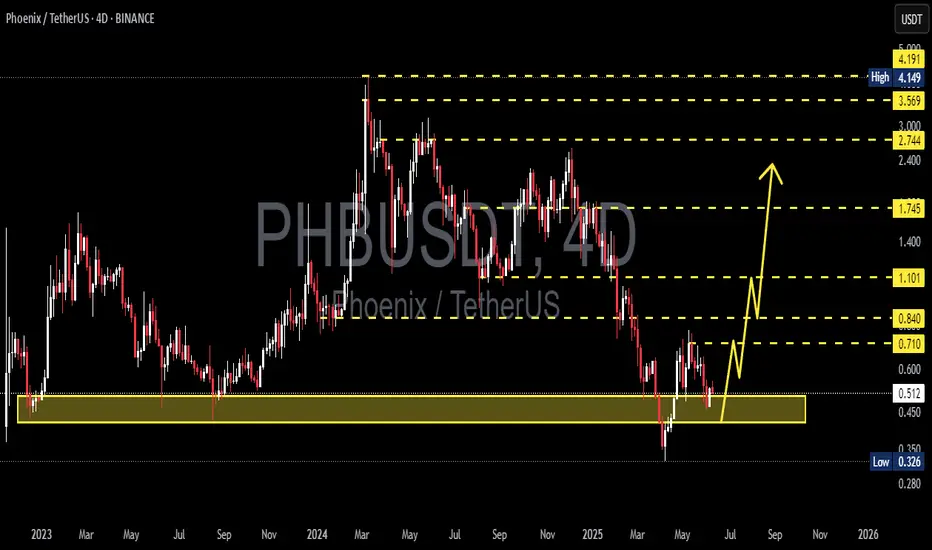
Phoenix Recovers · Easy 1,126% Target @ $6.5 Phoenix is just coming out of a major downtrend. After the main low there was a higher low and rising buy volume. Whenever there is a down wave that ends in strong buying, we know the market is about to turn, we have proof here.
PHBUSDT produced a down move in February 2023. Prices moved lower and a major low happened in August 2023, trading volume started to rise. The rise in volume predicted a change of trend. Then prices also started to rise and we ended up with a bullish wave.
PHBUSDT produced a down move in March 2024, this was a long drawn out correction. The market was moving lower with lower highs, the main one showing up December 2024 and then a major crash. A major low showed up April 2025 and now we are seeing rising volume, the signal that predicted an advance last time. With rising volume and a higher low, we can expect prices to rise next.
And this is it. Phoenix is trading at bottom prices but is slowly starting to recover. Strong bullish action is the next logical step. The market will grow. Crypto will grow. The altcoins are bullish now.
Namaste.
Phbusdt
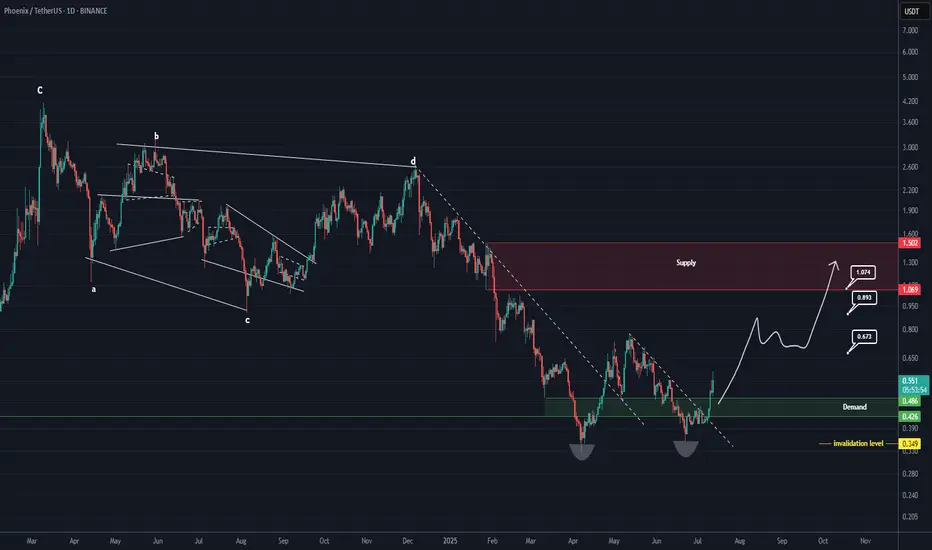
PHBUSDT Bounces from the Golden Pocket?🧠 Market Context & General Analysis
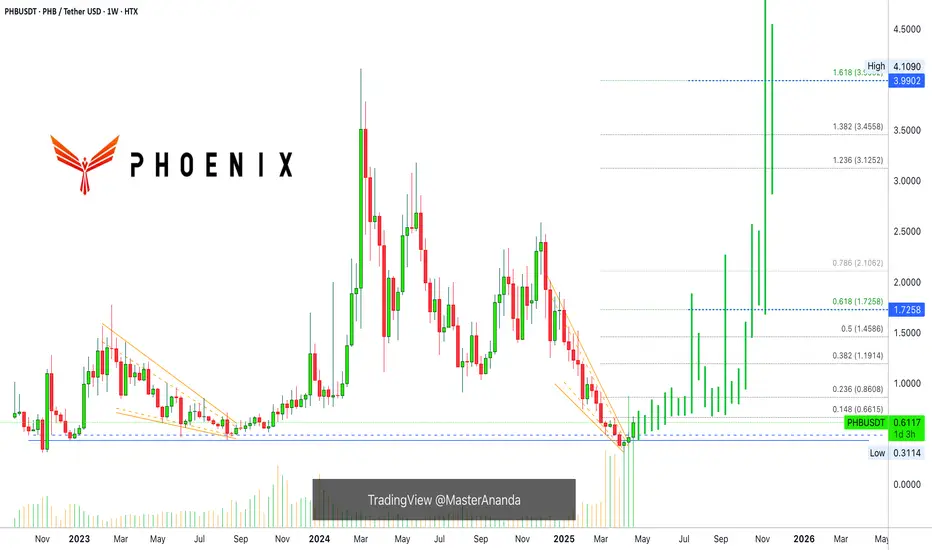
Phoenix (PHB) is currently at a critical juncture in its market structure. After a prolonged downtrend from its 2024 highs, price has now reacted strongly off a key Fibonacci Golden Pocket retracement zone (0.5–0.618), which also aligns with a historically respected demand area.
This level is not just a technical formality – it’s a zone where smart money typically enters, and historically it has provided reliable bullish reversals.
---
📍 Key Zones to Watch
🟨 Demand / Accumulation Zone:
0.549 – 0.608 → Fibonacci 0.5–0.618 + Historical support
⤷ Has been retested and shows early signs of a bullish reaction.
📈 Layered Resistance Zones (Fibonacci Targets):
0.834 → Minor resistance + potential double bottom neckline
1.028 → Previous structural resistance
1.200 → Psychological round level
1.458 → Key Fibonacci extension
1.945 – 2.735 – 3.648 → Mid/long-term Fibonacci targets
4.149 → All-Time High (ATH) on this chart
🔻 Major Support if Breakdown Occurs:
0.326 → Historical bottom / last line of defense
---
🧩 Pattern Formation: What’s Emerging on the Chart?
🔄 Potential Double Bottom:
Price structure is showing signs of a potential reversal formation in the form of a double bottom near the 0.55–0.61 zone. A confirmed breakout above the neckline at 0.834 would validate this bullish setup.
📉 Broken Downtrend Channel?:
PHB was previously trading in a downtrend channel. The current move suggests a possible breakout and the beginning of a trend shift or accumulation phase.
---
✅ Bullish Scenario: The Rise of the Phoenix
If the price holds above 0.608 and confirms with a strong breakout above 0.834, a bullish trend reversal could follow.
🚀 Short-term targets: 0.834 → 1.028
🔥 Mid-term targets: 1.200 → 1.458 → 1.945
🌕 Long-term potential: 2.735 – 3.648 – 4.149
Validation Key: Break above 0.834 with strong volume
Bullish confirmation candle: Bullish engulfing / Marubozu on 4D or Daily
---
⚠️ Bearish Scenario: Breakdown Threat Looms
If the price fails to hold the 0.549 support level, we could see a continuation of the downtrend, potentially targeting:
💀 First stop: 0.45 – 0.40 zone
🧊 Extreme case: Drop toward 0.326 (historical low)
Breakdown Confirmation:
Daily or 4D close below 0.549
Followed by selling volume and no quick recovery
---
🎯 Potential Trading Strategies (Not Financial Advice):
🟢 Bullish Swing Entry: Buy zone at 0.55–0.61
⤷ Targets: 0.834 – 1.028
⤷ Stop-loss: Below 0.52 (close basis)
🔴 Breakout Trade: Enter on breakout above 0.834 with volume
⤷ Targets: 1.200 – 1.945
⤷ Stop-loss: Below 0.80
🔵 Bearish Play / Re-entry: Short if break below 0.549
⤷ Targets: 0.40 – 0.326
⤷ Stop-loss: Above 0.60
---
🧲 Final Thoughts
PHBUSDT is in a make-or-break zone, sitting atop the Golden Pocket and showing early bullish momentum. If buyers step in and maintain the momentum, we could be witnessing the early stages of a significant market reversal.
However, failure to hold the key support at 0.549 would likely shift the sentiment back into bearish territory. Volume and confirmation candles will be the deciding factor for the trend’s next direction.
#PHBUSDT #PhoenixCrypto #AltcoinReversal #GoldenPocket #CryptoTA
#FibonacciLevels #BullishSetup #BearishBreakdown #ChartPatterns

PHB Looks Bullish (1D)It appears that wave E has ended after a long consolidation and the formation of a double bottom. A key trigger line has been broken, and the price has reclaimed the flip zone (marked in green).
As long as the green zone holds, the price can move toward the targets and the red box.
The targets are marked on the chart.
A daily candle closing below the invalidation level will invalidate this analysis.
For risk management, please don't forget stop loss and capital management
Comment if you have any questions
Thank You
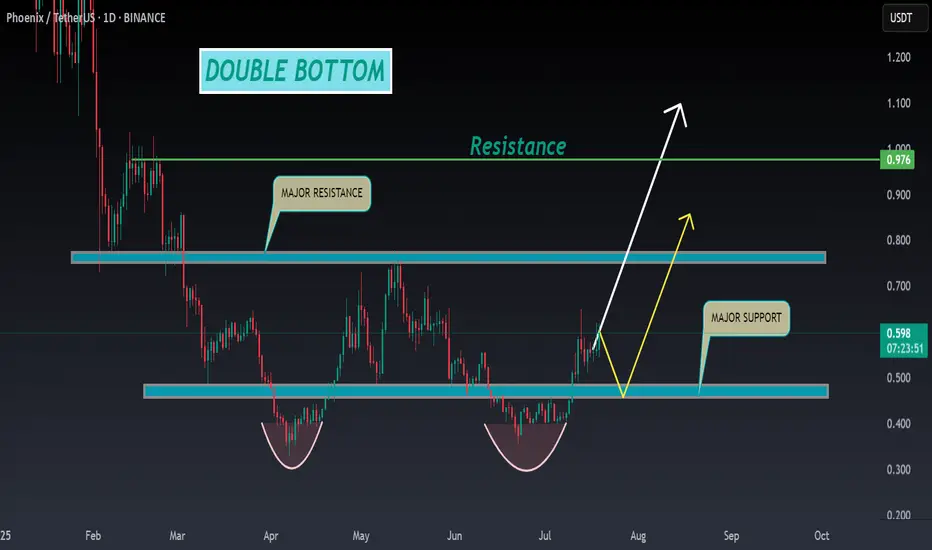
PHB ANALYSIS🔮#PHB Analysis :
📈📈 #PHB is making perfect Double Bottom Pattern. We can see a good pump if #PHB breakout the major resistance zone with good volume and sustains the higher price after breakout 🚀🚀
📊 Current Price: $0.595
⏳ Target Price: $0.780
⁉️ What to do?
- We can trade according to the chart and make some profits in #PHB. Keep your eyes on the chart, observe trading volume and stay accustom to market moves.💲💲
#PHB #Cryptocurrency #Pump #DYOR #Breakout
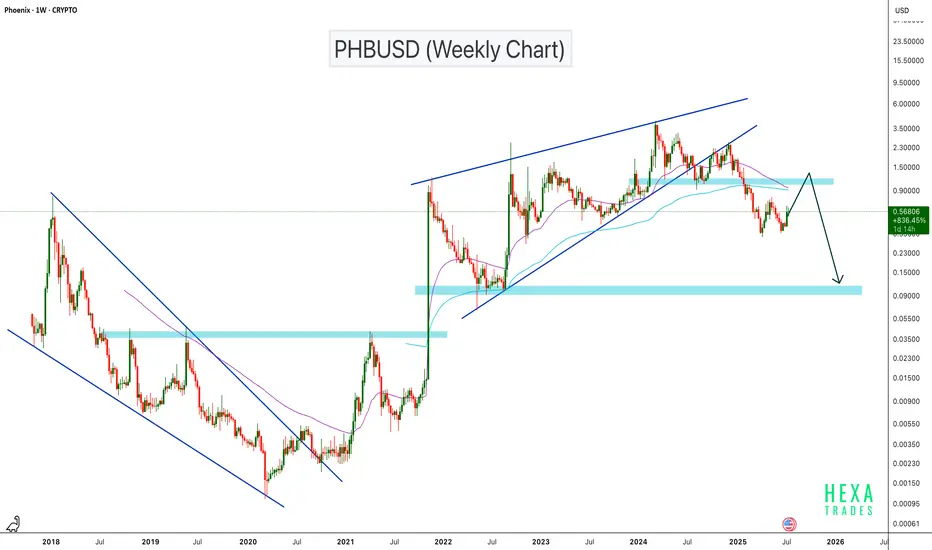
PHBUSD Breakdown: Rising Wedge Signals Bearish ContinuationPHBUSD has broken down from a rising wedge pattern on the weekly chart, signaling a potential trend reversal. The price is currently attempting a retest of the previous support zone at the $1.00–$1.20 level, which is now likely to act as resistance. If this retest fails, it could confirm a bearish continuation setup, with the next key support zone around $0.10. This level has previously acted as a major base and could serve as the next downside target
BINANCE:PHBUSDT AMEX:PHB
PHBUSDT 4D AnalysisPHB ~ 4D Analysis
#PHB This trade is very High risk, Buy gradually from here if you still have confidence in this coin with a short term target of at least 15%+ from here.
PHB/USDT trendline breakout alertPHB/USDT trendline breakout alert
PHB has broken above a key descending trendline, signaling a potential shift in momentum from bearish to bullish. Trendline breakouts often indicate the end of a correction or consolidation phase and the beginning of a new trend.
If PHB holds above the breakout level with increasing volume, it could lead to further upside. However, a drop back below the trendline may invalidate the breakout and signal a false move.
Key levels to watch:
* Retest of the broken trendline as support
* Immediate resistance overhead
* Volume confirmation for strength
Monitor PHB closely — this breakout could be the start of a trend reversal if confirmed.

PHBUSDT 3D Analysis PHB ~ 3D Analysis
#PHB Buy from here if you still have confidence in this coin with a short term target of at least 15%++

#PHB/USDT#PHB
The price is moving within a descending channel on the 1-hour frame and is expected to break and continue upward.
We have a trend to stabilize above the 100 moving average once again.
We have a downtrend on the RSI indicator that supports the upward move with a breakout.
We have a support area at the lower boundary of the channel at 0.652, which acts as strong support from which the price can rebound.
Entry price: 0.666
First target: 0.692
Second target: 0.712
Third target: 0.740

Phoenix Global Massive Growth Ahead Bullish Bias ConfirmedLast week produced the highest volume ever, extremely high, after a very strong bottom candle and signal. Phoenix Global is set to enter a major bullish trend and bull market cycle. The bottom is in.
Good morning my fellow Cryptocurrency trader, this is a great and interesting chart.
The best signals come from the candles, the best support from the volume indicator, here we have both working in unison. Great.
A doji is the candle that produced the correction low. The session ended green and with high volume. The doji is a reversal signal when confirmation comes and confirmation is in.
The following candles after 7-April are high volume candles, extremely high and full green. That's it. These past three weeks confirmed two things: (1) The bottom is in and (2) a new bullish wave will develop.
A new uptrend can last months or it can even go for years. So it is very interesting to be able to find these charts while they are trading at bottom prices. Joining the market at this time, buying and holding, can be life changing, truly. You will have your confirmation in a matter of weeks. It will take only 4-6 weeks for everything Altcoin to trade 300% higher. And that will only be the start.
» PHBUSDT activated its two strongest support levels, that is August 2023 and November 2022. The 7-April low produced a technical double-bottom and a factual long-term higher low. Another signal in support of massive growth comes next be ready and prepared.
Thank you for reading.
Namaste.
PHBUSDT 6DPHB ~ 6D Analysis
#PHB Buy gradually from here with a short -term target of at least 20%+
The reason, this is the lowest support, before the price rises high.


PHB ANALYSIS🔮 #PHB Analysis
💲💲 #PHB is trading in a Symmetrical Triangle Pattern. If the price of #PHB breaks and sustain the higher price then will see a pump. Also there is an instant strong support zone. We may see a retest towards the support zone first and then a reversal📈
⁉️ What to do?
- We have marked crucial levels in the chart . We can trade according to the chart and make some profits. 🚀
#PHB #Cryptocurrency #Support #Resistance #DYOR

PHBUSDT 3DPHB ~ 3D
#PHB for now continues to maintain this Support block,. Buy gradually on this support,. with a minimum target of 20%++

PHB looks bullishIt looks like the PHB is forming a triangle.
We are now in wave E of this triangle.
The green range is a suitable support where we can look for buy/long positions.
The targets are marked on the chart.
Closing a daily candle below the invalidation level will violate this analysis.
For risk management, please don't forget stop loss and capital management
When we reach the first target, save some profit and then change the stop to entry
Comment if you have any questions
Thank You

Phb/usdtSoon we will see phb at the green levels! Important thing is to note down the weekly closing candle but regardless we will see phb at those levels.
If we get a weekly closing candle above previous all time highs. That could create opportunity for further growth.

PHB ANALYSIS🚀#PHB Analysis :
🔮As we can see in the chart of #PHB that there is a formation of "Descending Channel Pattern". Expecting a bullish move after the breakout of major resistance zone in few days.📈
🔰Current Price: $2.010
🎯 Target Price: $2.815
⚡️What to do ?
👀Keep an eye on #PHB price action. We can trade according to the chart and make some profits⚡️⚡️
#PHB #Cryptocurrency #TechnicalAnalysis #DYOR

PHBUSDTPHB ~ 1W
#PHB Forming a bullish pattern on the 1W Time frame. If you have Conviction on this coin,. Wait for the resistance line of this pattern to be successfully broken through with strong volume. after that buy in stages. with a minimum target of 20%++

PHB LongPHB Long Setup
Reason:
Breakout of Accumulation Zone.
Breakout of Trendline.
Strong Bullish momentum with volume.
Expecting a bullish impulsive move soon.
All Technical Indicator suggesting a Solid Breakout.
Regard, The Crypto Panda
BINANCE:PHBUSDT.P
BYBIT:PHBUSDT.P
BINANCE:PHBUSDT
MEXC:PHBUSDT.P

PHB Breakdown Alert! Bearish Move Confirmed — Will We Hit $1.34?Yello, Paradisers! Are we about to see a deeper plunge for #PHBUSDT? Let’s dive into the details!
💎#PHB has confirmed a shift to a bearish outlook after breaking down its crucial support trendline. Right now, our immediate target is the $1.57 support area. If the price breaks below this level, the bearish continuation will likely accelerate, increasing the probability of reaching our final target in the $1.34 demand zone.
💎If Bitcoin shows strength and rebounds, PHB could see a temporary relief rally, potentially testing the fresh supply zone at $1.83 - $1.93 before resuming any significant downward movement.
💎Bearish invalidation occurs if PHB closes above $2.12—this would signal a continuation of the upward momentum and make any short positions invalid.
Remember, it’s all about timing the market at the right levels for maximum gains.
MyCryptoParadise
iFeel the success🌴

PHB ANALYSIS🚀#PHB Analysis :
🔮As we can see in the chart of #PHB that there is a formation of "Falling Wedge Pattern". Also there is a breakout and retest of the pattern and currently retesting the major support zone. Expecting a bullish move in few days.📈
🔰Current Price: $2.100
🎯 Target Price: $2.800
⚡️What to do ?
👀Keep an eye on #PHB price action. We can trade according to the chart and make some profits⚡️⚡️
#PHB #Cryptocurrency #TechnicalAnalysis #DYOR

Phb Getting Ready For Recovery phb Breaking Long Consolidation Expecting Successful Breakout After Successful Breakout My 1st Target Will Be Around 3$ Almost (43-44%) & My Final Target Will Be Recent High 3.90-4$
Over All Expecting 2x Bullish Wave After Successful Breakout

PHB Looks BullishThe PHB has finished a major correction ABC.
It is now in a bullish phase. The PHB has just reached a supply limit.
Given the good news that has been released for the AI space, the bullish movement is expected to continue.
The best place to rebuy is the green range. If PHB returns to the green range, we will look for buy/long positions.
The targets are inserted on the image.
Closing a daily candle below the invalidation level will violate the analysis.
For risk management, please don't forget stop loss and capital management
When we reach the first target, save some profit and then change the stop to entry
Comment if you have any questions
Thank You
