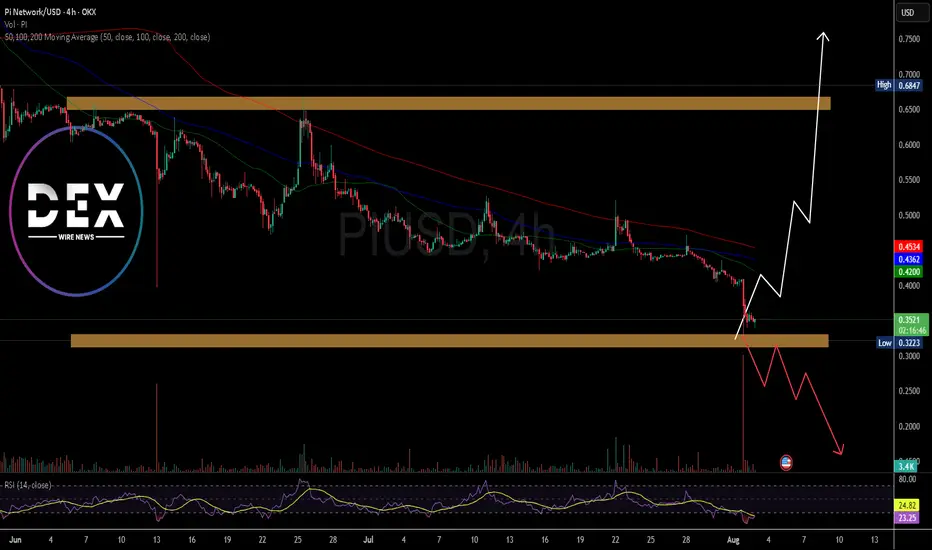
Is There Hope For PI Network? The Price of the notable altcoin NASDAQ:PI network has since seen a downtick of 80.86% since lunching and listing on major CEX like Kucoin, GateIo, OKX, etc. as per data from CMC.
The altcoin has lost the psychological $0.66 resistance zone forming a support or baseline at the $0.33 price range. with increasing selling pressure, NASDAQ:PI might experience further price dip to the $0.20 price point eventually leading to a deja vu to the $0.60 price point.
Possible factor to present price degradation is the dip in CRYPTOCAP:BTC 's price that most coins follow suit, and NASDAQ:PI wasn't an exception.
NASDAQ:PI is currently oversold as hinted by the data from Trading view. the altcoin has an RSI of 20 which entails weak momentum and possible chances of a market turnaround.
What Is Pi Network?
Pi Network is a social cryptocurrency, developer platform, and ecosystem designed for widespread accessibility and real-world utility. It enables users to mine and transact Pi using a mobile-friendly interface while supporting applications built within its blockchain ecosystem.
Pi Price Data
The Pi price today is $0.346618 USD with a 24-hour trading volume of $174,236,091 USD. Pi is down 14.58% in the last 24 hours. The current CoinMarketCap ranking is #38, with a market cap of $2,692,698,184 USD. It has a circulating supply of 7,768,487,700 PI coins and a max. supply of 100,000,000,000 PI coins.
PI
PI / Usdt OKX:PIUSDT
### **📊 Chart Overview – PIUSDT (1H):** -----Scam Coin remember -----
* **Current Price:** \$0.4484
* **Recent Move:** Sharp spike toward **\$0.48**, followed by an immediate rejection and retracement.
* **Volume Spike:** Notable surge in volume during the recent breakout, indicating possible **whale activity or manipulation**.
---
### **🔍 Technical Breakdown:**
1. **Fakeout Alert:**
* Price spiked above **\$0.4617** and got rejected hard.
* Classic **bull trap** pattern with a return below resistance, signaling caution.
2. **Support Zone:**
* Immediate support near **\$0.4470**, currently being tested.
* If this level fails, potential pullback to **\$0.4400 – \$0.4350 zone**.
3. **Resistance to Watch:**
* **\$0.4617** is now strong resistance.
* Bulls need to reclaim this level for continuation toward **\$0.48+**.
---
### **📌 Summary:**
PIUSDT showed **short-term bullish momentum** but faced **strong rejection at key resistance**. A breakdown of \$0.4470 may confirm further downside. Stay cautious of **fakeout spikes**.
---
⚠️ **Disclaimer:**
*This analysis is for educational purposes only and does not constitute financial advice. Always do your own research before making investment decisions.*

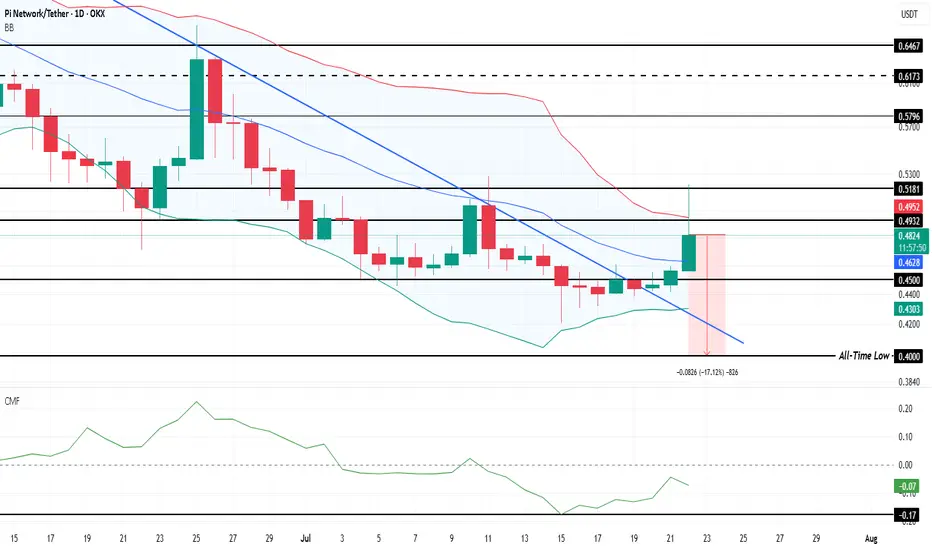
Is Pi Coin Set To Repeat History With a 114% Price Surge?OKX:PIUSDT is currently trading at $0.48 after consolidating sideways for several days. This consolidation has worked in its favor, helping the altcoin escape its two-month downtrend. Investors are now watching closely for the next resistance to be broken.
OKX:PIUSDT Bollinger Bands are converging, signaling potential volatility ahead . This technical pattern, seen previously in May when Pi Coin saw a 114% price surge , suggests that the altcoin could experience a similar breakout if market conditions remain favorable. With BINANCE:BTCUSDT consolidating and BINANCE:ETHUSDT leading altcoins, sentiment leans bullish, increasing the likelihood of Pi Coin's upward movement.
Macro indicators also align with this bullish outlook, as the Chaikin Money Flow (CMF) shows rising capital inflows into $OKX:PIUSDT. This suggests that investors are growing more confident and positioning themselves for a potential altcoin rally. As money flows into the market, Pi Coin is poised to benefit from increased demand , setting the stage for a possible price breakout.
Despite being only 17% above its all-time low of $0.40, the technical indicators suggest this support will hold. If OKX:PIUSDT can flip $0.45 into a reliable support level, it could initiate a rally toward $0.51 and beyond, especially if the altcoin season intensifies.
However, if holders begin to exit their positions prematurely, OKX:PIUSDT could slip back toward $0.40 . Such a move would invalidate the bullish scenario and place the altcoin at risk of retesting its historical low.
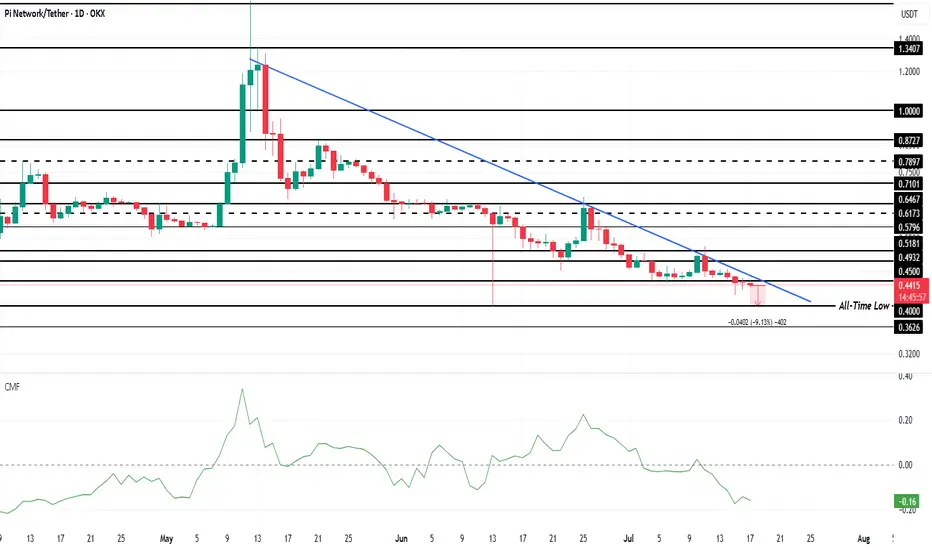
Pi Coin Continues To Bleed Money As Skepticism Hits 3-Month HighOKX:PIUSDT is currently trading at $0.44, just 9% above its ATL of $0.40 . The altcoin has been stuck in a downtrend for the past two months, and the lack of support could lead to further declines. As investor sentiment continues to erode, Pi Coin could soon test its ATL , with the potential for further losses.
The Chaikin Money Flow (CMF), which tracks the flow of money into and out of an asset, has dropped to a 3-month low . This indicates that OKX:PIUSDT is experiencing a significant outflow of capital, with more money leaving the coin than entering .
With the bearish sentiment and technical indicators pointing to a downtrend, OKX:PIUSDT may struggle to find support in the near future. If the altcoin loses its support at $0.40, it is likely to drop to the ATL of $0.36 . This would mark a significant loss for holders who have seen their investments lose value over time.
However, if the investor sentiment shifts and OKX:PIUSDT is picked up at lower prices, there may be a chance for recovery. A positive change in momentum could be signaled by Pi Coin breaching the $0.51 resistance level and flipping it into support . This would invalidate the bearish thesis and open the door for potential price gains.
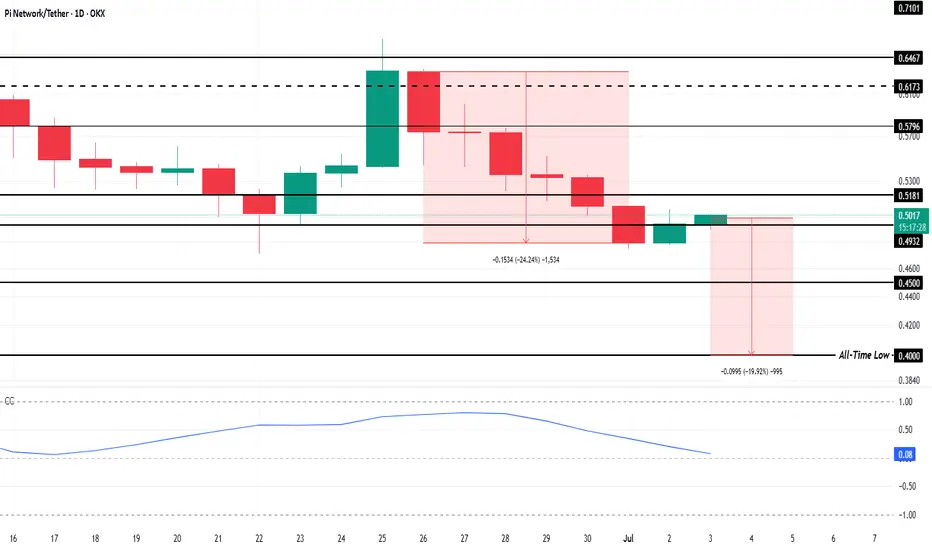
Pi Coin Closes In On All-Time Low; Bitcoin ResponsiblePi Coin’s price is currently hovering around $0.499, which is approximately 20% above its all-time low of $0.400. However, the overall market environment suggests further decline may be imminent. With continued bearish sentiment and decreasing confidence in Pi Coin , the altcoin could struggle to maintain its current levels.
Furthermore, the correlation between the Pi Coin and Bitcoin has steadily decreased. Currently, it is just 0.07, a stark contrast to the positive relationship the two coins once shared.
A low or negative correlation means that Pi Coin is moving independently of Bitcoin. This is concerning for investors who have relied on Bitcoin’s momentum to drive altcoins like Pi forward.
If Pi Coin loses the support level of $0.493, it may drop further, potentially testing the $0.450 mark. A sustained decline below this support would make Pi Coin vulnerable to hitting its all-time low again. The ongoing outflows and negative market sentiment only add pressure to Pi Coin’s price, keeping it on a downward trajectory.
However, should the altcoin experience a shift in momentum, Pi Coin could find demand from investors looking to capitalize on a potential recovery. If the coin breaches $0.518 and flips into support, it could open the door for a price rebound. A reversal would allow Pi Coin to regain investor confidence and potentially invalidate the current bearish outlook.
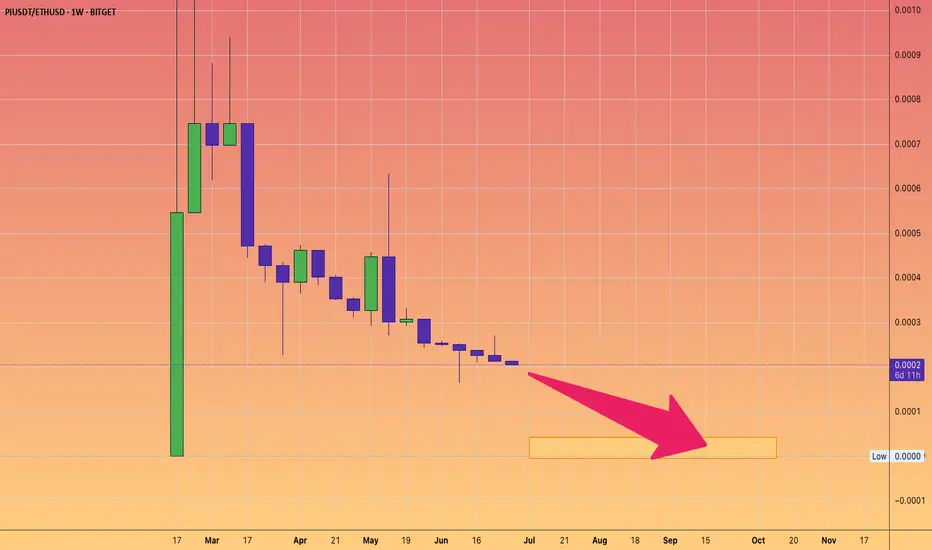
DON'T BUY Pi Network. It's a PUMP and DUMP.But feel free to short it if you desire.
This is Pi v ETH chart
It will continue it's trend to near ZERO.
Market makers will keep dumping into oblivion.
Pi Network at the cliff edge ?SInce there a lots of speculation about Pi coin, people are still doubt about it and beliving that Pi coin will bankrupt. No real CGV price USD 314,159 will be done somewhare 10 years ahead, the cummunity of Pi pioneers getting more weaker and no trust with the project.. Eventually Pi coin end like a shit coin dies in the blockchain space with no value. Floating in the space with tears and no hope.....
BUT !!
The awaitting news this 28th June 2025, will it change on more again? Or just a pity small news that no changes at all, like the Pi core team does when 6 years past, the project phase. Lies with lies.. and more lies ahead ? Just stay tune, keep mining, and no body realy knows what in the future.. Baba Vanga never told about Pi Coin, only the Simpson was telling about the Pi.

Pi just making Strong trendline liquidity targeting 0.96-0.99Hello traders PI is technically bearish but having strong trendline luqiidity as you can see on chart clean targeting 0.96-0.99
always enter after risk management

PI in coming Weeks ...Finally, this pattern was broken and had a positive impact, leading to significant growth. Now, with a slight price correction, higher price levels can be reached.
Stay Awesome , CobraVanguard

PIUSDT Daily Technical AnalysisPIUSDT Daily Technical Analysis
Pi Network Coin Indicators Are POSITIVE.
The price has broken above the 21-day moving average and successfully held above it. Currently, Pi Network appears to be targeting the $0.905 resistance level. After a wave of profit-taking, its recovery has increased the likelihood of continued positive price action. Resistance levels will be monitored closely. Indicators have turned positive from lower levels and are now pointing upward.
Resistance Levels: 0.900 – 0.963 – 0.999
Support Levels: 0.830 – 0.810 – 0.787
Positive news from the Pi Network team could support further upward price movement. Accumulating Pi Network Coin at these price levels for long-term investment might be considered potentially profitable. However, the decision is entirely yours. This is not financial advice. In the long run, Pi Network Coin may test the $3 levels again — or it might remain at a lower price range.
NOT FINANCIAL ADVICE
The information, commentary, and suggestions provided here do not constitute investment advice. Investment advisory services are offered only through a formal agreement with authorized institutions such as brokerage firms, portfolio management companies, or non-deposit banks.
The content on this page reflects personal opinions only. These views may not align with your financial situation or your risk and return preferences. Therefore, investment decisions should not be made solely based on the information provided here.
If you’d like to stay updated on our technical analyses — whether positive or risky — please follow and like us. We’d really appreciate your support!

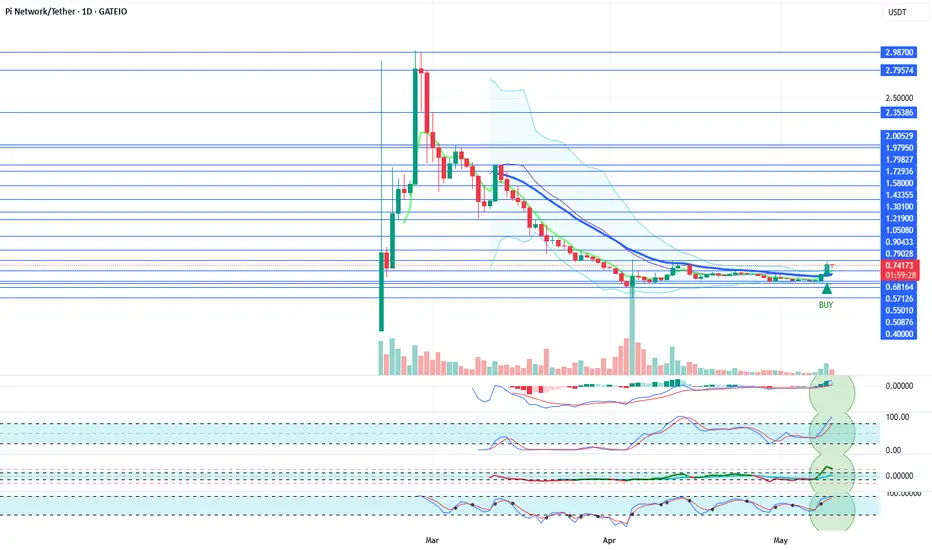
PIUSDT Daily Technical AnalysisPIUSDT Daily Technical Analysis
Pi Network Coin indicators are POSITIVE.
It has broken above the 21-day moving average and managed to stay above it.
The announcement that the Pi Network team will make about its ecosystem on May 14th could significantly benefit the project and increase activity around the cryptocurrency.
Resistance: 0.79028 - 0.90433 - 1.05080
Support: 0.68164 - 0.57126 - 0.55010
New and positive news from the Pi Network team could support a price increase.
At these levels, accumulating Pi Network Coin for long-term investment could be considered potentially profitable. The decision is yours. This is not investment advice.
In the long run, there is a possibility that Pi Network Coin could retest the $3 levels.
For users who use the Pi app and hold locked Pi Network Coins, if there is no urgent need, they may consider re-locking their coins for another 2 weeks. They can continue this strategy by monitoring the price every two weeks.
In the long term, the probability of the price reaching much better levels remains high.
THIS IS NOT INVESTMENT ADVICE.
The information, comments, and suggestions here do not fall under investment advisory services. Investment advisory services are provided under an agreement between clients and authorized institutions such as brokerage firms, portfolio management companies, and non-deposit banks.
The content of this page reflects only personal opinions.
These views may not be suitable for your financial situation or your risk and return preferences. Therefore, investment decisions should not be made based solely on the information and content on this page.
We’d appreciate it if you could follow and like us so you don’t miss our analyses with positive or risky technical indicators.
PI Testing Red Resistance – Breakout Potential!🚀 NASDAQ:PI Testing Red Resistance – Breakout Potential! 📈
NASDAQ:PI is testing the red resistance zone again. If the price breaks through, the first target could be the green line level! 📊
Let’s watch this breakout unfold! 💼💸

PIUSDT Daily Technical AnalysisPIUSDT Daily Technical Analysis
Pi Network Coin indicators are POSITIVE.
It has broken above the 21-day moving average and managed to stay above it.
The announcement that the Pi Network team will make about its ecosystem on May 14th could significantly benefit the project and increase activity around the cryptocurrency.
Resistance: 0.79028 - 0.90433 - 1.05080
Support: 0.68164 - 0.57126 - 0.55010
New and positive news from the Pi Network team could support a price increase.
At these levels, accumulating Pi Network Coin for long-term investment could be considered potentially profitable. The decision is yours. This is not investment advice.
In the long run, there is a possibility that Pi Network Coin could retest the $3 levels.
For users who use the Pi app and hold locked Pi Network Coins, if there is no urgent need, they may consider re-locking their coins for another 2 weeks. They can continue this strategy by monitoring the price every two weeks.
In the long term, the probability of the price reaching much better levels remains high.
THIS IS NOT INVESTMENT ADVICE.
The information, comments, and suggestions here do not fall under investment advisory services. Investment advisory services are provided under an agreement between clients and authorized institutions such as brokerage firms, portfolio management companies, and non-deposit banks.
The content of this page reflects only personal opinions.
These views may not be suitable for your financial situation or your risk and return preferences. Therefore, investment decisions should not be made based solely on the information and content on this page.
We’d appreciate it if you could follow and like us so you don’t miss our analyses with positive or risky technical indicators.

PIUSDT Daily Technical AnalysisPIUSDT Daily Technical Analysis
Pi Network Coin indicators are POSITIVE.
On April 14th, Pi Network Coin faced a strong sell-off after failing to break above the 21-day moving average (0.75121), dropping down to the support level at 0.59073 before attempting to recover. If this support holds, it may test the 21-day moving average (now at 0.71713) again. If it can rise above this level, it will also break through the 0.69100 resistance at the same time. Overall, we can say that Pi Network Coin has halted its downtrend and increased the probability of a new upward move. Positive news from the Pi Network team could support a price increase. At these price levels, accumulating Pi Network Coin for long-term investment might be a reasonable decision. The final decision is yours. In the medium term, there's also a possibility that Pi Network Coin could retest the $3 level.
For users of the Pi app who have locked coins, if there's no urgent need, they can choose to relock their coins for another 2-week period instead of selling. They can then track the price every two weeks and decide to relock again if appropriate. The long-term potential for the price to reach much higher levels still remains strong.
THIS IS NOT INVESTMENT ADVICE.
The information, comments, and recommendations here do not constitute investment advice. Investment advisory services are provided within the framework of an agreement to be signed between the investor and brokerage firms, portfolio management companies, or non-deposit-taking banks. The content shared here reflects only personal opinions. These views may not be suitable for your financial situation, risk, and return preferences. Therefore, no investment decisions should be made solely based on this content.
If you'd like to avoid missing out on our technical analyses with positive or risky indicators, please follow and like us — we'd appreciate your support!

PIUSDT Daily Technical AnalysisPIUSDT Daily Technical Analysis
Pi Network Coin indicators are POSITIVE.
After experiencing a sharp decline, Pi Network Coin started showing sideways price movements following the positive action on April 5. Currently, it is trading above the support level of 0.5087. With today’s positive movement, a slight increase in volatility is also observed. If the positive sentiment in the cryptocurrency market continues, Pi Network Coin is likely to show upward movement as well. For stronger support and bullish momentum, it is important for the coin to break through the resistance levels at 0.6910 and 0.7711. Additionally, if it can break above the 21-day moving average around 0.8060, it may gain strength in the medium term and potentially reach back to the $1 level.
THIS IS NOT INVESTMENT ADVICE
The information, opinions, and suggestions here do not constitute investment advice. Investment advisory services are provided through an agreement between the investor and authorized institutions such as brokerage firms, portfolio management companies, and non-deposit banks.
The content on this page reflects personal opinions only. These views may not be suitable for your financial situation or your risk and return preferences. Therefore, no investment decisions should be made based solely on the information and writings on this page.
To avoid missing any of our analyses with positive or risky technical indicators, feel free to follow and like us — we would really appreciate it!

Pi Network Price tracking every two hour, bearish or bullish ?This coming week is getting more exictement will be. The Pi Coin getting more attention in crypto space, and for surely the big investors are now waitting for the curcial price to enter a buy price.
Over the past 24hr, at this writting now. Pi Coin network has reach for more 16% incresement in 24hour, and 14% invreasement in past 7 days. Bitcoin, Eht, Sol, and the rest still far behind in term of growth percentages.
If the calculation is right in June or July 2025 Pi coin will get mark of $3-4 price.
Stay in touch, get more Pi..

Eat a pie with PISo much closed narrow i mean the worlds something most narrow move you could expect

Pi Network has began to soar?Previously, Pi Network was keep on silent with the pioneers getting frustrated with declining prices. Just get reminded that Pi core team already mention that keep posted any NEWS coming. They are getting more working hours more than we had. So, pioneers just keep on what your doing daily, let the team core doing their part.
Global payments company BANXA has made a big splash by purchasing over 30.5 million Pi Coins, worth around $19 million. But this isn’t just another crypto deal—it’s a clear sign that major players are starting to take the Pi Network seriously as a future leader in digital payments.
With this move, BANXA now lets users buy Pi directly on its platform and send it straight to their wallets. This makes it much easier for users to access Pi, especially as the community keeps growing.
BANXA’s purchase isn’t just about owning Pi—it’s a vote of confidence in the entire Pi Network. It shows that Pi is no longer just an experiment, but a growing digital economy with real-world potential.
By supporting direct purchases and improving infrastructure, BANXA is helping Pi shift from a mined-only coin to one that has real value in the market.
This is a new steps in the crypto digital payment to all nation wide, with uncertain economy crashing today lots of countries are seeking the safest way to sustain economy. The traditional way of economy has getting older and slower.
My personal opinion is, Trump's crypto team now silently work closely with Pi core team to develop a new bond tie of digital economy, and will makeing a huge and powerfull worm hole of economy, that may suck any all kind of economy into it. Looks like a Si-Fi movie.. Lol..
The chat can be automaticly updated in every two hours, and I try to keep a new updates regarding Pi Coin , for the sake of Pi Pionners movement and Pi coin awarensess. Keep watch closely until th cup and handle chart pattern completed.

Trading opportunity for PIUSDTBased on technical factors there is a Buy position in :
📊 PIUSDT
🔵 Buy Now
🪫Stop loss 0.47000
🔋Target 0.99000
📏 R/R 3,3
💸RISK : 1%
We hope it is profitable for you ❤️
Please support our activity with your likes👍 and comments📝

Pi network is trying hard.I know recently the Pi pioneers are getting mad because of the prices are getting lower, be chill, be cool guys.. that is the process to making a new high and lows. It has to be that way in the market. All what we need it patients and time, the rest let the news and core team make it happen.
According the chart pattern, we need to wait the breaking of 4hour chart structure bearish patten to be broke, and waitting the next equil to break up. Foresee if the equil is brok, we will see the sunlight of $1.00 mark up.

Breaking: $PI Dips 18% Today, Reaching New All-Time Low The price of the notable crypto asset NASDAQ:PI saw a nosedived today plummeting 18% reaching a new all time low price albeit the general crypto landscape is in a bloodbath with CRYPTOCAP:BTC dipping to $81k pivot similarly assets like CRYPTOCAP:ETH , CRYPTOCAP:SOL , $TRUMP and a whole lot of tokens saw a massive selling spree except for NYSE:FUN token that surged 55% today.
As of the time of writing, NASDAQ:PI is down 13% with the RSI at 21, this is hinting at a bullish reversal prior to the falling wedge pattern depicted in the chart. Other factors that attributed to the crypto currency and stock market downturn is the Donald Trumps' tax Tariff edict leading to Over $1.65 trillion wiped out from US stock market at open.
What Is Pi Network?
Pi Network is a social cryptocurrency, developer platform, and ecosystem designed for widespread accessibility and real-world utility. It enables users to mine and transact Pi using a mobile-friendly interface while supporting applications built within its blockchain ecosystem
Pi Price Live Data
The live Pi price today is $0.568544 USD with a 24-hour trading volume of $437,786,014 USD. Pi is down 16.31% in the last 24 hours. The current CoinMarketCap ranking is #27, with a live market cap of $3,862,744,520 USD. It has a circulating supply of 6,794,101,040 PI coins and a max. supply of 100,000,000,000 PI coins.
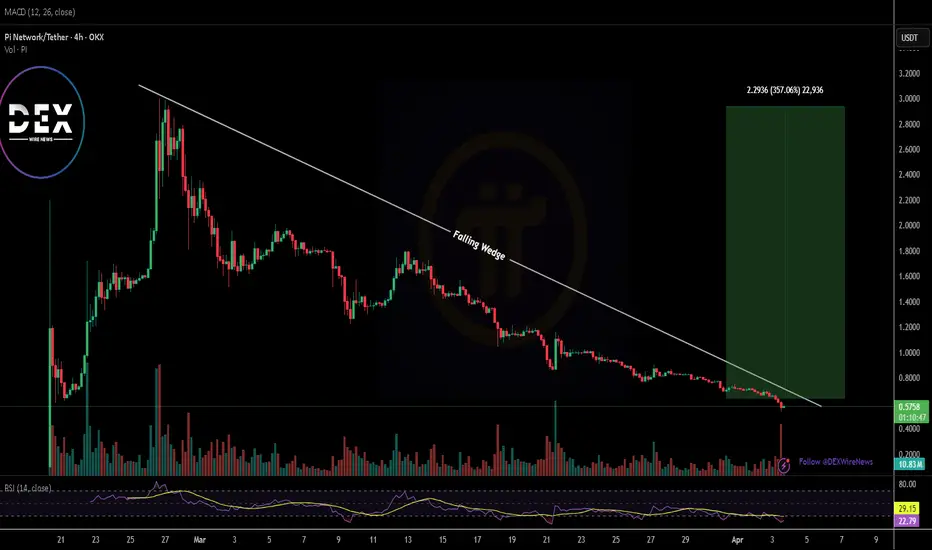
Just In: $PI Dips 6% Losing The $1 Pivot- Is There Still Hope?The price of the crypto currency NASDAQ:PI saw s noteworthy dip today, down by 6% approaching All time Low (ATL). With massive selling pressure, NASDAQ:PI has lose the $1 pivot to the bears.
However, with the appearance of a falling wedge, it clearly hints at an impending bullish reversal on the horizon with a speculated 350% surge albeit the crypto is having its own fair share of the marker's volatility.
With the RSI at 31 further hinting at a trend reversal, a breakout might be lurking around the corners.
Pi Price Live Data
The live Pi price today is $0.678989 USD with a 24-hour trading volume of $213,832,968 USD. Pi is down 5.03% in the last 24 hours. The current CoinMarketCap ranking is #26, with a live market cap of $4,612,460,558 USD. It has a circulating supply of 6,793,134,138 PI coins and a max. supply of 100,000,000,000 PI coins.

Chaos to Clarity: Mastering the Discipline Mindset5min read
Looking back on my journey as an investor, I can see how much my mindset shaped my path. When I first started, I was a mess—chasing every hot tip, jumping into trades without a plan, and letting my emotions call the shots. I’d feel a surge of excitement when price spiked, but the moment it dipped, I’d panic and sell, locking in losses. It was a chaotic rollercoaster, and I was losing more than I was gaining. I knew something had to change, but I wasn’t sure where to begin.
One day, I took a step back and really looked at myself. I realized the market wasn’t my biggest problem—I was. I was reacting to every little fluctuation, letting fear and greed drive my decisions. I started paying close attention to how I felt when I made trades. Was I anxious? Overconfident? I began noticing patterns. When I was stressed, I’d make impulsive moves that almost never worked out. But when I was calm and focused, my choices were better, and I’d often come out ahead. That was my first big revelation: my state of mind was the key to everything.
I decided to get serious about controlling my emotions. I started small, setting strict rules for myself. I’d only trade when I was in a good headspace—calm, clear, and ready to stick to my plan. If I felt off, I’d step away from the screen, no exceptions. It was tough at first. I’d catch myself itching to jump into a trade just because everyone else was talking about it. But I learned to pause, take a deep breath, and check in with myself. Over time, I got better at staying steady, even when the market was a whirlwind.
I also realized how much my beliefs were holding me back. I used to think I had to be in the market constantly to make money. If I wasn’t trading, I felt like I was missing out. But that mindset just led to burnout and bad calls. I started to change my thinking—I told myself it was okay to sit on the sidelines if the conditions weren’t right. I began to see that success wasn’t about being the busiest; it was about being the smartest. I focused on quality over quantity, and that shift made a huge difference. My wins started to outnumber my losses, and I felt more in control than I ever had.
One of the toughest lessons came when I stopped blaming external factors for my failures. If a trade went south, I’d point the finger at the market, the news, or even the system I was using. But deep down, I knew that wasn’t the whole truth. I had to take responsibility for my own actions. I started treating every loss as a chance to learn. What was I feeling when I made that trade? Was I following my rules, or did I let my emotions take over? By owning my mistakes, I began to grow. I became more disciplined, more aware of my own patterns, and better at sticking to what worked.
I’m not going to pretend I’m perfect now—I still make mistakes, plenty of them. At the beginning of this week, I came into trading loaded with personal problems from real life. I didn’t even pause to clear my head; I just dove straight into the charts and started opening long positions without much thought. By Friday, I realized what I’d done—I’d let my distracted, emotional state drive my decisions. So, I closed all my positions except one, cutting my losses quickly and stepping back to reassess. That’s what’s changed: I recognize those mistakes almost immediately now. I don’t hang on to them or let them spiral. I catch myself, fix the problem fast, and move on without beating myself up. That ability to pivot quickly has been a game-changer. I’m not stuck in the past anymore—I’m focused on getting better with every step.
Over time, I learned to tune out the noise and focus on what I could control. I stopped worrying about what other people were doing and started trusting my own process. I’d remind myself that investing isn’t just about the numbers—it’s about the person behind the trades. The more I worked on my mindset, the more consistent my results became. I learned to stay present, keep my emotions in check, and approach every decision with a clear head. That’s what turned me into the investor I am today—someone who’s not just chasing profits, but building a sustainable, successful approach to the markets, mistakes and all.
