Pin Bar
Bollinger confirms with price actionHow do you know if a reversal is likely to take place on support?
1. The bottom bollinger is pinned on a support level
2. Price action buy signal
This setup is a bit more complex because of the resistive trend line drawn, once that breaks its adios!
Don't invest what you can't afford to lose. This is not investment advice. Subjective view/report of a financial product only.
You can learn price action trading at no cost. Join my mailing list to receive more information zc.vg
Join me in Forex Bootcamp for live updates using the link below.
DISCLAIMER
All information published within this website is purely for educational purposes and offers no guarantees. Profit Fx, Forex Bootcamp and any of its associates cannot be held responsible for any trades that you have executed in any way whatsoever. Please familiarize yourself with the relevant risks involved when trading forex, CFD’s and other products. Any trading is done solely at your own risk. Profit Fx, Forex Bootcamp and any of its associates are in no way employed by any broker or any other legal entity. All information published within this website does not constitute advice, but rather objective information about a financial product and analysis or report of a financial product.
Doji signalA doii = indecision
Indecision on support = buy signal
The principal for this type of setup entails placing the stop a few pips below the doji. The profit target must be at least double the risk and the up side potential here is MUCH more than the provisional target.
Don't invest what you can't afford to lose. This is not investment advice. Subjective view/report of a financial product only.
You can learn price action trading at no cost. Join my mailing list to receive more information zc.vg
Join me in Forex Bootcamp for live updates using the link below.
DISCLAIMER
All information published within this website is purely for educational purposes and offers no guarantees. Profit Fx, Forex Bootcamp and any of its associates cannot be held responsible for any trades that you have executed in any way whatsoever. Please familiarize yourself with the relevant risks involved when trading forex, CFD’s and other products. Any trading is done solely at your own risk. Profit Fx, Forex Bootcamp and any of its associates are in no way employed by any broker or any other legal entity. All information published within this website does not constitute advice, but rather objective information about a financial product and analysis or report of a financial product.
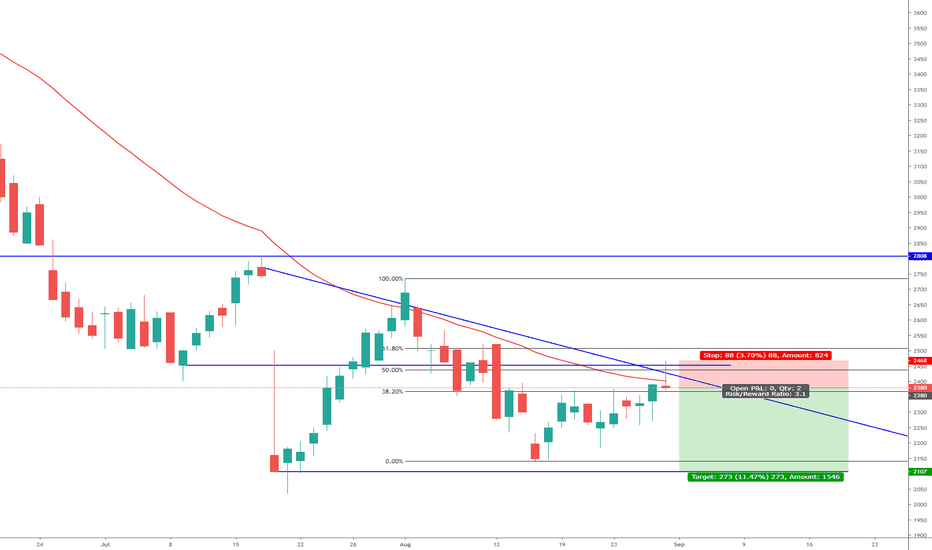
US2000 Downtrend ContinuationPrice action analysis identified US2000 downtrend continuation and short opportunity. Reversal pin bar trigger, confluence with; weekly downtrend, rejection of falling channel resistance, rejection of 50 WMA, rejection of previous horizontal support/resistance and rejection of 38% fib. Trade subject to price rising into sell limit pending order.
ASC Asos Short Opportunity Price action analysis identified LSE:ASC (ASOS) downtrend continuation and short opportunity. Reversal pin bar candle trigger, confluence with; rejection of falling trend line, rejection of 50% fib retracement, rejection of 50 WMA and rejection of previous support becomes resistance.
AUDUSD - STRONG DROP - EXPECT COUNTERATTACK After eleven days strong drop, Finally AUD printed a pin bar. 0.68 level is the lowest level since January 2016. Probably Counter attack will come at this point. Price could break hourly Down Trend and test Daily down trend. Chase for coming candles.
Entry Long : 0.68279
Stop Loss : 0.67443
Take Profit 1: 0.68843
Take Profit 2: 0.69543
This is not an investment advice. Investment is your own choice.
AUDUSD AT 80% !!!
Nice pinbar formed on Friday at 80% retracement. I think it is a good time to buy against otherwise strong short term bearish move. It came out of Elliott triangle, so I assume it is the end of the cycle. Price action in channel is choppy and at the lower trendline, the last move is extended. The price should hit T1 soon.


