Pin Bar

USDCHF 2 Days Pinbar Near Daily Resistant
There are 2 pinbars in D1 candle chart.
The position of this pinbars near resistant area.
In Asia Session I believe the price will goes up little bit.
The strong move usually will come in cross London and New York session.

XAUUSD hourly hammer after pullback to 4hr demand zoneThere are still two days left before this inside month breakout ends.
Here we got this nice little pullback to previous 4hr demand zone,
Also, it has a nice hourly hammer as a confirmation entry!
Kinda a worth taking long!
Let's see how it goes!

EUR/USD Short Setup Bearish momentum to continue even further, 20 EMA on H4 acting as a dynamic resistance for this pair. We can see it bounce off both the trend line and EMA with a pinbar rejection candlestick.

IS A RELIEF RALLY IN THE CARDS FOR THE FTSE 100If you're anything like me, as a trader you likely have a traded instrument that is kind of favourite. For me it is the FOREXCOM:UKXGBP mainly on account of the fact that I cut my trading teeth on this index. So if indices are a part of your portfolio, this could be a profitable opportunity.
This index (like many others and the Equities they derive their value from) have been taken quite the beating of late. That said as we all know what goes down must invariably bounce... The million dollar question we all seek though is when and how high.
Looking at this index from the perspective of the Daily Charts, we have now come back to retest previous structure lows established prior to that massive rally that saw the index achieve all time highs.
As we have done so, six things have caught my attention:
1. The index has put in quite the pretty pinbar/hammer candle at structure support (look leeeeft, structure leaves some beautiful clues)
2. In the process of doing so, we can see some Bullish Divergence (Lower lows in price action, Higher Lows in Stochastic)
3. Depending on your rules for this pattern, we have just completed a weekly Bullish Bat Pattern
4. There is potential Bullish Divergence setting up on the Weekly Charts (though there is still room for confirmation)
5. We have a harmonic Equal Measured Move (E.M.M) to the Weekly Bat Pattern completion, though there is little in the way of confluence
6. Dropping down to the 4H Lower Time-frame, we have again, Bullish Divergence but this time coupled with a Double Bottom at the Daily Structure Support level, but more interestingly, holding above the Weekly Bull Bat Pattern completion level.
I would dare say that the stars may be aligning on this one for a short term relief rally for this index as we edge closer to the end of the year.
That all being said, I see the Daily Structure support level as a key decision point for this market so, I would be a tad conservative in my target estimates using the 38.2% and MAYBE the 61.8% retracements as potential profit taking levels, in anticipation of this market coming back to retest and possibly reassert bearish dominance at the lows.
Not withstanding, based off a Weekly pattern analysis, no matter how conservative the targets, this could still prove to be a nice earner if my prediction is correct and one can obtain a good entry reason with a decent reward to risk profile.
Good luck and stay disciplined and safe in your trades as we come to the end of the month and the years end if you are able to get involved in any decent trades.

Do you even...Pinbar?Can you figure out the differences in the three pinbars highlighted...bearing in mind that the shape, length, or colour of the pinbar does not matter in this case.
Pinbars occur in the market as a result of two scenarios:
1) When institutional traders place large positions in order to reverse what we call a "trend"
2) When institutional traders take profit off existing trades, this action reduces the "volume" within a candle...hence the wick.
Comment if you have questions about pin bars.

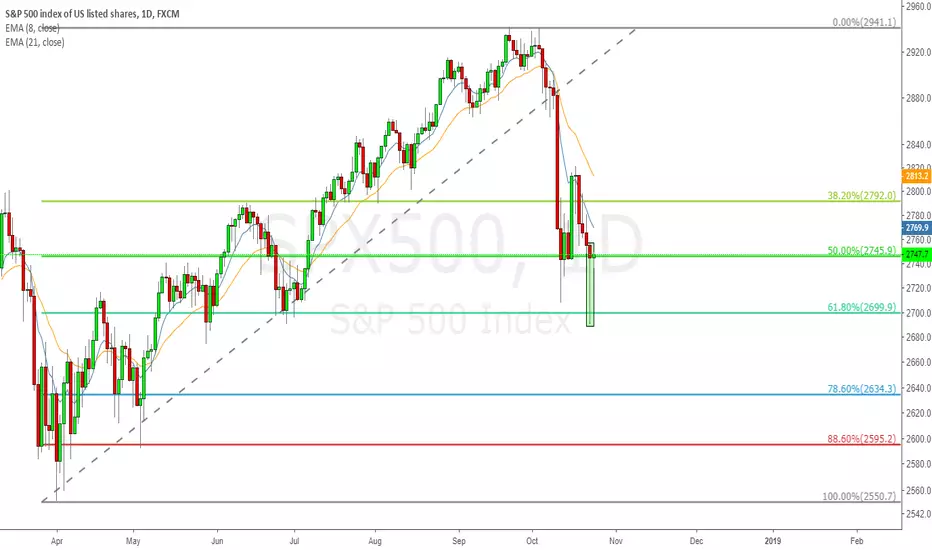
SPX500 daily 0.618 and hammer combination longA very very important set-up that I believe stock traders over the world are talking about how to deal with this daily hammer.
For me, quite simple that it's almost a perfect combination.
Whatever the result is, this set-up definitely worth some long trades!
Breakout, pullback, intraday momentum trades, and etc...
Also I'll take this perspective into individual stocks to look for buy-low opportunities!
Let's see how it goes!
Daily hammer off Fib supportFine bullish hammer (pinbar) off 38 Fibonacci support. There are bullish engulfing and bullish harami patterns at previous candles as well. I expect price to shoot to the next Fib extension. Trendlines after CLOSE. MFI (14) oscillator confirms long position( turned from oversold up).

EurUsd long setupEurusd long setup. Beatiful pinbar on the hour chart on a trendline and support level.

GBPAUD bouncing off its trend linePin Bar rejected at major support level, trend line and its FIB 50% level.
Looking for another bullish entry upon breakout of its Pin Bar formation

AUD/CAD (Daily Chart) - One More Leg Down?This pair has fallen quite a bit, but it looks like it might still have one more leg of decline left.
After bouncing up from the strong support level, prices were unable to stay up long, and ultimately formed a bearish pin bar.
Since prices were rejected on the upside, there is a strong possibility that prices will head down to test the support again.

XRP Buy ScenarioAll of the Details are on the Chart this time,
Trying something New!
Thanks!
The Ozark Trader.

AUDUSD 1H PTICE ACTION PIN BAR STRATEGYStep 1: Find a Pin Bar On Your Chart
*Note This is a stock price action strategy, and a forex price action strategy. I will use a currency pair as the example. Price action charts are with any market and timeframe.
What you need to do first is identify a pin bar that has formed.
Step 2: Look for Past Price Action to Determine Why The Pin Bar Formed.
Why did the reversal suddenly hit a price and then continue back to the upside?
Let’s zoom out a bit on this one hour chart and see if we can see anything that tells you what happened.
Note** you can either look at the current time frame you are on( in this case 1-hour time period) or bump up one or two periods to gather information.
This is what Price Action is all about. No two trades will be the same. However, we can take what we have learned from the past and make the best judgment as to where the price may be headed in the future.
You are essentially like a detective when you trade price action. The point is to gather many pieces of evidence to back up your conclusion. You are trading with confluence. Sometimes simple is best. Study the charts and form an educated conclusion as to what happened and where the price will go.
Step 3: Trade entry
You just enter the trade 2-3 pips from the break of the nose of the pin bar.
Step 4: Stop loss
Place the stop loss 3-5 pips away from the wick. The end of the wick will be a support area. So if this is broken the trend may continue downward. Which is why you place your stop 3-5 pips away from this.
Step 5: Exit Strategy
Your exit strategy will be when you hit the first level of support or resistance on your chart. Price will hit a point and stall out. Once we see the price action stalling out, we exit the trade immediately.

Possible short continuation on AUDUSDThere is a with-trend pin bar on resistance with confluence as the wick is touching the 21 and 8 SMA.
I have put in a sell on stop below the low of the pin bar at 0.71983.
Targeting 2R at the next support level with a stop above the high of the pin bar and above the resistance level.

DXY - Bearish pattern forming off of key resistance levelA large bearish pinbar is currently forming off of a key resistance level. Keep in mind that there are a few hours left in the market so this pattern will not be confirmed until it has fully formed as a bearish pinbar and today's candle has officially closed. If the candle does close the day as a bearish pinbar then we could see price rotate lower over the next few weeks. If the candle closes as a bullish candlestick, there is still opportunity for a new bearish pattern to form but we could see price rotate even higher towards the 97 range. How today's candlestick finishes forming will tell us a lot.

Education post 1/100 - How to trade pin bars?The Pin Bar Setup
I bet you have seen many pin bars on your Forex charts. Maybe you haven’t been aware that you are looking at a pin bar formation, but you most likely have come across this candle on the chart
Bullish Pin Bar
A valid, tradeable bullish pin bar is located at the end of a bearish trend and its lower candle wick goes below the overall price action. If you spot a bullish pin bar setup on the chart, this will setup a nice opportunity for a long position.
Bearish Pin Bar
The same is true for bearish pin bars but in the opposite direction. The bearish pin bar is located at the end of a bullish trend and its longer candle wick is the upper area. In this manner, the longer wick is sticking out above the price action. The bearish pin bar is usually a good sign of an upcoming price reversal in the bearish direction.

USDCHF Long SetupAnalysis
1. USDCHF daily candle closed as a pinbar at support (Rejection of lower price intraday)
2. Stoch/RSI showing bullish divergence as price is making lower lows which is implying weakening of sellers
3. Stoch/RSI coming out of "oversold" areas on daily chart
Trigger
Set pending buy stop on the break of the pinbar candle's highs
Trade
-Set stops below the lows of the pinbar candle and targets around 0.9700 to 0.9720.
-A solid 1:2 risk to reward ratio could be achieved as targets fall within the range.

EURUSD ShortFound a pinbar at H1 after the price touch area that I perceive as "supply zone".
Disclaimer:
I use paper trading.

BA bearish butterfly and daily shooting star combinationFirst of all, I don't really want to short this name.
But this trade is too good to ignore, a harmonic pattern and daily shooting star combination!
I won't take the trade as I don't have other conviction to short Boeing at all,
but I would very like to record this trade down and see how it goes yo!
Still, this is a better sign for the bulls to take some profit rather than for the bears to create short positions.
Let's see how it goes!

NZDJPY LongAnalysis
NZDJPY is completing a double bottom on the daily chart. Additionally, a bullish pinbar close is imminent on the daily chart.
Trigger
Once the daily pinbar closes, set pending buy stops on the break of the high of the pinbar candle.
Trade
Set targets at the 74.50 level.
Gauge price momentum (x and y axis) to determine if a break of the 75.00 level is likely for a possible retest and continuation of double bottom.

EURAUD SHORTAnalysis
-EURAUD at yearly highs.
-Bearish pinbar reversal closed on daily at resistance.
-All oscillating indicators are in overbought territory. (Candlestick patterns or price always precedes the curl back of oscillators from overbought or oversold conditions to normal conditions)
Trigger
Set pending sell stops on the break of the pinbar candle's lows.
Trade
Set stops above the highs of the pinbar and targets around 1.61 since price is likely to retest that level (previous resistance = support)
*Highest resistance shown is due to price rejection/range bound at that level from Sep 2015 to Mar 2016

EURHUF - forint will riseIt is time the forint regained its strength. Today's pinbar is a good entry point, the levels are clear.

NZDCAD LongAnalysis
1. Bullish pinbar reversal closed on daily at support.
2. Price at bottom of descending channel
3. NZDCAD at yearly highs.
4. Descending wedge ( bullish ) within channel
5. All oscillating indicators are in oversold territory. ( Candlestick patterns or price always precedes the curl back of oscillators from overbought or oversold conditions to normal conditions )
Trigger
Set pending sell stops on the break of the pinbar candle's highs.
Trade
Set stops below the lows of the pinbar and targets around 0.865 since price has a chance to stall at that level. Monitor lower time frames and see if momentum warrants extending targets.
