EURUSD SHORTEURUSD is behaving like it going to go south for a little bit, let me explain,
The price as hit a very strong resistance, the 1.10 level, and is rejecting a couple other major chart elements,
I'm going to look for entries on H8 - H12 and D1 and help EURUSD get to the 1.04 - 1.05 Level first, then back to the 1.00 Level is further selling pressure
The reasons are the following :
1) Price has rejected the psycholigical level of 1.10
2) Price has retested and rejected the Trendline of a massive correction that happened between 2017 and 2022 (the red trendline)
3) Price is rejecting the 50% Fib retracement of a the huge downtrend that occured between may 2021 and October 2022
4) All of this is confirmed by last week's closed weekly candle, that is making a beautiful pin bar, after it did a false breakout to go and get liquidities from the 1.10 Level
All for this is constituting a case in favor of a drop of the euro, I will look to short it until it shows any strong signs of reversal on the different levels mentionned above, the 1.05 level, the 1.00 level, and eventually, the 0.95 Level
Don't hesitate to leave a coment or ask if you have any question
Cheers and trade safe!!
Pin Bar

Gold - Wanna Take a Breath?! Gold has been hit pretty hard by the rise of dollar since a couple of weeks.
It broke the ascending trendline it was in since november violently, without retesting it, falling like a rock all the way to the 1800s. But now could be the time for a little push up. It could either be a retracement if gold wants to print a downtrend, in what case we would go up to make a Lower low or even a double top. Or it could be a continuation of the uptrend. Both are possible, but for now, I'm gonna play the uptrend card.
The situation :
1) We're still officially in an uptrend
2) Price is at previous support
3) It pushed away from 1800ish level,
4) It's been approaching the support in a corrective manner, a falling wedge being a sign of a bullish reversal
5) It's rejecting the 50 - 60% Fib retracement level of the massive uptrend that happened between november and february
6) Pinbar on Daily, tweezers on H12, morning star on H8
This situation is pretty similar to the one with silver. It looks pretty scary to get into a long after such a sharp move down but, what goes down must go up at some point, and even though a lot of factors are pointing into the fact that gold is changing trend right now, technically, we're still in an uptrend, so price should obey to signals going that way.
I'm going into this trade because it follows my trading plan, this isn't a matter of belief. I'm not sure what the outcome will be, and it might hit SL, but, the thing I know is that it doesn't matter. The simple reason being that, I have enought evidences in favor of taking a position, and, if I respect this rule everytime, then my outocme will be positive on the long run, so, doesn't matter if I'm right or wrong on this one, it matters if I respect my trading plan, and trade according to it.
Plan the Trade, Trade the Plan!!!
This was the last analysis for this week, I'm wishing everybody sucess for this trading week, and don't hesitate to leave your comments and opinions about my ideas, any income is more than welcome!
Cheers everyone!

Price Action Candlesticks Cheatsheet — The Best Patterns!These different price action patterns are great for various situations. They can be identified at a Lower time frame or Higher timeframe, pick a chart and start looking at the candles!
If you identify any of these in a chart you are looking at today, feel free to share them below.
Here is a little more about bullish and bearish candlesticks:
Bullish and bearish candlesticks represent opposite market sentiments in technical analysis.
They are used to identify the buying and selling pressure in a financial market, and help traders to predict the direction of price movement.
A bullish candlestick is represented by a green or white candlestick that has a long body and a short wick or no wick. A long green or white body indicates that the closing price of the asset is higher than the opening price. It signifies that buyers are in control and that there is bullish sentiment in the market.
The longer the body of the candle, the more significant the bullish sentiment.
On the other hand, a bearish candlestick is represented by a red or black candlestick that has a long body and a short wick or no wick.
A long red or black body indicates that the closing price of the asset is lower than the opening price. It signifies that sellers are in control and that there is bearish sentiment in the market.
The longer the body of the candle, the more significant the bearish sentiment.
Traders use bullish and bearish candlesticks to identify trend reversals, support and resistance levels, and to confirm other technical indicators.
When a bullish candlestick pattern appears after a series of bearish candlesticks, it may indicate a potential reversal of the trend.
Conversely, when a bearish candlestick pattern appears after a series of bullish candlesticks, it may indicate a potential reversal of the trend. No single candlestick should be used to make trading decisions, and traders should always consider other technical indicators and fundamental analysis before making any trading decisions.

AUDCAD SHORT TERM LONG POSITION IDEAThe right hand daily chart has formed a bullish pinbar rejection at a recent level the market has struggled to break. The overall trend is bearish but i am hoping for a small bounce to make a minimum of 1:2.5 RR.

MCXMCX made bullish pin bar candle on daily charts & its trading above yesterday's close with good volumes.
Could be bought with mentioned stoploss & target.

An 3W swing trade scenario w/ FibonacciHi traders. I'm bringing in this weekly chart a simple draw of a smart money strategy based on the price action with Fibonacci Retracement 14.6% key level as a worth and effective take profit. I'm using a Ehler's smoothed stochastic to show a logical possible reversal wave to come in the 3W term.

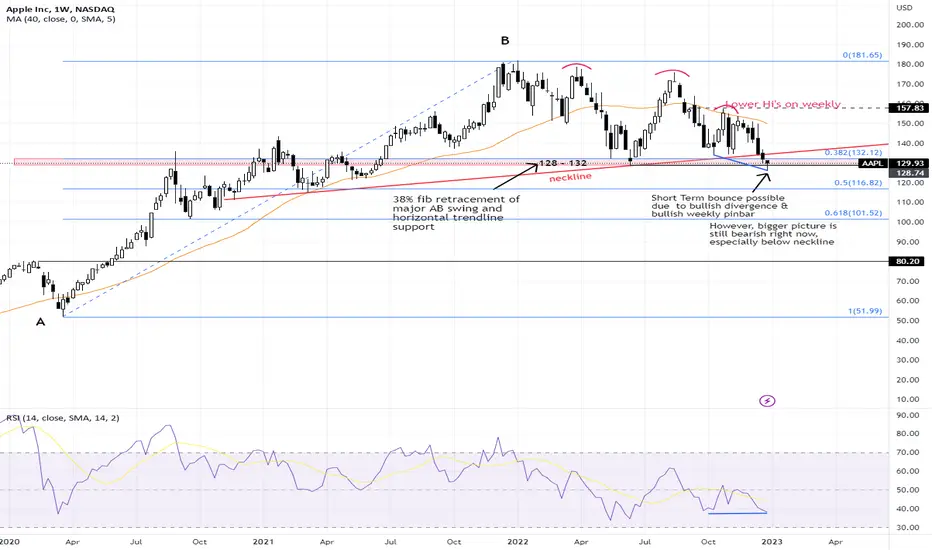
AAPL - Will support @ 128 hold?AAPL had been the most resilient among the FAANG stocks despite being in a volatile and toppish pattern for months. However it started to break below major neckline support @ 134 on 19th Dec and then an attempt to break the horizontal support @ 128.
It managed to close the month with a weekly bullish pin bar above 128 and a potential bullish divergance is also forming between price and RSI on the weekly chart. Hence a near term bounce could happen but any bounce right now is best viewed with a grain of salt until we can see change in the chart structure
Any close below 128 is potential for the bear trend to continue towards 110-115.
Disclaimer: Just my 2 cents and not a trade advice. Kindly do your own due diligence and trade according to your own risk tolerance and don't forget that money management is important! Take care and Good Luck!
GUIDE TO JAPANESE CANDLESHello everyone!
Today we will discuss JAPANESE CANDLES!
Let's try to understand what they mean and how to use this information in your trading.
LET'S GO!
Bullish and Bearish PIN BAR
A bullish pin bar is a candle with a long shadow, the body of which is located at the top of the candle.
Such a candle was formed under the pressure of sellers who were able to push the price down, after which buyers turned on, who pushed the price above the opening and were able to gain a foothold there.
This strength of buyers signals to us that sellers are losing dominance in the market and a trend reversal is possible soon.
A bearish pin bar has a mirror structure relative to a bullish pin bar.
Buyers can't keep the price high, and sellers take up the trend.
At these points, we can expect the early completion of the previous impulse and a possible trend change.
Bullish and bearish harami
Bullish harami consists of two candles: the first is a long full-bodied candle, the second is small with a small body.
After a strong downward impulse (the first candle), a sharp reversal begins (the second candle).
At the same time, the second candle often opens with a gep.
The momentum of the first candle is the last spurt of the market, after which buyers take over the market.
The gap in the opening of the second candle and the closing of the first confirms the strength of buyers.
Bear harami has a similar structure, but a mirror movement.
The last impulse of buyers, was replaced by the gep of sellers.
This sign indicates a possible reversal.
Bottom and top tweezers
These Japanese candles are characterized by two long full-bodied candles.
After the first strong impulse, there is a sharp reversal in the opposite direction.
This reversal has a huge force, as it is able not only to turn the price against the main trend, but will immediately gain a foothold low.
This figure is called tweezers, as the price pierces the level and abruptly returns back.
A very strong signal for a reversal.
Conclusion
These patterns are very popular and useful.
The ability to use them correctly in trading can bring significant profits.
These patterns help to determine the price reversal, which contributes to a better entry into the position.
Traders, if you liked this idea or if you have your own opinion about it, write in the comments. I will be glad 👩💻

Trade Ascending Parallel Channel With 3 Points + Pivot PointTrade Ascending Parallel Channel With 3 Points + Pivot Point Indicator
Connect your three points using the parallel channel. First, connect two points which are your higher lows. Next, connect the third point which is the swing high. The swing high is the higher high.
In this example, a pin bar formed at the higher low. Pin Bar wick touches pivot point level and channel support level. Volume Indicator is "green" and pin bar is "white." Conditions are great to enter the market at pin bar closing price.


The Best Pull Backs To Trade (Part One)Price pulled back to pivot point level 0.67. Price retraced 50%. Pin Bar candlestick formed at 50% retracement. Open Price and Close Price is "near" 50% retracement level as well at the pivot point level. Candlestick wick protrudes through the pivot point level and retracement level.
This is an ideal condition to enter a trade position using pivot point indicator, fibonacci retracement tool, and pin bar candlestick.

GOOG - Tide could be turningGOOG's monthly chart formed a bullish divergence and closed with a bullish "pin bar" in November. We are likely to see more upside momentum for this month, although it could pause and consolidate when it hits the near term horizontal resistence around 104-105, then may (or may not) dip back towards 93 (recently pivot low), before eventually breaking higher.
Immediately support is currently at 93. Turn cautious if it dips below here.
Disclaimer: Just my 2 cents and not a trade advice. Kindly do your own due diligence and trade according to your own risk tolerance and don't forget that money management is important! Take care and Good Luck!


A reversal on the cards for the NZDUSD?Overnight, the NZDUSD continued with the uptrend to climb steadily toward the key resistance level of 0.5950.
With no major news events today, look for the development of price action at this resistance level to signal the next directional bias. A brief reversal back down toward the 0.5850 price level could be required before further upside.
Alternatively, look for the NZDUSD to break above 0.5960 to signal a continuation of the uptrend, with the next key resistance level at 0.6080.

TCS BULLISH Pinbar at breakoutTCS very bullish at CMP 3217, SL 3160, Targets- 3400, 3500, 3700
TCS just broke out of a year long downtrend, and with less than a 3% risk, one can aim for amazing returns.
This idea is based on the pinbar on the last trading day and for a better trade, advisable condition would be a breakout above 3275 with an SL of previous swing.

MSFT- found intermediate supportMSFT gapped down into intermediate support @ 220 today (after another round of "bad" CPI report that spooked the markets) but immediately reversed to form a bullish engulfing candle on the daily chart (and a potential pin bar on weekly chart).
Bullish divergence can be seen on both the weekly and daily charts which gave more conviction to this current support @ 220 (medium term resistence turned support)
Granted that a bounce from an bullish divergence can be just a short term counter trend (in a bear market), this support at 220 is still significant unless it is breached to the downside.
Disclaimer: Just my 2 cents and not a trade advice. Kindly do your own due diligence and trade according to your own risk tolerance and don't forget that money management is important! Take care and Good Luck!

REVIEW $POOLIt's the ability to believe in the unpredictability of the game at the micro-level and simultaneously believe in the predictability of the game at the macro level that makes the casino and the professional gambler effective and successful at what they do.

Topglove. JP Morgan’s TP May “failed” this time. 1/Oct/22Topglove. JP Morgan’s Projection of RM0.45 probably “failed” this time. As other 3 major player already posing a bullish reversal setup based on Elliott wave and cycle. Just waiting for “confirmation” signal. Topglove price has just broken RM0.605 a “confirmation signal “ +++ Price of weekly Topglove, kossan and monthly Harta has formed a hammer candle/ pin bar bullish pattern possible market “price in” A.S.P ( Average Selling Price) increment lead by Topglove as “catalyst” of the beginning of long term bull trend after long term “correction “ since August/Oct 2020..

Pip Goal: 185.0 Pips (NZDCAD)Rejection Candlestick (Pin Bar) formed on the Daily Time Frame. Enter a short position.

SPY - Short term bullish - Quick TradeHello Friends,
AMEX:SPY has shed a lot of value in a week but there seems to be some good news if you're looking for a very short term bullish trade. We will have to understand supply/demand levels on multiple time frames.
In a daily TF, Price opened gap down, approached a daily/weekly demand zone and closed within top 33.3% of a candle range(Bullish Pin bar candlestick). Bullish pin bar with a good volume suggests the presence of demand. There's a gap to be filled. So our first target is at the upper bound of a gap around 373.44. I like to use anchored VWAP as a dynamic support/resistance and also as an additional confirmation for the target. In a downtrend, I drop anchored VWAP from a recent swing high to find dynamic resistance level which is currently at 386. There's a visible supply zone between 381 and 390. So if price is able to breach our first target then the next safe target would be at 381. Target levels are marked on the chart below.
Zooming into 45 minutes TF, it is visible that before price opened gap down, there was a supply zone forming. Our first target is actually a lower bound of a supply zone. Additionally, a bullish RSI divergence is also visible which is an additional confirmation for price reversal.
Similar confirmations are found in 15 minutes TF as well.
Remember, Overall market is still bearish so you have to be very nimble while trading against the trend. A good trader always find opportunity in any market conditions!
Do you agree with my analysis? Please let me know your thoughts by commenting below and follow me for more such ideas. Happy and safe trading! :)

SPX - bullish divergence (short term bounce next? )SPX closed with a small pin bar on huge volume last Friday, coupled with a potential bullish divergence between price and RSI (daily chart), it Looks like we can expect yet another bounce soon. However, divergence usually result in a short term reversal (lasting 2 or several candles) and may not translate into a longer term trend reversal.
The last 3 weekly candles of SPX has formed a broadening "pennant", a pattern that signify a market that has been highly volatile with little to show in direction in the last 3 weeks.
So while we may expect some bounce next, it is probably just more whip saws in the near term, especially when most of the market leaders (mostly the MAANGT stocks are still weak (except perhaps NFLX and TSLA) aren't showing signs of having bottomed yet.
While there may be some stocks that have started to break up from base formations, only a handful are able to successfully trend up without too much volatility.
Let's wait for S&P be able to rise above the longer term resistence line (red) eventually, then perhaps we will have a more sustainable market recovery. Meanwhile, stay safe.
Disclaimer: Just my 2 cents and not a trade advice. Kindly do your own due diligence and trade according to your own risk tolerance and don't forget that money management is important! Take care and Good Luck!

Goal: 3342.2 Units (EURZAR)EURZAR Target Price 17.731. Pin Bar tail protrudes through a previous pivot point at price 17.327.
