NASDAQ, D1 - Potential double top - risky bearish scenarioPotential double top and HSH pattern. Today candle is pinbar. Some bearish very risky counter trend scenario
Pin Bar

ROKU - on the recoveryROKU had a bullish divergence on the weekly 2 weeks ago with a bullish pin bar weekly candle.
Since then the daily has been steadily trending with large daily up candles followed by a few days of tight consolidation and then another large daily up candle (higher highs and higher lows).
I initiated a long today with a tight initial stop loss a couple of $ below today's candle low @ 320.80. Looking to scale out on the way up with trailing stops. Price targets given are just suggestions for short term traders as the stock might consolidate along these levels.
p/s watch out for earnings on 10th November. Take profit prior if uncomfortable to hold through earnings.
Disclaimer: TA is about improving our odds of a successful trade (not a guarantee). This is just my own analysis and opinion for discussion and is not a trade advice. Kindly do your own due diligence and trade

Facebook - bounce coming?FB was among the weak stocks during initial hour yesterday, losing 2.5% to a low of 317.37 before slowing gaining traction for the rest of the day, and recovering most of the initial dip to close a pin bar.
The case for a rebound soon is rather compelling due to
1. higher than average volume that formed this pin bar
2. the rebound occurred right after it tested the 200 day moving average
Hence I will long as the stock goes above pin bar high 324.5 with an initial stop a dollar below pin bar low at 317. Initial target @ 350 which is the 50% retracement up of the down swing AB (and a possible horizontal resistence there).
However there is a risk that earnings could disappoint on 25 Oct and any rebound could be short lived. Should this rebound fail, I will relook possible entries between 298 to 304 where there is a stronger zone of supports there.
Disclaimer: TA is about improving our odds of a successful trade (not a guarantee). This is just my own analysis and opinion for discussion and is not a trade advice. Kindly do your own due diligence and trade

USOIL Entry Price 81.12USOIL. Pin Bar Trade Strategy. Pin Bar candlestick wick intersects EMA 10, EMA 20, 0.236 Fibonacci Retracement Level, and Horizontal Support Resistance Level.


GBPCAD is gonna have a bullish move OANDA:GBPCAD
Hi guys , how are you ? I hope you're all fine and having a nice time .
GBPCAD is in a great zone for starting a bullish move
as we can see in the chart , the price is in an uptrend
Also there is great support level with 5 touches !
there is also a Pin bar candle which touches the support level
and also before the pin bar we saw that the momentum is changing and decreasing (becoming bullish)
what's your idea guys ???
Please write your opinion in comments for us !

LSS/USDT (Kucoin) Rebuy Opportunity with confluenceLossless made a massive pump in the last few days and correcting since reaching $0.67. Perfect time re-enter and it is preparing for the next wave.
Found support at 0.618 Fib, Found support at 21MA and forming a Pin bar what else we need?
This is not financial advise please DYOR. Next support at $0.357

How To Trade Pin Bar at the EMA 10, EMA 20, Trend Line, and GapThe confluence is:
1) Gap at 267.76
2) Trend Line
3) EMA 10
4) EMA 20
5) Pin Bar
Entry is at the closing price of the candlestick in the form of a Pin Bar. Pin Bar formed at EMA 10, EMA 20, Trend Line, and Gap.

AUDUSD - Bullish ButterflyButterfly Pattern completes at 0.7197. If the candle closes at 0.7200 will be a stronger setup for a Bullish Butterfly Pattern. Waiting for 1700(UTC+3) candle close.

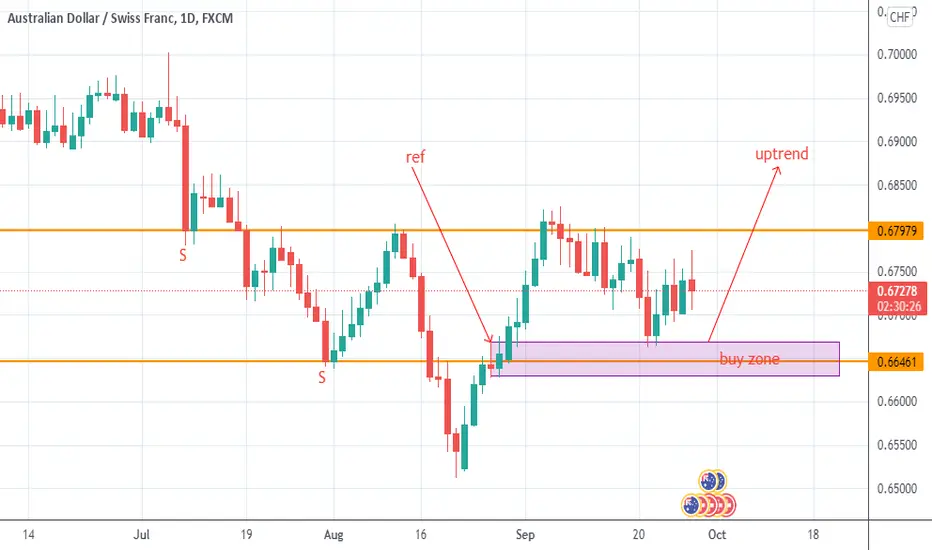
AUDCHF Uptrend Based On Daily StructureWhat I see is, current rise is from correct buy zone. And nearest resistance have been tested 2 times. There is possibility for resistance rejection, pullback then break out, OR breakout and retracement.
GBPUSD Buy Level based on Daily CandleBuy level reference based on failed bearish pinbar at daily timeframe.

USDJPY - Bearish Deep CrabBearish Deep Crab on the USDJPY H4 chart. If the candle closes below the red line which is also the HOP level of the Deep Crab Pattern. I will engage in an aggressive trade.
Let's see how the candle close at 1200(UTC+3) or 1700(GMT+8)


CADJPY - Bearish BatIt is not something new that you have a bullish setup on the USDCAD chart and a bearish setup on the CADJPY chart. This meant 1 thing, the Canadian Dollar, CAD, is on the move.
If both setups is valid, I will engage both and not cherry picking.
Any idea why I'll do that?
Comment down below
If you like to check the USDCAD chart, the link is at the bottom.

EURJPY: a pinbar where you need one!Yesterday price dropped down below 200 EMA to the support zone. Later, it moved back up again closing above EMA and within the previous candle's range.
This pinbar has three supportive factors making it more significant than any other.
► It breached 200 EMA, yet it closed above it confirming the dynamic level to be a support.
► Opened and closed within the previous candle's range => the whole downside momentum was completely absorbed within a single candle.
► Interest rates support the bullish narrative although it is 5 years since they were changed.
There is also one contrarian point that should be weighed in. Japanese Yen is usually a currency relied upon in times of uncertainty. I think we've got a lot of that lately.
Good luck!

GBPUSD - Bullish BatA Bullish Bat pattern form with a nice long shadow candle(some call it a pin-bar), pose a great buying opportunity for Trend Traders who are looking to long from the 1-hourly time frame.

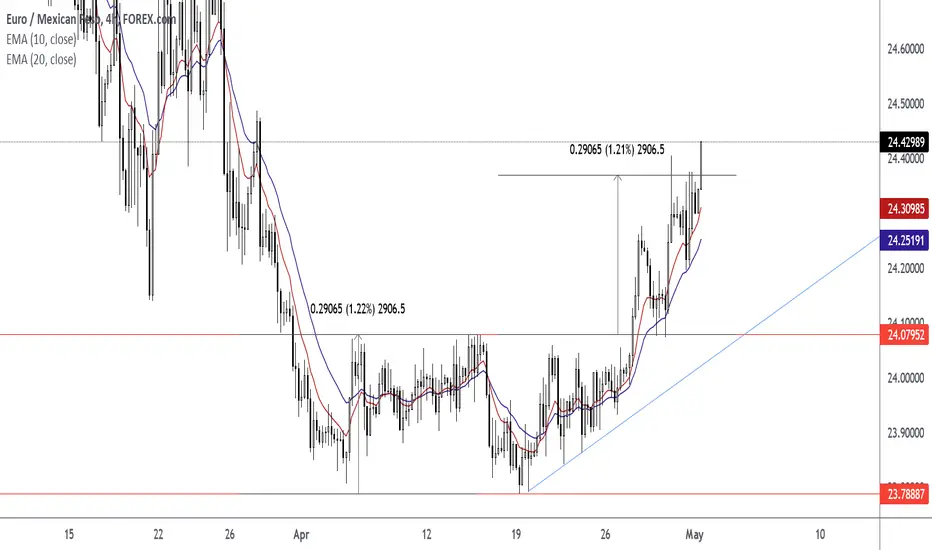
How To Trade The Ascending Triangle + Double Bottom ComboWait For The Close Above the Neckline at Horizontal Level 24.07952. After the close above level; resistance level turned support.
Wait For The Retest Of The Neckline At 24.07952. Watch For A Pin Bar or Rejection Candlestick to form at the horizontal neckline.
Enter Trade At The Closing Price Of Pin Bar or Rejection Candlestick.
Set Target Price Using Measured Objective Of Pattern. Measured Objective Is 24.37017. Measured Move Is 2906.5. Height Is 2906.5.
Exit Trade At Target Price.
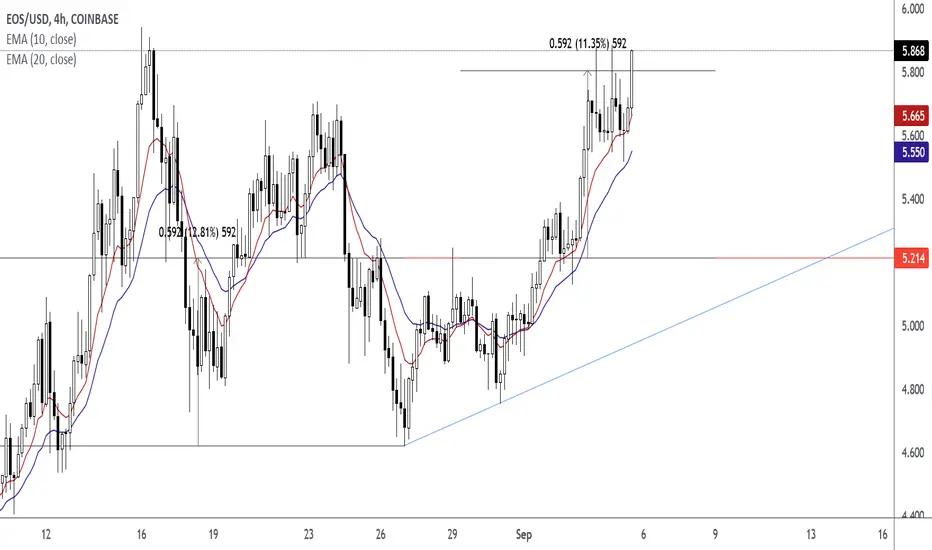
How To Trade The Ascending Triangle Trading The Ascending Triangle
Wait For The Close Above The Horizontal Level
Wait For The Retest in the form of a pin bar or rejection candlestick.
Enter At The Close Price of Pin Bar or Rejection Candlestick
Exit At The Measured Objective of Pattern. The Height of Pattern is 592.

EURJPY - Bearish SharkShark Pattern, this is what shark pattern really is. If you got stung out on the same shark pattern and once it has grown into the next entry price, the textbook case suggest that you should still engage the trade should the candlestick confirmation come by.
Compare to its peers, USDJPY, this is the more well-liked set-up as it was a trend trading setup, unlike the USDJPY, counter-trend setup.
I will have to wait for the candle to close at 9 pm (+8GMT) which is 16:00(UTC +3). If a pin bar, or long shadow I will be looking for a shorting opportunity.

NEOUSD Target Price 60.37NEOUSD Entry Price 51.66. Pin Bar Close Price is 51.66.
50% Fibonacci Retracement Level Price is 50.48.

GOLD before the FOMC MinutesToday we're expecting the FOMC Minutes, which are very likely to cause some moves in price.
In the last few days we've been talking about a possible reversal on GOLD.
This will be a good moment for such an event. We could see price fluctuating and then maybe a downfall in price.
The ideal scenario is still seeing price above 1800, then to wait for a reversal candle and then a drop from there.
We will be looking for a move down and below 1700, and if this will happen then market shouldn't break above 1830.
Follow us to see what happens next.

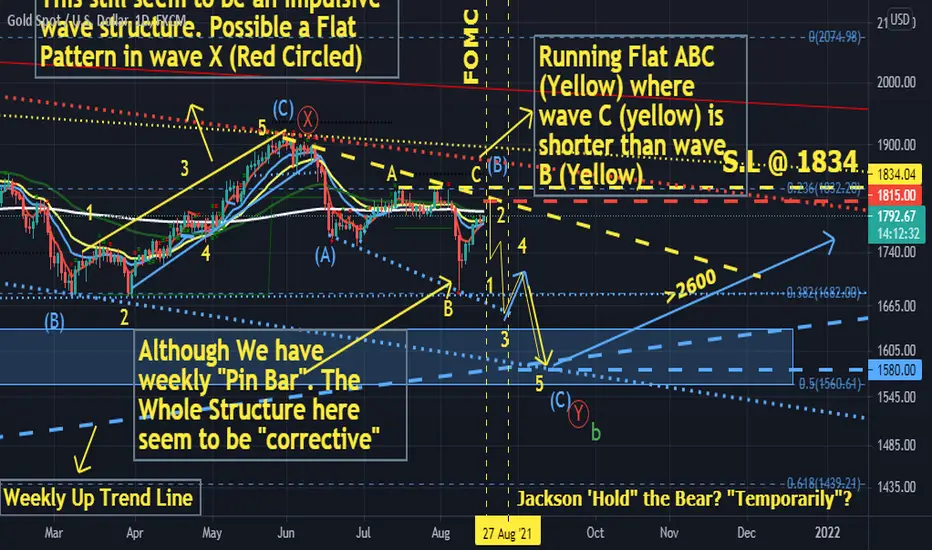
GOLD maybe @ wave C(Yellow) of flat pattern. 18/8/21GOLD possible now at wave C (yellow) of running flat pattern . Where wave C (yellow) is shorter than wave B (yellow) . Meant Theoretically.... Price Should be "capped" below 1834 for the validation of the wave structure.. Although we've "seen" a "Long Tail" "Pin Bar" on weekly chart. But Current Price Movement "Ranging " between 1834 -1680 still look "Corrective"....