"PEL is having formed a Cup and Handle pattern
*Chart Pattern Identified**:
A **Cup with Handle** formation has been identified on the daily/weekly chart of **Piramal enterprise**, signaling a potential bullish breakout. This classic continuation pattern typically leads to strong upward moves once the handle breakout is confirmed.
🔍 **Breakout Levels and Price Targets**
1. **Primary Breakout Level – ₹1275**
* This marks the neckline of the **Cup with Handle** formation.
* A confirmed breakout at ₹1275 would validate the pattern.
(based on the measured move from the depth of the cup added to the breakout point)
* Acts as a **pre-breakout resistance** or consolidation level.
* A **daily or weekly close above ₹1,275** with strong volume would indicate early momentum and buyer interest.
* **Target after this level is breached**: ₹1275 (primary breakout zone), and if sustained, an extended target of **₹1820**.
### 📌 **Technical Outlook**
| Level | Significance | Action |
| ------ | ------------------------ | --------------------------------------------------- |
| ₹1275| Cup with handle breakout | Key confirmation zone; breakout of pattern |
| ₹1820 | Extended target | Projected move after full breakout confirmation |
---
### 📈 **Trade Strategy**
* **Entry Option 1**: Anticipatory buy near ₹1,275.
* **Entry Option 2**: Breakout confirmation buy above ₹1275 with higher risk-reward toward ₹1820.
* **Volume Confirmation**: Essential at 1275 levels.
* **Stop-loss**: Dynamic trailing stop-loss below handle lows or breakout support zones depending on entry.
---
### ⚠️ **Risk Management & Considerations**
* Ensure confirmation via **volume expansion** and **daily/weekly close** above key breakout zones.
* Be cautious of false breakouts, especially if moves happen on low volume or during broader market weakness.
* Monitor sectoral momentum (capital goods, engineering, or mining equipment) as it may influence breakout strength.
Piramalenterprise

PEL !! PIRAMAL ENTERPRISES LTD appear to be in a Breakout phase This is the Daily Chart of PIRAMAL ENTERPRISES LTD.
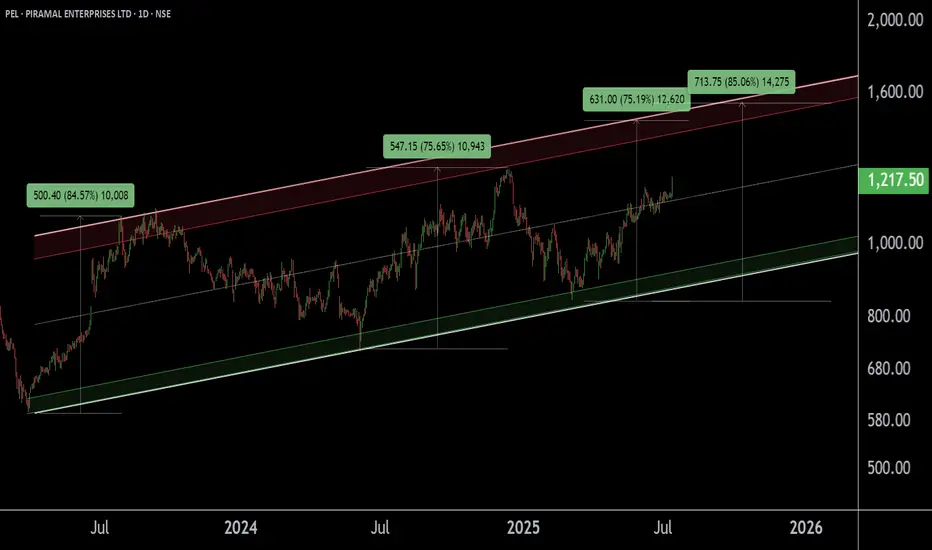
PEL is trading above the midline of its ascending parallel channel, with strong support in the ₹1080–₹1150 zone. Historically, whenever it sustains above the midline, it tends to retest the upper boundary resistance of the channel near at 1500 -1540.
If this level is sustain then we may see higher prices in PEL.
Thank You !!
PIRAMAL ENTERPRISES LTDThis is the Weekly Chart of PEL !!
PEl is moving in an Ascending Channel pattern on the weekly chart.
PEL is following a HH–HL structure in the channel in Daily chart support at 1040-1050 range, confirming a bullish trend continuation.
Based on historical price behavior, the stock has
previously delivered a 74% return from its swing low, reaching the 1500–1520 range.
Thank You!!

PEL | Breakout Setup | Short-Term Buy | Target ₹1100🟩 Trade Plan:
Buy Zone: ₹1059 – ₹1060
Target: ₹1100 (approx. 3.77% upside)
Stop Loss: ₹1037
Risk-Reward Ratio: ~2:1
Setup Type: Breakout above resistance zone (marked on chart)
Volume Confirmation: Strong bullish candle with high volume
RSI Confirmation: RSI bouncing above 60, momentum building
📈 Chart Annotations (TradingView Tips):
Draw resistance zone on 1H around ₹1060 – ₹1070 (breakout zone)
Plot EMA (9 & 21) or EMA crossover to confirm short-term bullish trend
Use RSI (14) to highlight momentum breakout
Highlight entry point, stoploss, and target with labels
Use TradingView’s “Long Position Tool” to visually display RR
For Education Purposes only

Navigating the Waves: Piramal Enterprises Technical StudyTechnical Analysis of Piramal Enterprises (NSE: PEL)
This analysis is shared for educational purposes only and should not be considered financial advice.
Overview
Piramal Enterprises has shown a promising breakout with significant volume, indicating strong bullish momentum. The Elliott Wave analysis also suggests a positive structure, pointing towards potential further gains.
Elliott Wave Analysis
Wave 1: The stock completed its first impulse wave (1) near 1,140 INR.
Wave 2: The corrective wave (2) concluded around 735.85 INR.
Wave 3: The ongoing wave is expected to be an impulse wave 3, targeting higher levels.
Current Structure
- The stock has completed the corrective wave C of (2) and is now in the early stages of wave 3.
- The recent breakout above the black trendline suggests the start of wave (i) of 3, supported by increasing volume, adding to the bullish sentiment.
Key Levels
- Current Price: 977.85 INR
- Nearest Invalidation Level: 905.00 INR
- Major Invalidation Level: 630.45 INR
Targets
- Elliott wave suggests ahead wave 3 first levels (1.0 Fibonacci Extension of Wave 1): 1,246.00
- Elliott wave suggests ahead wave 3 ideal level (1.618 Fibonacci Extension of Wave 1): 1,561.25
Conclusion
Piramal Enterprises has provided a strong breakout backed by volume, aligning well with the Elliott Wave theory. The structure indicates a continuation of the uptrend with potential targets at 1,246 INR and 1,561.25 INR. The nearest invalidation level is at 905 INR, with a major invalidation level at 630.45 INR.
I am not Sebi registered analyst.
My studies are for educational purpose only.
Please Consult your financial advisor before trading or investing.
I am not responsible for any kinds of your profits and your losses.
Most investors treat trading as a hobby because they have a full-time job doing something else.
However, If you treat trading like a business, it will pay you like a business.
If you treat like a hobby, hobbies don't pay, they cost you...!
Hope this post is helpful to community
Thanks
RK💕
Disclaimer and Risk Warning.
The analysis and discussion provided on in.tradingview.com is intended for educational purposes only and should not be relied upon for trading decisions. RK_Charts is not an investment adviser and the information provided here should not be taken as professional investment advice. Before buying or selling any investments, securities, or precious metals, it is recommended that you conduct your own due diligence. RK_Charts does not share in your profits and will not take responsibility for any losses you may incur. So Please Consult your financial advisor before trading or investing.

Trying to move and rediscover old gloryPiramal Enterprises Ltd engages in the business of pharmaceuticals and provision of financial services. It operates through the following segments: Pharmaceuticals Manufacturing and Services, Financial Services, and Healthcare Insights and Analytics. In 2011 it saw Fortune 500 ranking Piramal Healthcare in the top-50 largest corporations across India.
Piramal Enterprises Ltd CMP is 925.75. The Negative aspects of the company are High Valuation negative PE (P.E. = -10.30), Declining cash from operations annual and FIIs are decreasing stake. The positive aspects of the company are Low debt, zero promoter pledge, MFs are increasing stake and improving annual net profit.
Entry after closing above 932. Targets in the stock will be 971, 1010 and 1055. Long term targets in the stock will be 1085 and 1138. Stop loss in the stock should be maintained at closing below 848.
The above information is provided for educational purpose, analysis and paper trading only. Please don't treat this as a buy or sell recommendation for the stock. We do not guarantee any success in highly volatile market or otherwise. Stock market investment is subject to market risks which include global and regional risks. We will not be responsible for any Profit or loss that may occur due to any financial decision taken based on any data provided in this message.

PEL : Biggest Breakout of 4 month Piramal Enterprises has formed Descending Triangle pattern
Stock has given huge breakout around 930 levels
Target would be around 1150-1100
850 is Strong support for long term
If we correct then prices may take support around 850 levels.
Disclaimer : We are not SEBI registered analyst. Do your own research before taking any investment decision.


PEL is Bearish in my Opinion it can come up PEL is Bearish in my Opinion it can come up for short term but long term view is negative untill breaks 1147 high then it will reverse.

PIRAMAL ENTERPRISES This stock looking good for the long position or short term gain... Above 915 level.
I'm bullish on this stock if price sustain above 915 level and bearish below 782

Piramal Ent : Weekly : trend breakout and Momentum PEL have shown trend breakout on weekly chart with RoC Momentum with SL is 1730.
one can buy around 50% of gain at 1800-1820 with SL 1730 for better risk reward.
previous Momentum is respected and we are seeing 2nd momentum bar

Long PELNSE:PEL
Breakout on Daily done
Retest Complete
Now above Retest High level.
Volume is almost equal to Average Daily volume
Hence expecting upside

PELPel retest level we can see a short here. This is only for a study purpose. Please do your own analysis before trade

PEL ( Piramal Enterprise Ltd ) Pel, within wave III, wave 1 & 3 were equal, therefore, there is a good chance of wave 5 of wave III getting extended. within wave 5, lower degree wave i and ii looks complete and wave III should now unfold. daily oscillator stochastic has completed its pullback cycle and turned positive in oversold zones, and bands have narrowed. once macd turns positive and price closes above middle band, the stock can possibly rise higher towards 3200 plus, one can go long at these levels or in dips (if any) with stop loss of 2490 for targets of 3000 and 3200 plus.
Key levels are mentioned on charts
Weekly Cycle wave structure
Daily primary wave structure
Macd in daily
Stochastic in daily
Bollinger bands narrowed in daily
Disclaimer
I am not sebi registered analyst
My studies are Educational purpose only
Consult with your Financial advisor before trading or investing

Piramal enterprise looking good for upside | Ready for new highPiramal enterprise currently trading in the range of 1640-1740. It's chart is looking good for upside. So we give buy recommendation on Piramal enterprise with target of 2000.Logic behind the trade and levels marked on the chart.
Strategy:
Buy range:1740-1710
Add more @ 1680-1650
SL:1600
Target:1835/1925/1990
Educational purpose only.
Consult your financial advisor before taking any action.

Long on Piramal Enterprises(Daily)
- trendline breakout
- Above Medium term moving averages
- Volume spurt

PEL, DAILY CHARTPEL CAN SHOW 1284, 1250 AND 1180
Disclaimer
I am not SEBI REGISTERED Analyst
My Studies are Educational purpose only
Consult with your financial advisor before trading or investing

VIEWIf 15 min closes above 1487.90. go long for a target of 1500 at least and trail rest for 1510 -1520.

piramal enterprise trend line breakoutprice make really good breakout of trend line
same as head and shoulders pattern

PEL Rising Wedge - Intraday/very short term swingThis analysis is purely based on price action
The analysis is on 15min TF hence target can be achieved in intraday trade or in couple of days
Trade strategy is explained in image itself.
Always plan your trade & trade your plan
Keep trailing SL accordingly once in trade
Trade at your own risk and money management
Feel free to comment for any queries & suggestion

PEL INTRADAY TECHNICAL ANALYSISAs per the Technical Analysis Chart Pattern, PEL Share Intraday view.
The potential upside with the view of 1334 as the first target from the current price of 1321. We can follow the strict Stop Loss of 1312. It is only Buy Above the resistance of level of 1321. 1343 can be kept as second target.
Traders, If you liked this idea, hit the like button and write in the comment section.
This is only for educational purposes.

R-0194 Short Term Cash Buy PEL @1513 - 1515 SL 1476 TGT 1575Short Term Cash Buy PEL @1513 - 1515 SL 1476 TGT 1575
Above VWAP + TK cross over + MACD cross over GO LONG
