Litecoin is Lagging.Company held Litecoin is emerging, we're only getting started. Arriba.
P.S. ETF deadline on August 4th, 2025.
CRYPTOCAP:LTC $113.80
Pitchforks


EOY based on yesterday's earnings and the flywheel effect# Alphabet's Accelerating Flywheel: Q2 2025 Earnings Validate the Strategy
technicals grounded in an anchored pitchfork hinged on the pre-covid levels (covid bottom just makes the path too aggressive for EOY) and fib retracements of the 2022 bear market decline. General and simple targets since moving averages aren't providing much clarity. Single stock analysis is even more voodoo than large sector indexes, so I'll focus on fundamentals instead:
## The Flywheel In Action: Q2 2025 Results
Alphabet's blowout Q2 2025 earnings provide concrete evidence that their integrated AI flywheel is already spinning faster. **Revenue grew 14% to $96.4 billion, crushing expectations**, while the company raised its 2025 capital expenditures from $75 billion to **$85 billion**—a bold investment that initially spooked some investors but actually signals the flywheel's acceleration.
### Why the $85 Billion Capex Increase is Strategic Genius
The additional $10 billion isn't just spending—it's **strategic reinvestment in the flywheel's core components**:
**Infrastructure Dominance:** Google Cloud revenue surged 32% to $13.6 billion, now approaching a $50+ billion annual run rate. The capex increase funds the massive data centers and TPU clusters needed to serve exploding AI demand.
**Competitive Validation:** Even OpenAI, Google's biggest AI rival, is now renting Google's TPU chips to power ChatGPT—choosing Google's proprietary hardware over Nvidia GPUs for cost-effective inference. This partnership alone validates the integrated hardware-software advantage.
**Market Leadership:** With AI Overviews reaching 2+ billion users (up from 1.5B last quarter) and Gemini hitting 450+ million users, Google is proving it can deploy AI at unprecedented scale while generating immediate revenue.
## The Core Flywheel System
**The Engine:** World-class AI research (DeepMind, Google AI) creating increasingly capable models that serve as tools for invention, not just products. Gemini's rapid user growth proves the models are competitive.
**The Fuel:** Search and YouTube revenue provides patient capital for long-term moonshots, while diverse data from billions of users continuously improves AI models. Q2's strong advertising performance ($64B+) funds the entire system.
**Custom Hardware Advantage:** Proprietary TPUs optimized for their AI software create faster, more efficient training and inference than competitors using general-purpose chips. OpenAI's adoption proves TPUs offer superior cost-performance.
**The Multiplier:** Quantum computing research that could eventually solve problems impossible for classical computers, creating step-change advantages in materials science and optimization.
## AI Integration Across the Ecosystem: The Ultimate Moat
Alphabet's true competitive advantage lies in **embedding AI across their existing billion-user platforms**, creating compound defensibility:
**Search Dominance:** AI Overviews now appear in 2+ billion monthly searches across 200+ countries, fundamentally changing how users interact with information while maintaining Google's search monopoly. Users increasingly expect AI-powered results, making switching costs even higher.
**Productivity Lock-in:** Gmail's Smart Compose, Google Docs' AI writing assistance, and Sheets' intelligent data analysis create sticky enterprise and consumer habits. Once teams adopt AI-enhanced workflows in Google Workspace, migration becomes exponentially more difficult.
**Developer Ecosystem:** Google's coding tools (Colab, Android Studio) now feature AI pair programming, while languages like Go and Dart benefit from AI-optimized development. This creates a generation of developers trained on Google's AI tools.
**Educational Moat:** Chromebooks in schools now include AI tutoring and personalized learning, creating habits among students who will become tomorrow's decision-makers. Google for Education's AI features make alternative platforms seem primitive.
**Entertainment Integration:** YouTube's AI-powered recommendations, creator tools, and content moderation have become so sophisticated that creators and viewers alike can't imagine the platform without them. This strengthens YouTube's dominance over TikTok and other competitors.
**Mobile and Browser Dominance:** Android and Chrome's AI features (Smart Reply, intelligent autofill, predictive text) create seamless experiences that competitors struggle to match without Google's data advantages.
## Near-Term Flywheel Accelerators
**Physical AI & Robotics:** Moving from digital-only AI to robots that can perceive and manipulate the physical world. Waymo has now driven 100+ million autonomous miles, generating unique physical-world training data.
**AI Biology:** DeepMind's protein folding breakthroughs and Isomorphic Labs' drug discovery pipeline could create massive pharmaceutical revenues while advancing the core AI engine.
**AI Materials Science:** Already discovering thousands of new materials that could dramatically improve batteries, semiconductors, and other hardware across all ventures—feeding back into better TPUs and infrastructure.
## The Compounding Network Effects
**Data Flywheel:** More users → More training data → Better AI models → Better products → More users. AI Overviews now drive 10%+ more queries for the types of searches that show them.
**Revenue Flywheel:** AI success → Higher cloud/advertising revenue → More R&D investment → Better AI → Market expansion. Google Cloud's 32% growth funds continued AI leadership.
**Talent Flywheel:** Best AI infrastructure → Attracts top researchers → Better models → More ambitious projects → Attracts even better talent. The recent $2.4B Windsurf acquisition shows Alphabet winning the talent war.
**Infrastructure Flywheel:** More AI demand → Larger TPU deployments → Better hardware optimization → Lower costs → More competitive offerings → More demand.
**Ecosystem Lock-in:** AI features across Gmail, Docs, YouTube, Search, and Android create switching costs that compound across products. Users don't just leave Google Search—they'd have to abandon their entire digital workflow.
## The Strategic Moat Widens
While competitors excel in individual areas, Alphabet's advantage comes from **deep integration creating compound effects**:
- **Capital Moat:** The $85B capex commitment (13% increase from 2024) exceeds most competitors' total revenues
- **Integration Moat:** OpenAI using Google TPUs despite being competitors proves the hardware-software integration is unmatched
- **Scale Moat:** 2+ billion AI Overview users and $50B+ cloud run rate create network effects competitors can't replicate
- **Ecosystem Moat:** AI embedded across Search, Gmail, YouTube, Android, Chrome, and Workspace creates compounding switching costs
- **Innovation Velocity:** Time from AI research to deployed products at billion-user scale continues compressing
## The Key Insight
The Q2 earnings reveal that Alphabet isn't just building an AI company—**they're building the infrastructure that accelerates invention itself**. Each breakthrough feeds back into the system: new discoveries generate revenue that funds more research, create better tools for the next breakthrough, and attract top talent.
More importantly, they're embedding AI so deeply into users' daily workflows—from Gmail to YouTube to Search—that switching becomes not just inconvenient but practically impossible. When your email, documents, entertainment, and information all work seamlessly together through AI, why would you ever leave?
The $85 billion capex increase signals management's confidence that they're approaching "escape velocity"—where their innovation rate becomes impossible for competitors to match. While others debate AI spending, Alphabet is already demonstrating profitable AI deployment at unprecedented scale while simultaneously investing in the next acceleration phase.
**The Bottom Line:** Alphabet's integrated flywheel of AI research, proprietary hardware, massive data, and patient capital is creating an innovation velocity that competitors are finding increasingly difficult to match. But their true moat is embedding AI so deeply into billions of users' daily habits that the entire Google ecosystem becomes indispensable—and the Q2 results prove this strategy is already working.

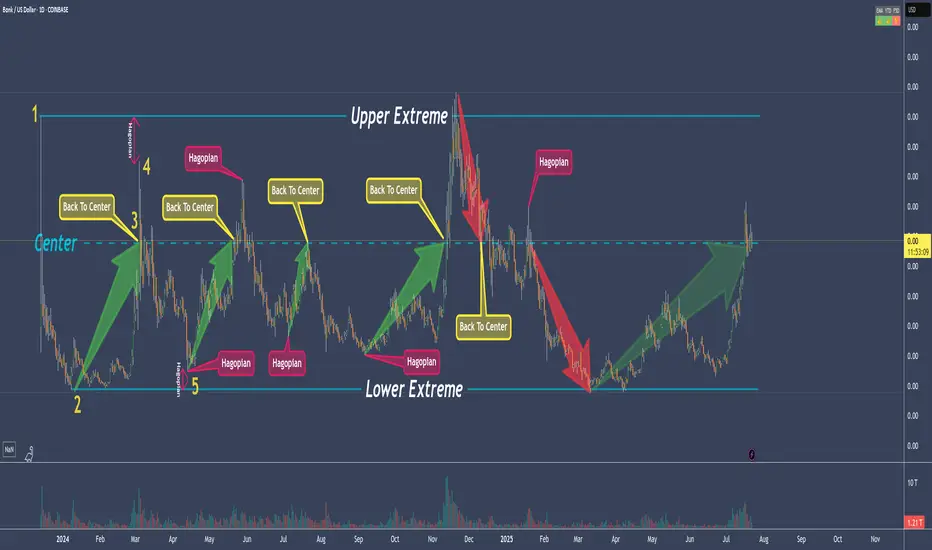
80% Of Time - A Trading Edge You Don't Want To MissDo you want to know why trading with median lines, also known as pitchforks, can be so successful? It’s simple:
Prices swing from one extreme back to the middle.
From the middle, they often swing to the other extreme.
What do we see on the chart?
- The upper extreme
- The center
- The lower extreme
So far, so good.
Now let’s follow the price and learn a few important rules that belong to the rulebook of median lines/pitchforks, and with which you can make great trades.
Point 1
The price starts and is sold off down to…
Point 2
...and from there starts to rise again, up to…
Point 3
...which is the center. And here we have a rule that is very important and one that you need to be aware of in trading to be successful:
THE PRICE RETURNS TO THE CENTER IN ABOUT 80% OF ALL CASES
If we know this, then we can stay in a trade with confidence.
Point 4
The price climbed even higher but missed the upper extreme.
This is the “Hagopian Rule” (named after the man who discovered it).
And the rule goes: If the price does not reach the next line (upper extreme, lower extreme, or center), then the price will continue moving in the opposite direction from where it originally came.
Phew...that’s a mouthful ;-)
But yes, we actually see that the price does exactly this.
From point 4, where the price missed the upper extreme, the price not only goes back to the center but continues and almost reaches the lower extreme!
Now if that isn’t cool, I don’t know what is!
And what do we have at point 5?
A "HAGOPIAN"!
What did we just learn?
The price should go higher than the center line.
Does it do that?
Oh yes!
But wait!
Not only does the Hagopian Rule apply. Remember?
"The price returns to the center line in about 80% of the cases."
HA!
Interesting or interesting?
So, that’s it.
That’s enough for now.
Now follow the price yourself and always consider which rule applies and whether it’s being followed.
How exactly do you trade all this, and what are the setups?
...one step at a time.
Don’t miss the next lesson and follow me here on TradingView.
Wishing you lots of success and fun!
Median Line Trade RGTIPrice tests the LMH and rejects it. Look for a long at the retest. We get set at 12.50.
TP1 is logical at 2.5R and just before the prior top in case we fail to follow through
TP2 is at the median line. As Dr Andrews says "Price makes it to the Median Line 80% of the time".
Ok 'we got lucky' on some news for such a quick set of T/P's. Price definitely moved quicker than expected. However it wasn't luck that put us in the position.

US500 evening analysisMy primary count of bullish price action since 7 April 2025 low sees regular flat (regular flat A, zigzag B, impulse C), impulse C with ending diagonal 5 of (5).
Median line (red line) of pitchfork was never tagged, implies price action eventually returning to origin (5098.6).
Ending diagonal invalid above 6307.2, bears with high reward, low risk opportunity.

IBM: SHA-ttering ExpectationsAs we move through 2024, NYSE:IBM continues to demonstrate its strength as a technology powerhouse, particularly in cloud computing, AI, and cybersecurity. With a legacy rooted in innovation, IBM's deep history in encryption technologies and its forward-looking strategies make it a compelling buy for investors aiming to capitalize on the next wave of tech advancements.
Financial Performance:
Revenue Growth: IBM reported a 5% year-over-year increase in revenue for Q2 2024, driven primarily by its hybrid cloud and AI segments, which saw a combined growth of 12%.
Earnings Beat: The company beat analyst expectations with an EPS of $3.15, outperforming the consensus estimate of $2.98. This marks IBM’s fourth consecutive quarter of earnings beats, underscoring its operational efficiency and strong market positioning.
Cash Flow: IBM’s free cash flow improved to $9.5 billion for the first half of 2024, reflecting a 7% increase compared to the same period last year, providing ample liquidity for continued investment in innovation and shareholder returns.
Quantum Computing and AI Leadership:
Quantum Breakthroughs: In 2024, IBM announced a significant breakthrough in quantum computing with its 127-qubit 'Eagle' processor, which is expected to accelerate quantum application developments in fields such as cryptography, materials science, and financial modeling.
AI Advancements: IBM’s AI platform, WatsonX, continues to gain traction in the enterprise space, with a 15% increase in new customer adoption in 2024. The platform’s integration with IBM’s hybrid cloud solutions positions it as a leader in the AI-driven transformation of industries.
Acquisitions: IBM’s strategic acquisition of ReaQta in late 2023 is already paying dividends in 2024. This cybersecurity firm enhances IBM’s X-Force Threat Management services, making IBM a more formidable player in the fast-growing cybersecurity market.
Partnerships: The expansion of IBM’s partnership with SAP in 2024 is set to deliver joint cloud and AI solutions that address the needs of global enterprises, further cementing IBM’s role as a key technology enabler.
Technical Potential:
Stock Performance: As of August 2024, IBM’s stock is trading at $190 per share, up 25% year-to-date, but still trading at a forward P/E ratio of 12.5x, which is below the industry average. This suggests the stock is undervalued relative to its peers, providing a buying opportunity.
Price Target: Analysts are bullish on IBM’s growth prospects, with a consensus price target of $250, representing a potential upside over the next 12 months. This target is supported by expected continued growth in IBM’s high-margin cloud and AI businesses.
Dividend Yield: IBM continues to offer a robust dividend yield of 4.7%, providing an attractive income stream while investors wait for the company’s growth initiatives to further drive stock price appreciation.
- Q3 2024 Earnings: October 23, 2024 (preliminary)
- Q4 2024 Earnings: January 22, 2025 (measurable)
Did IBM develop Bitcoin? Goodluck.
$194.75 NYSE:IBM

GBPCHF long ideaTrading involves substantial risk and is not suitable for all investors. Past performance is not indicative of future results. Always conduct your own analysis and consider your risk tolerance before entering any trade.😉😉

ETH shortTrading involves substantial risk and is not suitable for all investors. Past performance is not indicative of future results. Always conduct your own analysis and consider your risk tolerance before entering any trade.😉😉

The GENIUS Act: A Historic Breakthrough in Stablecoin RegulationIn the fast-evolving world of cryptocurrencies, stablecoins have carved out a unique role, acting as a bridge between digital assets and traditional finance. Until recently, however, the regulatory framework for these instruments remained fragmented and unclear. The adoption of the GENIUS Act marks the first major step toward establishing a coherent regulatory system for stablecoins in the United States — an event already being hailed as a historic breakthrough.
What Is the GENIUS Act?
The GENIUS Act (short for "Guaranteeing Effective National Incorporation of Ubiquitous Stablecoins") is a legislative initiative designed to set clear rules for the issuance, backing, and circulation of stablecoins. Its primary goal is to ensure transparency, stability, and security for users, investors, and financial institutions engaging with these digital assets.
The bill has received bipartisan support, demonstrating a broad political consensus on the need to bring order and trust to the digital asset market.
Why Is It a Breakthrough?
Before the GENIUS Act, the legal status of stablecoins existed in a regulatory "gray area." Issuing companies often faced uncertainty: were they subject to banking laws, SEC oversight, or fintech regulations? This ambiguity led to high-profile lawsuits, account freezes, and declining institutional trust.
The GENIUS Act introduces:
A licensing framework for stablecoin issuers, requiring 100% reserves in fiat currency or secure liquid assets
Mandatory audit and reporting standards, including independent verification and public disclosures
Clear separation between fiat-backed and algorithmic stablecoins, acknowledging their different risk profiles
Mechanisms for coordination with the Federal Reserve, paving the way for stablecoin integration into the broader financial infrastructure
Impact on the Market
The passage of the GENIUS Act has already had a ripple effect. Major issuers like Circle (USDC) and Paxos have expressed their readiness to comply with the new standards. Meanwhile, less transparent players are beginning to lose market share.
Institutional investors — including banks and asset managers — are increasingly viewing stablecoins as a reliable instrument for payments and capital storage. This growing confidence could be the key to the mass adoption of Web3 apps, decentralized finance (DeFi), and digital commerce.
Global Significance
The GENIUS Act also sets a precedent for other countries. Just as the U.S. once led the way in traditional financial regulation, it is now establishing benchmarks for digital assets. The EU, UK, Singapore, and others are closely analyzing the bill’s elements for adoption in their own jurisdictions.
Conclusion
The passage of the GENIUS Act represents a historic step toward crypto market maturity. It not only eliminates regulatory uncertainty but also lays the groundwork for sustainable digital economic growth. For the first time, stablecoins have a clear, institutionally recognized legal status — marking the transition from chaotic innovation to structured trust.

Crude Oil - Two Scenarios and about Brain PowerPrice retests the L-MLH.
VI. - Price breaks upward, target is the centerline
VII. - Price reverses again, then the target is the 1/4 line, with a subsequent extended target at the red centerline, and possibly even lower at the white dashed warning line.
On a personal note:
I was once again told that the price didn’t do what I had projected.
...yeah, really, that’s how it is §8-)
After over 30 years in the markets and hundreds of coaching sessions, I’m still amazed that people think you can predict price movements as if with a magic crystal ball.
The fact that this belief still persists (even though they don’t understand even the absolute basics of trading) deeply concerns me at the core of my trading soul.
Because this growing irrationality clearly indicates that far too little is being done in terms of education – or humanity might simply go extinct in the next 100 years due to rapidly declining intelligence!
...maybe I should just create a chart and apply a few median lines/forks?
Happy trading to all of you and I pray for those with lesser brain power.

USFD – US Foods has reached its zenithIn 2020, we had the action, and since 2024 the market's reaction. Just as Newton describes the universal law of Action/Reaction.
However, we see that USFD has reached the centerline of the white Fork, which coincides with the reaction high and the upper median line (U-MLH) of the yellow fork!
There is not much more to say about it.
It's a clear Short to me, and the target are always the Forks and the A/R lines. And if you have enough fantasy, GAP's are always get filled....
...they say.

WDFC - WD-40 a good shortWD-40 changed direction to the south after the 5/0 count.
Soon it will become clear whether the support from (4) holds or not.
But what is already apparent is that WDFC is struggling significantly at the trend barrier. No surprise, since this price level coincides with the natural resistance.
To me, this seems like a cheap short, even though a new, true low hasn't been reached yet.
A stop behind the resistance Zone is a fair bet.

AMZN Struggles at Trend-Barrier and ResistancePrice is still in upward mode.
Why am I bearish?
1. Rejection in the Resistance Zone
2. Second Hagopian
3. Close below the Red Forks 1/4 Line
PTG1 is the Center-Line.
Potential further PTG's below at the 1/4 Line and then of course the L-MLH.
Playing it with Options which give me much more leeway. For a hard Stop I would put it right behind the last high above the TB.

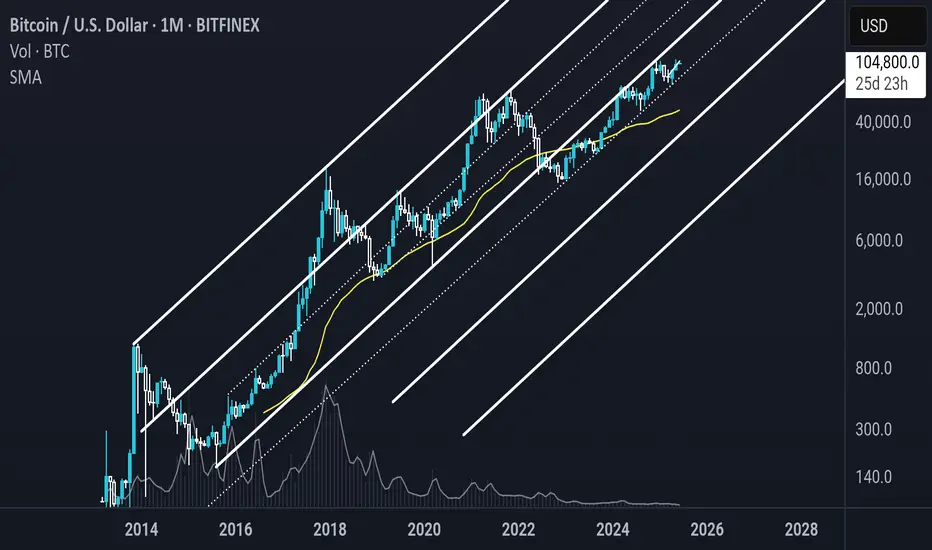
BTC Log Trend accumulation/expansionnoticed this Accumulation/Expansion/Contraction idea when trending along the Log Pitchfork lines.
and the high correlation to SPX (and M2) for direction.

BTC log pitchfork (re-up)the BTC Log scale Pitchfork shows perfect Fib levels being respected. I don't know what it means or how to interpret this, no price target or direction from this, but the levels seem significant so I'm just noticing and playing the levels being held. All I know is buy the yellow the line (SMA40), and I drew the next lower pitchfork levels according to proportions.
Also, last season's ATH is always the next bearmarket season's bottom.
When in doubt, zoom out.
DAX Take 1 Part 2 – Reloaded but not yet good to goThe first time, we saw the DAX poke the 1/4 line.
This was followed by several attempts (distribution by the big players), and from that point on, it headed south and the DAX rolled down the hill.
Currently, it looks very similar.
I’m watching and observing the break of the trend barrier very closely, even on smaller timeframes than the daily.
The profit targets are indicated by the red arrows.
After the break of the thick white centerline, a strong retest of the CL could be in store.
My main target would then be the red centerline.
Since the markets are behaving completely irrationally, I’ll need more “breathing room” in the trade and will handle this trade using long-dated LEAP options.
...poor little guy §8-)

Is This Brutal Sell-Off Finally Setting Up a Reversal?Looking at TON here and I'm seeing some interesting developments that caught my attention. We've been in this brutal downtrend since the November highs around $7, but the price action in this current zone is telling a different story.
The Setup:
Price has been getting absolutely hammered from that strong supply zone I've marked around $6.50-7.00. Every bounce into that area got sold hard, which is classic distribution behavior. But now we're sitting in what I believe is a critical accumulation zone between $2.50-3.50.
What I'm Watching:
The multiple trend line breaks and retests suggest we might be building a complex bottom here. That descending wedge pattern is textbook - these usually resolve to the upside, especially when you're this oversold on higher timeframes.
The fact that we're holding above the $2.50 psychological level despite all the selling pressure is actually pretty bullish. Smart money doesn't let good projects stay this beaten down forever.
My Take:
I'm cautiously optimistic here. The risk/reward is starting to favor the bulls if you're thinking longer term. That green arrow I've drawn isn't just wishful thinking - the technical setup supports a potential move back toward the $5-6 range over the coming months.
Risk Management:
Obviously this could still leg down further. Crypto markets are brutal and TON isn't immune to broader market weakness. But if Bitcoin cooperates and we start seeing some alt season momentum, this looks like it could be one of the better setups.
Not financial advice, just sharing my chart reading. Always size your positions appropriately.

Analysis of BTC price prediction for 2025 to 2026Hello sexy friends, I hoping that you are very good and be successful in this market today.
Based on the released data bullrun not happened yet and market still collecting the liquidity for a big movement, don't worry this year will finishing very nice by a great momentum....I want to all of we can give a nice profit from the market.
This analysis based on pitchfan tools that BTC can gets to high levels consist of 3 tp that I think :
Tp1 : 108,000$ that reached successfully
Tp2: 160,000$ common soon...
To3: after correction will happening
Be patient 🙏 and wait
All Tim be successful.
Kiss 👄 😘 all of you.

Later, Bitcoin!Bitcoin remains in a long-term bullish trend, but it currently appears significantly overvalued relative to gold. The recent breakout, followed by a re-test of the upsloping wedge formation, suggests that bullish momentum may be waning. This could indicate that capital is beginning to rotate out of Bitcoin. As a result, it may be more prudent to revisit the market in one to two years ahead. This shift may also mark the beginning of a potential altcoin season.

The Great FallGiven last week's GDP news, it's not far-fetched to expect a drop below 15,500 if the Fed doesn't cut interest rates.

DXY, big picture analysisTechnical analysis for DXY.
Looking for bottom about 89.209 to complete wave B of zigzag (Y).
Would then look for wave C of (Y) to break above 121.020 resistance (bearish pitchfork never tagged median line).

bullish SPY (pitchfork based)SPY reached the bottom of one pitchfork and the middle of the second one and bounced back up. I expect the bounce to continue
