📈Checkout the dominance, AltSeason is close!📉CRYPTOCAP:BTC.D
BINANCE:BTCUSDT
There are two scenarios for the start of a bullish rally in altcoins.
Scenario 1: If Dominance fails to break above the 53.35 level, it will move towards the bottom of the pitch-fork. In that case, we will have a short but relatively intense and exciting rally in altcoins.
Second scenario: With Dominance stabilizing above the level of 53.35, the rise of Dominance to the level of 57 will cause Bitcoin to continue its rally and test the level of $70,000 and above. Further, by placing Dominance between two blue resistances and even falling to the bottom of the pitch-fork at the same time as Bitcoin stabilizes at around 65-70 thousand dollars, it can involve altcoins in a longer-term rally than the first scenario.
Note: This week, after a short period of time when I had little analytical activity on this page, I plan to introduce and analyze my suggested altcoins in this rising market. We will have fun plans soon.
✌💥If you are satisfied with my analytical content, please share my ideas💥✌
✍🐱👤Otherwise, make sure you leave comments and let me know what you think.🐱👤✍
🍾Thank you for your support. I hope you will gain profit by following my analyses.🍾
Pitchforks

📈Bitcoin is going to rebound? / Trading setups (Updates soon)📉BINANCE:BTCUSDT
COINBASE:BTCUSD
Hello dear traders.
In the 2-hour timeframe, Bitcoin is trying to stabilize above the 2-hour and 4-hour middle Bollinger lines.
The $69,500 level is an important resistance in front of Bitcoin, if Bitcoin fails to pass this resistance, a head-and-shoulders pattern scenario is likely.
Otherwise, above the $69,000 level, the Bitcoin scenario will change. (This analysis will be updated later)
✌💥If you are satisfied with my analytical content, please share my ideas💥✌
✍🐱👤Otherwise, make sure you leave comments and let me know what you think.🐱👤✍
🍾Thank you for your support. I hope you will gain profit by following my analyses.🍾

A walk through on $EURUSD cycleFX:EURUSD cycle recap
Daily Cycle - we likely printed 'DCH" (early) and are started the decline to a weekly cycle low scheduled for early to mid May.
Weekly Cycles - Almost at ICL - late in the cycle and looking for undercut to break the inclining trendline
Monthly Cycle - Still early within the monthly cycle. Monthly HCL should occur summer 2025, for time being we are consolidating below the median line

XAUUSD, a bullish case scenario for april 2024after what gerome powell said last night, XAUUSD hit it all-time highest price ever, this happend as gold break the bearish trend i drew last week, immediately changing the resistant trend in to a support trend and the prices flew. relying mainly on Fibonacci retracement and basic support and resistance methods and the pitchfork strategies, i believe XAUUSD will reach 2250 and then if it break the resistance it will go higher to near 2280, however, if it could break the resistance, then it will come back down to 2190.

$AMD Cycle outlook into Sep-Oct 2024NASDAQ:AMD cycles
Daily - looks to have started decline to HCL which is putting NYSE:ADM at a risk of daily cycle failure.
Weekly - printed weekly swing low on the tail end of the weekly cycle. Looking for the decline into ICL around mid May
Monthly - Bigger picture, just coming out of 7 year cycle low. We typically dip into HCL decline into month 23-25 so a final decline to YCL should be around Sep-Oct 2024

📈DYDX is going to retest or fall further📉 BINANCE:DYDXUSDT
KUCOIN:DYDXUSDT
Hello traders.
I believe in DYDX, why? Because this all-season (before or after halving) DEX (decentralized exchanges) are going to be under more attention.
right now, there are 3 scenarios in front of the traders.
in 1 & 2, the price can retest the 2- or 4-hour Bollinger midline and then retest the lower level of the pitchfork.
in 3, due to the heavy sell pressure, the price can sorely decrease below the 3.498 level. In that case, the bearish target would be $3.153.
✌💥If you are satisfied with my analytical content, please share my ideas💥✌
✍🐱👤Otherwise, make sure you leave comments and let me know what you think.🐱👤✍
🍾Thank you for your support. I hope you will gain profit by following my analyses.🍾

📈Bitcoin Next Stage 75K? / Trading setups (Updates soon)📉BINANCE:BTCUSDT
COINBASE:BTCUSD
Hello dear traders.
A few hours ago, before I left the Bitcoin analysis chart. I drew two bullish and bearish scenarios for Bitcoin.
Despite being late for a valid entry, I still think Bitcoin will go near the $75,000 level before the price correction. However, in the current situation, Bitcoin should not go back below the pitchfork nearest line (blue line). A bearish scenario could happen sooner if Bitcoin returns below the indicated blue line.
✌💥If you are satisfied with my analytical content, please share my ideas💥✌
✍🐱👤Otherwise, make sure you leave comments and let me know what you think.🐱👤✍
🍾Thank you for your support. I hope you will gain profit by following my analyses.🍾

With 5-0 pattern on top, we might see 50ks againBuilding on the insights from my previous analysis , the Harmonic pattern 5-0 has emerged on the BTC chart on the 1H timeframe. This pattern is a relatively uncommon find, yet it's a powerful indicator of a potential trend reversal. With the pattern's completion, BTC appears poised to fill the gap indicated by the lower wick of a candle on the left side of the chart. This could herald a further descent. The bearish outlook is supported by the breakdown of the blue channels, which have been meticulously computed as a variant of the Modified Schiff Pitchfork.
We're eyeing the 56-58k zone as our prospective target, where we see another imbalance (green). Should this support falter, our gaze may shift towards a more substantial floor in the lower 40k range. It’s noteworthy, however, that the 64k level could hold firm, demonstrating strength and potentially nullifying our bearish forecasts.

BTCUSD Support at 62000 on Tenkan Sen DailyBTCUSD Support at 62K when the price meets Tenkan Sen and pitchfork on the Daily. If it breaches that next support is way below when it hits or meets SSA

📉Gold prediction / Suggested Price Pattern📈FOREXCOM:XAUUSD
OANDA:XAUUSD
Hello dear traders.
If the price does not consolidate above the $2152 level, a bearish scenario will occur.
On the other hand, if the price receives strong support at the bottom of the pitchfork or stabilizes above the 2-hour Bollinger Midline, the bullish scenario will increase the price to the yellow zone.
✌💥If you are satisfied with my analytical content, please share my ideas💥✌
✍🐱👤Otherwise, make sure you leave comments and let me know what you think.🐱👤✍
🤑🍾Thank you for your support. I hope you will gain profit by following my analyses.🍾🤑
CrazyS✌

Will BTC Test the Lower 50ks Again?
BTC is experiencing a retracement after its recent bullish breakout. The battle at the strong support level of approximately 69k has shifted to the 65k-67.5k band. So, what's the next stop (possibly terminal) for this pullback? I anticipate BTC might revisit the mid-50k range, with a high chance of briefly dipping into the lower 50ks. This prediction stems from the Harmonic pattern formation (Cypher, Shart, etc.) and the parallel channels visible on the chart.
Interestingly, I'd overlooked that we've been navigating within a dark-orange, red-edged channel for quite some time. It's highly probable that this channel will act as a support in this scenario, aligning with insights from other analyses.

📈Ethereum overtake Bitcoin after Dencun update!📉BINANCE:ETHUSDT
COINBASE:ETHUSD
Ethereum can start an upward scenario on the eve of its update.
The condition for the occurrence of this bullish scenario is the stabilization of the price in the yellow range.
after that, the bullish scenario can continue up to the level of 0.06 and after stabilizing above specified level, it can go up to the channel.
✌💥If you are satisfied with my analytical content, please share my ideas💥✌
✍🐱👤Otherwise, make sure you leave comments and let me know what you think.🐱👤✍
🍾Thank you for your support. I hope you will gain profit by following my analyses.🍾

📈DYDX quick long-position📉BINANCE:DYDXUSDT
BYBIT:DYDXUSDT.P
Hello dear traders.
If the price does not return below the $3.8 level, the bullish scenario will be strong.
✌💥If you are satisfied with my analytical content, please share my ideas💥✌
✍🐱👤Otherwise, make sure you leave comments and let me know what you think.🐱👤✍
🍾Thank you for your support. I hope you will gain profit by following my analyses.🍾

BSV Has been sold off at $120 but buying is looking text book bullish to me.. if it can hold 110 short term it should be good to break the highs.

BTCUSD morning updateThe only bearish case I can make for BTCUSD at the moment. On the left, pitchfork drawn from ATL/Nov 2021 high/Nov 2022 low showing profit taking/resistance at .25, .5, and .75 areas (circled areas), with last stop in the 76k-80k area. On the right, you can see price action on log scale, where the count doesn't look as ridiculous. Primary wave 4 ends up being an expanded flat, to accommodate what looks like an impulse wave from Nov 2021 to Nov 2022. I think that the only way this count gets realized is with a near-term cataclysmic drop in equities below their October 2022 lows.

🐶Floki Inu(FLOKI)🐶 is Ready to Correct 🚨➖50%🚨🐶One of my favorite meme coins is Floki Inu(FLOKI) . A few months ago, I shared with you the analysis that Floki Inu(FLOKI) has increased by more than 😱 ➕2000% 😱 so far.
💡 Floki Inu(FLOKI) began to rise after the community of users of this meme coin voted to burn 190 billion FLOKI tokens . But will this growth continue❗️❓
🙏Please, Stay with me.
🏃♂️ Floki Inu(FLOKI) is currently moving in the 🟡 Potential Reversal Zone(PRZ)($0.000215-$0.000136) 🟡and near the upper line of the ascending channel and Pitchfork line .
🌊According to the theory of Elliott waves , Floki Inu(FLOKI) seems to be on the way to completing the Double Three Correction(WXY) , so Floki Inu(FLOKI) is currently completing the main Y wave .
🔔I expect Floki Inu(FLOKI) to correct(➖50%) at least the 38.2% Fibonacci level and 🟢 Support zone($0.00002322-$0.00001528) 🟢.
❗️⚠️Note⚠️❗️: An important point you should always remember is capital management and lack of greed.
Floki Inu Analyze ( FLOKIUSDT ), 2-day time frame ⏰.
Do not forget to put Stop loss for your positions (For every position you want to open).
Please follow your strategy; this is just my Idea, and I will be glad to see your ideas in this post.
Please do not forget the ✅' like '✅ button 🙏😊 & Share it with your friends; thanks, and Trade safe.

THOT Dot, is gonna stop?If you find this information inspiring/helpful, please consider a boost and follow! Any questions or comments, please leave a comment!
THOT #DOT 🧵
Still in since 6.448
It held 7.00 and broke the pivot high!
Another dino coin that could be a 3 of 3
or an ext 5th.
A break of this level and flip as W4 is ideal.
$13 is the next AOI if this is broken.

BADGERUSDT.PUsing a simple Pitchfork, it can be predicted that the BADGER probability of growth is very high

The NVidia Party About to PopNVidia left behind a yawning gap, it is now testing the support formed after that gap, the price point of failure is $403.11, if we go lower than that we have higher conviction that we drop to fill the gap. For now indicators show it is oversold so we can expect a bounce which I would expect to be rejected at the intersection of horizontal resistance and median line of Pitchfork.

SPY bearish pitchfork analysisI drew these pitchfork lines before Oct. 15, 2023 when I posted my last SPY idea, titled "SPY: strong bullish pitchfork analysis" (see related idea below). At that time SPY was 427.48. Now it's 470.80. SPY reached the top pitchfork line that I drew back in Oct. 15 last year and is at this time expected to fall further.

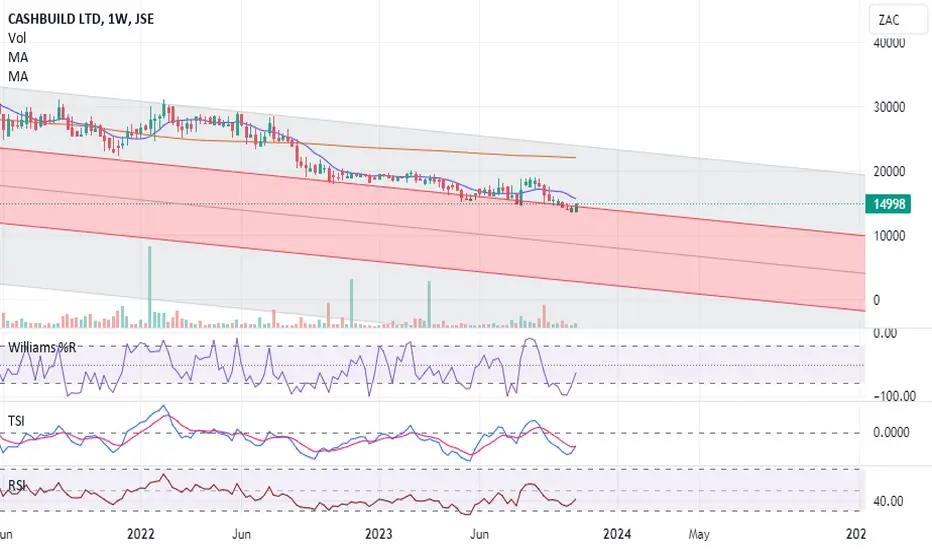
Cashbuild Showing Signs of Trend ReversalCashbuild is in pursuit of a weekly and yearly low price, here we see price finding support at the 0.382 line of the Pitchfork bouncing off it. In the process it has created hidden divergence on the TSI & RSI indicators. We can open a long position when price closes above the 10 week moving average, more risk accepting investors can go long on weekly swing low. Ideal to harvest some profits when we reach the resistance of the Pitchfork but we will be assessing these moves on a daily chart timeframe.
BTC Rally to $100KINDEX:BTCUSD
In 2023, Bitcoin:
Rallied off the lows
Broke through the ML
Retested and put in a base along the top of ML
Now in 2024, Bitcoin is breaking out from that base.
Hopefully, volume will confirm over the coming weeks. (Screenshot below)
But... there is no sense in waiting if you aren't "in" already.
Near perfect long setup as it is, plus BTC halving is about to take place sometime in April.
Get Long.
Take profit at the upper ML-H or move your stop up right below upper ML-H once it gets there.
Fat_Fat

Eyeing 2033 Reversal might happen in the next few hours, there's still room to go up but 2033 would be a good entry for sell or the next resistance after it.
